Running an online store is exciting — until the day it goes offline.
Maybe it’s a sudden traffic spike.
Maybe the hosting provider is having issues.
Maybe a plugin update didn’t go the way you hoped.
Whatever the reason, downtime hurts. Every minute a store is unavailable, customers can’t shop, ads continue spending, carts get abandoned, and the reputation you worked hard to build takes a hit.
If you’re a Shopify or WooCommerce owner, or you run a fully custom-coded store, uptime monitoring isn’t just a technical detail — it’s revenue protection. In this guide, we’ll break down what uptime monitoring is, why it matters, and how store owners (even non-technical ones) can implement it properly.
Why Uptime Monitoring Matters More for eCommerce Than You Think
Let’s paint a quick picture.
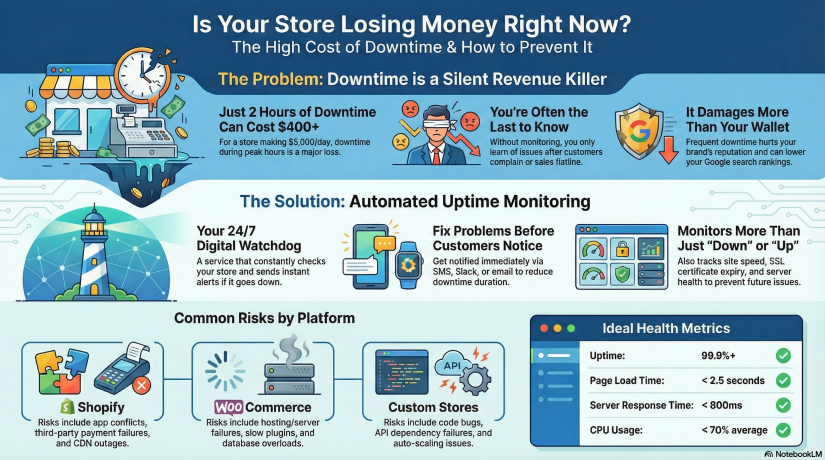
Imagine your store makes $5,000/day in sales.
That’s about $208/hour.
Now imagine your store goes down for just 2 hours during peak traffic.
You just lost over $400 without even knowing it happened — and customers who tried to buy from you might not come back.
Now scale that up during events like:
-
Black Friday / Cyber Monday
-
Product launch
-
Social media viral moment
-
Paid advertising campaign
-
Email marketing blast
-
Holiday season rush
During high-traffic events, just 30 minutes of downtime can cost thousands.
This is why uptime monitoring is essential. It allows you to:
- Know instantly when your store is down — before your customers do
- Reduce downtime with faster incident response
- Prevent revenue loss and protect brand trust
- Track performance over time with real monitoring metrics
- Build reliability — important for SEO & customer loyalty
Google even takes site reliability into account for ranking. Search engines don’t like unreliable websites — if crawlers repeatedly find your store down, your rankings can drop.
What Exactly Is Uptime Monitoring?
Uptime monitoring is a service that constantly checks your website to ensure it’s reachable and functioning. If something fails — server crash, DNS issue, payment gateway outage — you get notified immediately via email, SMS, push, Slack, Telegram, or other channels.
Think of uptime monitoring as 24/7 security for your online business.
Most website owners assume hosting includes monitoring. It does not. Hosting companies only guarantee infrastructure uptime (to a limit), but they don’t actively alert you when your site is down.
With uptime monitoring, you will know:
✔ When your website becomes unreachable
✔ When response times slow down
✔ If SSL is about to expire
✔ If server resources are overloaded
✔ If plugins or themes cause failure
Without monitoring, you only know after customers complain — or worse, after checking your revenue dashboard and seeing something is wrong.
Shopify vs WooCommerce vs Custom Stores — Different Stores, Different Risks
Let’s break down the typical risks each platform faces.
Shopify Stores
Shopify is stable, hosted, and handles infrastructure — but that doesn’t mean downtime can’t happen. Risks include:
Shopify takes care of hosting, you must take care of monitoring.
WooCommerce Stores (WordPress)
WooCommerce gives you more control — but with control comes responsibility. Risks:
-
Hosting/server downtime
-
Slow performance from heavy plugins
-
Caching issues
-
Expired SSL certificates
-
Vulnerability or malware attacks
-
Database overload during traffic peaks
WooCommerce stores must monitor server + website + SSL + DNS + performance.
Custom-Built Stores
Custom is unlimited — but also unpredictable. Risks include:
-
Bugs or deployment issues
-
API dependency failures (Stripe/PayPal failures break checkout)
-
Hosting or VPS instability
-
Cache misconfigurations
-
Auto-scaling failure
-
Cron jobs breaking
-
Custom code errors
Custom stores need the most comprehensive monitoring approach.
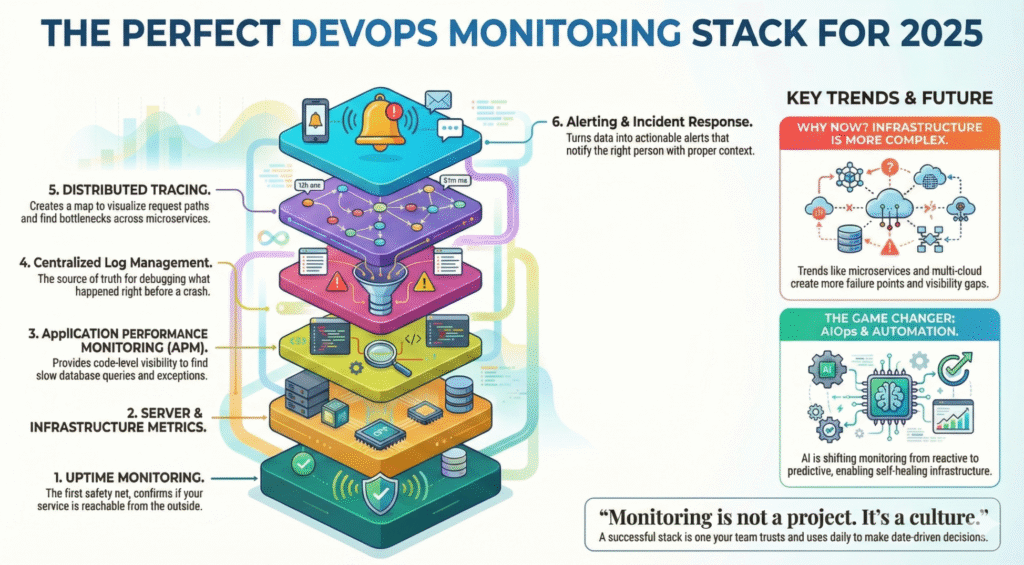
The 3 Layers of Monitoring Every Store Needs
1. Website Uptime Monitoring
Checks your URL from multiple regions every X seconds.
Good monitoring will test more than “is the page loading?” It will test:
If something breaks, you get alerted within minutes.
2. Server/Hosting Monitoring (WooCommerce & Custom Stores)
Tracks deeper infrastructure metrics such as:
| Metric |
Why it matters |
| CPU usage |
Spikes cause slow checkout & crashes |
| RAM |
WordPress + plugins = memory hungry |
| Disk |
Full disk = site instantly breaks |
| Network |
Packet loss = regional outages |
| Load average |
Predict performance degradation |
This is where platforms like Xitoring become useful.
You can monitor both uptime + server health in one place, meaning you catch problems early — before the site goes down.
3. SSL, DNS & Domain Monitoring
Small things store owners forget, but they break sites instantly:
-
SSL expiration = browsers block visitors
-
DNS misconfiguration = site unreachable
-
Domain expiration = business offline overnight
Your store might be perfect — but expired SSL = dead website.
Monitoring prevents this.
How Uptime Monitoring Tools Work (Simple Breakdown)
Here’s what happens inside an uptime monitoring system:
-
You add your store URL to the dashboard
-
The monitor pings your site from different global regions every few seconds/minutes
-
If it fails (timeout/500 error/slow response/SSL issue), a second location verifies
-
Once confirmed, notifications are instantly sent
-
A detailed report logs duration, cause & resolution time
This means you don’t have to constantly check your site manually — the system watches it for you.
Setting Up Monitoring for Your Store — Step-by-Step
Even if you’re non-technical, setup is simple.
For Shopify Stores
No server setup required — just monitor your front URL.
-
Add your store domain
-
Choose alert channels (email/SMS/Telegram/Slack)
-
Enable response-time monitoring
-
Add SSL expiration monitoring
-
Set check intervals (1–5 minutes recommended)
Optional advanced step: monitor specific URLs (checkout, add-to-cart, payment page)
For WooCommerce Stores
You should monitor website + server + database.
-
Add your store domain for uptime checks
-
Install server agent (if using VPS hosting)
-
Monitor resource usage (CPU/RAM/Disk)
-
Add MySQL database monitor
-
Enable plugin/theme update alerting
-
Monitor REST API endpoints
-
Add SSL & DNS monitoring
Bonus: create a status page to publicly show uptime history.
For Custom Stores
Create a multi-layer setup:
-
HTTP uptime monitoring
-
Ping monitoring
-
Port monitoring (80/443/DB/Redis)
-
Server resource logs
-
API endpoint monitoring
-
Cron job/queue monitoring
-
Synthetic tests for key flows
A simple test example:
Can a user add product → checkout → complete payment?
Synthetic monitoring can simulate that automatically.
How Xitoring Can Help (Naturally Integrated Example)
While many tools can monitor websites, eCommerce stores benefit most from a platform that supports both uptime + server monitoring + alerts + status pages — all together.
Xitoring allows you to:
-
Add uptime checks for Shopify/WooCommerce/Custom stores
-
Monitor CPU, RAM, Disk, Network of your servers
-
Create public or private status pages
-
Receive alerts through email, SMS, Slack, Telegram & more
-
Detect anomalies using AI-powered insights
-
Avoid downtime with automated alerts before failure happens
Instead of juggling multiple tools, you get an all-in-one overview of your store health.
Not promotional — just a realistic example of how store owners reduce downtime stress.
Real-World Downtime Scenarios & How Monitoring Saves You
Scenario 1 — Traffic spike crashes WooCommerce
Black Friday + shared hosting = server overload.
Without monitoring:
You notice only after angry emails or sales flatline.
With monitoring:
CPU/RAM spike alert → increase server power → downtime avoided.
Scenario 2 — Shopify App breaks the checkout
A newly installed upsell app conflicts with your theme.
Monitoring catches a jump in response times + checkout failures. You restore backup fast — no major revenue loss.
Scenario 3 — Custom site SSL expires
Browser warnings kill conversions. Easily preventable.
Monitoring alerts you days or weeks in advance. Crisis avoided.
KPIs Store Owners Should Track
To remain stable and fast:
| KPI |
Ideal Target |
| Uptime |
99.9%+ minimum |
| Page load time |
< 2.5 seconds |
| Response time |
< 800ms average |
| SSL expiry |
> 30 days before renewal |
| CPU usage |
< 70% average load |
| Error rate |
As close to 0% as possible |
Even beginners can track these.
Best Practices to Keep Your Store Online & Fast
- Run monitoring 24/7 — don’t rely on manual checks
- Test uptime from multiple global locations
- Monitor critical user flows, not just homepage
- Use a CDN & caching for faster response times
- Always monitor SSL, DNS & domain expiration
- Keep plugins/themes updated and secured
- Set alerting to multiple channels (email + SMS/Telegram)
A monitoring tool is your seat belt. You hope you never need it — but when you do, it saves you.
At the End!
Whether your online store runs on Shopify, WooCommerce, or a custom platform, uptime monitoring is one of the simplest and smartest steps to protect revenue. Downtime will happen eventually — what matters is how fast you know about it and how quickly you fix it.
Monitoring isn’t just technical infrastructure — it’s business protection.
It is reputation preservation.
It is revenue insurance.
And thankfully, setting it up today is easier than ever.
Take 10 minutes, add a monitoring setup, connect alerts — future-you will be grateful.