Introducing Customized dashboards!
In the ever-evolving landscape of server and uptime monitoring, Xitoring has yet again raised the bar with its newest feature: Customized Dashboards. This groundbreaking addition empowers users to tailor their monitoring experience to unprecedented levels, offering flexibility, precision, and unparalleled insights.
Quick Glance:
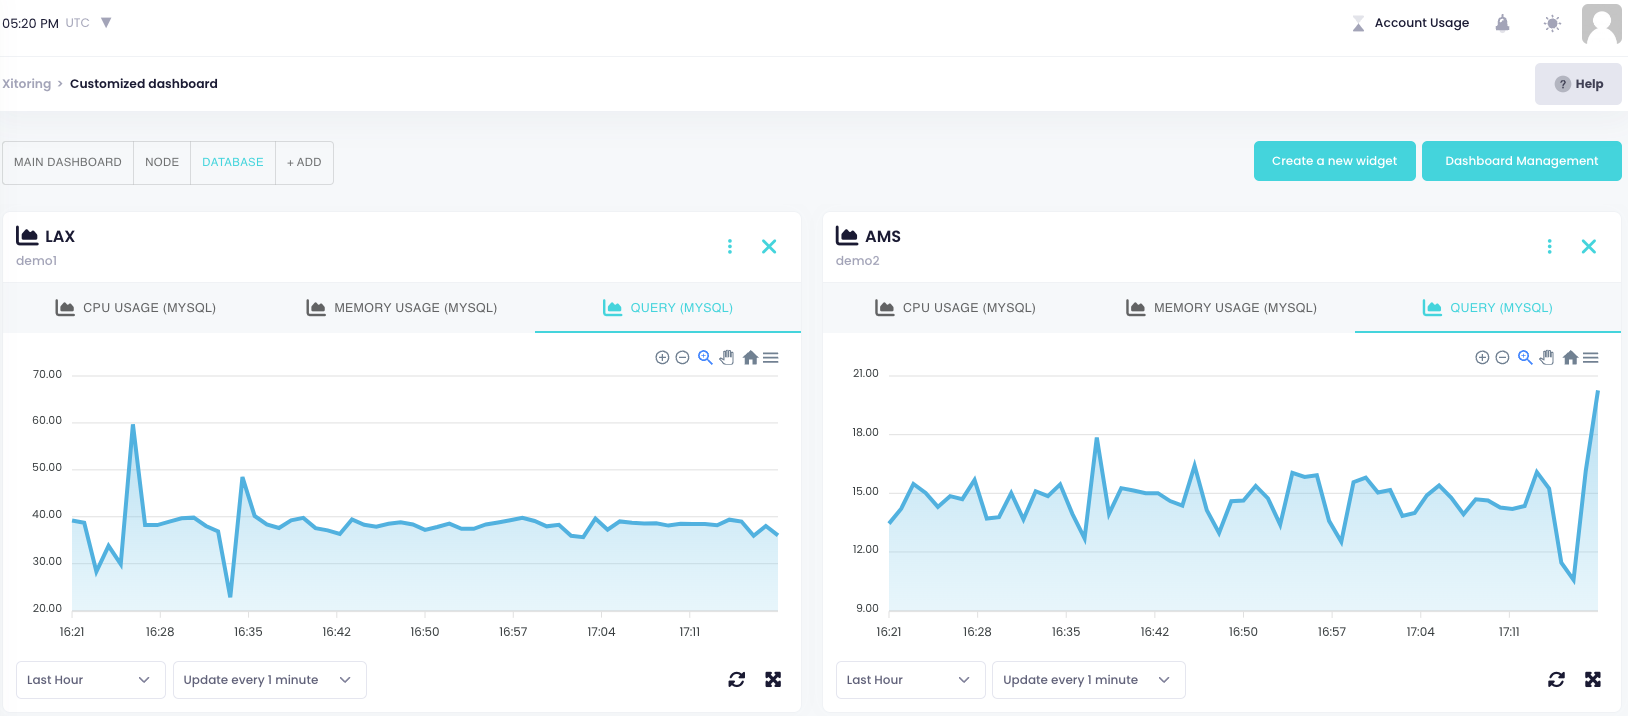
As a simple use case, There’s a special dashboard named “Database” which includes two widget from different servers, each containing desired graphs for Mysql Monitoring. Therefore, you can easily see how your database are performing in a glance!
Dive into Personalization: A Dashboard for Every Need
With the latest version of Xitoring, users can now create as many custom dashboards as they desire. This means the power to mold their monitoring interface according to their unique requirements is now at their fingertips. Whether you’re overseeing a multitude of webservers or managing specific groups or types, Xitoring’s Customized Dashboards let you curate your monitoring experience for maximum efficiency.
Dynamic Widgets: A Tab-Based Symphony of Information
The heart of this new feature lies in its dynamic widgets. Users can seamlessly switch between one or multiple graphs within a dashboard, thanks to a tab-based system. This ensures a fluid and intuitive user experience, allowing for quick and effortless navigation through a wealth of monitoring data.
Practical Use Cases: Tailoring Monitoring to Your Operations
- Dashboard for All Webservers: For those overseeing a comprehensive web infrastructure, Xitoring’s Customized Dashboards enable the creation of a dedicated dashboard that consolidates the critical information from all webservers. This unified view simplifies oversight and aids in quick decision-making.
- Dashboard for Specific Groups or Types: Tailoring monitoring to specific groups or types of servers has never been this straightforward. Users can now create dashboards that zoom in on precisely the servers that matter, streamlining their monitoring process and ensuring that attention is focused where it’s needed most.
- Uptime Checks Dashboard: Ensure the continuous availability of your services by creating a dedicated dashboard for uptime checks. Monitor response times, identify patterns, and proactively address potential issues to uphold the highest standards of service reliability.
- Database Dashboard: Delve into the intricate world of databases with a specialized dashboard. Track performance metrics, query execution times, and resource utilization to guarantee optimal database functionality. Identify bottlenecks and optimize performance for a seamless user experience.
- Software-Specific Dashboards: Tailor your monitoring to the unique requirements of your software stack. Whether it’s a specific application, middleware, or a combination of software components, Xitoring’s Customized Dashboards allow you to create focused views that provide insights into the health and performance of your software ecosystem.
- Metrics Dashboards (CPU, Memory, etc.): Fine-tune your infrastructure by creating dashboards that concentrate on crucial metrics. Monitor CPU usage, memory consumption, and other vital metrics to ensure that your servers operate at peak efficiency and address resource bottlenecks proactively.
Unlimited Widget Placement: Fine-Tuning Your Monitoring Experience
Xitoring’s commitment to user-centric design extends to the unlimited placement of widgets. Users have the freedom to populate their dashboards with as many widgets as needed, each specified to display the exact information required. This level of granularity in customization ensures that users have a comprehensive and detailed view of their infrastructure.
The Future of Monitoring: In Your Hands
In conclusion, Xitoring’s Customized Dashboards mark a significant leap forward in the realm of server and uptime monitoring. By placing the power of personalization in the hands of users, Xitoring continues to redefine what’s possible in the world of monitoring solutions. As we usher in this new era of tailored monitoring experiences, we invite users to explore the full potential of Customized Dashboards and take command of their monitoring like never before.
Stay tuned for more updates and innovations as Xitoring remains dedicated to providing cutting-edge solutions for the ever-evolving needs of system administrators, co-founders, and software engineers alike.