Xitoring Integration with Zapier

What is Zapier?

Zapier is a web-based automation tool that connects different apps and services together, allowing them to communicate and automate tasks without requiring any coding skills. It works on the principle of “Zaps,” which are automated workflows that link one app to another. These workflows consist of a trigger and one or more actions.

Here’s how it works:

  1. Trigger: A specific event occurs in one app. For example, a new incident detected by Xitoring on your servers, or a packet loss was detected on your website.
  2. Action: Once the trigger event happens, Zapier automatically performs a predefined action in another app. For instance, it could create a task in Trello, add a contact to Mailchimp, or notify you on selected notification channels.

(more…)

What is Docker Container Monitoring?

Docker is a platform that makes it simpler to build, deploy, and execute programs utilizing containers. Containers enable a developer to bundle a program with all of its required components, including as libraries and other dependencies, and ship it all as a single package. This ensures that the program will operate on any other system, independent of any specific settings that may differ from the one used to write and test the code.

In a way, Docker is a bit like a virtual machine. However, unlike a virtual machine, rather than creating a whole virtual operating system, Docker allows applications to use the same Linux kernel as the system that they’re running on and only requires applications be shipped with things not already running on the host computer. This gives a significant performance boost and reduces the size of the application. (more…)

What is HAProxy Monitoring?

Do you struggle with website downtime and load management?

Ensuring that your online applications are highly accessible, secure, and performant is not a choice; it is a need. Many people wonder how they may do this without breaking the bank or overburdening their IT personnel. The solution is to use HAProxy to its full potential and develop appropriate monitoring methods.

What is HAProxy?

HAProxy, or High Availability Proxy, is an open-source load balancer and proxy server for TCP and HTTP applications. It is commonly used to split network or application traffic among multiple servers, which improves the dependability, efficiency, and availability of a service or application. HAProxy is well-known for its excellent performance, reliability, and extensive feature set, which includes SSL/TLS termination, HTTP/2 compatibility, WebSocket, and an advanced configuration syntax. (more…)

What is MySQL Monitoring?

MySQL is an open source relational database management system (RDBMS). It is based on a client-server architecture and is one of the most popular SQL (Structured Query Language) database management systems available today. MySQL is used to manage and organize data in tables, and it supports a variety of data types. It is commonly used in online applications and serves as the database component of the LAMP (Linux, Apache, MySQL, Perl/PHP/Python) web application software stack.

MySQL is known for its reliability, scalability, and flexibility.It can be used for a wide range of applications, from small to large-scale enterprise applications, and supports numerous operating systems including Linux, Windows, and macOS. Over the years, MySQL has become the go-to choice for many developers, particularly for web applications, due to its ease of use, performance, and strong community support; therefore, monitoring MySQL instances for better performance is becoming increasingly frequent.

(more…)

What Is TCP & UDP Monitoring

In our last topic about Network Protocols, we have dicussed about different type of network protocols like TCP and UDP. Today we are going deeper into these two and learn more about it’s importance and how we can monitor them.

What is TCP UDP Protocol?

TCP (Transmission Control Protocol) and UDP (User Datagram Protocol) are two of the core protocols of the Internet Protocol Suite, commonly referred to as TCP/IP. Both are used for sending bits of data—known as packets—over the internet but operate in significantly different ways, catering to different types of network applications. (more…)

What is API Monitoring?

An API, or Application Programming Interface, is a set of rules, protocols, and tools for building software and applications. It specifies how software components should interact. APIs are used to enable the integration between different software applications, allowing them to communicate with each other without knowing the internal workings of each other’s software.

There are several types of APIs, including:

  1. Web APIs: These are designed for the web and usually provide access to services over the HTTP protocol. Examples include REST (Representational State Transfer), SOAP (Simple Object Access Protocol), and GraphQL APIs.
  2. Library/Framework APIs: These APIs are part of libraries or frameworks and allow developers to use their functionalities within their own code. For example, the jQuery library provides an API for simplifying HTML document traversing, event handling, and Ajax interactions.
  3. Operating System APIs: These provide functions for interacting with the operating system, such as file handling, creating and managing processes, and networking. An example is the Windows API (WinAPI) for Microsoft Windows operating systems.
  4. Database APIs: These enable communication with database management systems. They allow for creating, reading, updating, and deleting data in a database. SQL (Structured Query Language) is an example of a database API.

APIs play an important role in software development by encouraging code reuse and modular programming. They let developers to use certain features without having to create them from start, saving time and effort.

How APIs working

How API is working?

APIs operate by establishing a set of rules and protocols for how software programs interact with one another.

  • Request for Service – An application (known as the client) makes a request to an API (hosted on a server) to access a specific service or data. This request is made via a defined interface, which includes the use of defined URLs (endpoints) and methods (GET, POST, PUT, DELETE, etc.) in the case of web APIs.
  • Processing the Request – The server that hosts the API receives the request. The API then interprets the request, performs the necessary actions required by the request (such as accessing a database, performing calculations, etc.), and prepares an appropriate response. This process might involve authentication and authorization steps to ensure that the requester has the right to access the data or functionality.
  • Sending the Response – The API sends a response back to the requesting application. This response can include the data requested, a confirmation of a successful operation, or error messages if the request could not be fulfilled for some reason. The data returned by APIs, especially web APIs, is often in a format that’s easy to parse programmatically, such as JSON (JavaScript Object Notation) or XML (eXtensible Markup Language).

Example Scenario:

Let’s consider a simple example of a weather application on your smartphone that retrieves weather data from a remote server via a web API.

  • Request: When you want to see the weather forecast, the app sends a request to the weather service’s API. The request includes your location and possibly your authentication token.
  • Processing: The server processes the request, fetches the relevant weather data (potentially from a database or another service), and formats it as a response.
  • Response: The API then sends this weather data back to your application in a structured format, such as JSON, which your app then interprets and displays on your screen in a user-friendly way.

This process allows different software systems to communicate and share data and functionality in a standardized way, enabling the rich and dynamic experiences users expect from modern software applications.

REST, SOAP, GraphQL. What are the differences?

REST (Representational State Transfer), SOAP (Simple Object Access Protocol), and GraphQL are three techniques for developing and deploying online services. Each has its own set of principles, benefits, and application scenarios.

REST (Representational State Transfer)

  • Architecture Style: REST is an architectural style rather than a protocol. It uses standard HTTP methods (GET, POST, PUT, DELETE, etc.).
  • Data Formats: Primarily uses JSON, but can also use XML, HTML, or plain text. JSON is favored for its simplicity and lightweight data structure.
  • Statelessness: RESTful services are stateless; each request from client to server must contain all the information the server needs to fulfill the request.
  • Performance: Generally faster and uses less bandwidth. It’s suitable for web services that need quick interactions.
  • Use Cases: Ideal for public APIs, web services where the operations are simple CRUD (Create, Read, Update, Delete) operations.

SOAP (Simple Object Access Protocol)

  • Protocol: SOAP is a protocol with a strict set of rules to be followed. It uses XML for messaging.
  • Data Formats: Exclusively uses XML for message format.
  • Statefulness: SOAP can support stateful operations.
  • Security: Offers built-in security and transaction compliance (WS-Security) that is more robust compared to REST.
  • Performance: Generally considered slower and more bandwidth-consuming due to the verbosity of XML.
  • Use Cases: Suited for enterprise-level web services where high security, transactional reliability, or ACID (Atomicity, Consistency, Isolation, Durability) compliance are needed.

GraphQL

  • Query Language: GraphQL is a query language for your API and a server-side runtime for executing queries. It allows clients to request exactly the data they need.
  • Data Formats: Uses a JSON-like syntax to describe data structures but returns data in JSON format.
  • Efficiency: Reduces the amount of data that needs to be transferred over the network. Clients have the ability to aggregate data from multiple sources in a single request.
  • Statelessness: Like REST, GraphQL APIs are typically stateless.
  • Performance: Can improve performance for complex queries and aggregations over multiple resources.
  • Use Cases: Ideal for complex systems and applications where the ability to request exactly the needed data is important. It’s also beneficial when the requirements for the data are likely to change frequently.

REST is favored for its simplicity and statelessness, SOAP for its strict standards and security features, and GraphQL for its flexibility and efficiency in data retrieval. The choice between them depends on the specific requirements of the project, including factors like the type of operations, the need for flexibility in the requests, and the importance of security and transactions.

What is an API Monitoring?

API monitoring is the process of watching and checking the performance and availability of application programming interfaces (APIs) to verify that they work properly and fulfill performance benchmarks and service level agreements (SLAs). It is an important aspect of API management since it ensures the quality of service for apps that rely on internal and external APIs.

  • Availability Monitoring – This checks whether the API is up and accessible at all times. It involves sending regular requests to the API and verifying that it responds appropriately, helping identify downtime or accessibility issues.
  • Performance Monitoring – This evaluates how well the API responds to requests under various conditions. It measures metrics such as response time, latency, and throughput, ensuring that the API meets its performance benchmarks.
  • Functional Monitoring – This involves testing the API to ensure it behaves as expected, returning the correct data or output in response to specific requests. This type of monitoring is crucial for verifying that the API continues to function correctly after updates or changes.
  • Security Monitoring – Security monitoring focuses on detecting unauthorized access and potential security vulnerabilities within the API. It includes monitoring for unusual activity that could indicate a security breach or attempted attack.
  • Error Tracking –This part includes identifying and documenting issues that occur when the API is called. Monitoring error rates helps to understand the API’s stability and may identify root causes that must be addressed.
  • Data Quality and Validation –This guarantees that the data given by the API is accurate, full, and properly structured. It is critical for applications that require accurate and trustworthy data from external sources.

Did you know API monitoring powered by Xitoring provides real-time alerts and detailed reports, enabling you and operations teams to quickly identify and resolve issues before they impact end-users. Effective API monitoring can lead to improved performance, reliability, and user satisfaction, making it an indispensable part of modern software development and operations.

Why Monitoring API Endpoints?

Monitoring an API endpoint is critical for plenty of reasons, all of which help to the overall health, security, and user experience of the apps that rely on it.

  1. Ensuring Availability

    API endpoints must be available when users or dependent services require them. Monitoring ensures that the API is available and operational, reducing downtime and the possibility of service disruptions.

  2. Maintaining Performance Standards

    Performance is crucial to the user experience. Slow or delayed API replies can cause annoyance, lower user satisfaction, and, eventually, the loss of users or clients. Monitoring enables teams to measure performance parameters like as response time, throughput, and latency, ensuring that the API fulfills the desired performance standards.

  3. Detecting and Diagnosing Issues Early

    By continuously checking API endpoints, issues can be detected and diagnosed early before they escalate into serious problems. This proactive approach helps in maintaining smooth operations and reducing the time and resources needed for troubleshooting and fixing issues.

  4. Security

    APIs are common targets for cyber attacks. Monitoring an API endpoint can help in identifying suspicious activities, potential security breaches, and vulnerabilities early, allowing for swift action to protect sensitive data and prevent unauthorized access.

  5. Optimizing User Experience

    The performance and reliability of API endpoints directly affect the user experience of applications that rely on them. By ensuring that APIs are responsive and available, organizations can provide a seamless experience to their users, which is crucial for maintaining user engagement and satisfaction.

  6. Compliance with SLAs

    Many APIs have service level agreements (SLAs) that specify the expected performance and availability levels. Monitoring helps in ensuring compliance with these SLAs, which is important for maintaining trust and contractual obligations with clients and partners.

  7. Cost Management

    Inefficient or faulty APIs can lead to increased bandwidth usage, unnecessary processing, and other resource wastages. Monitoring helps in identifying inefficiencies, enabling optimizations that can lead to cost savings.

  8. Data Accuracy and Integrity

    For APIs that deliver or receive data, it’s crucial to ensure that the data is accurate, consistent, and complete. Monitoring can help verify data integrity and quality, which is especially important for applications that rely on up-to-date and precise information.

To summarize, monitoring API endpoints is critical for operational excellence, security, cost effectiveness, and delivering a high-value user experience. It helps businesses to proactively manage and handle issues, ensuring that their digital offerings stay competitive and reliable.

Let’s start Monitoring API Endpoints now

Ping vs Http monitoring – Which one to choose?

Understanding and diagnosing network issues is critical for any organization that uses the internet to interact with customers. Ping and HTTP monitoring are important resources for network managers and webmasters who want to keep their networks running smoothly and fix problems. Each tool has a distinct purpose, providing insight into various layers of network and application operation.

Ping Monitoring:

  • What it does: Ping monitoring uses the ICMP (Internet Control Message Protocol) to check the availability of a network device (such as servers, routers, or switches) on the network. It sends a packet of data to a specific IP address and waits for a reply, measuring the time taken for the round-trip.
  • Purpose: Its primary purpose is to check the reachability of the host and the round-trip time (RTT) for messages sent from the originating host to a destination computer.
  • Use Cases: It is widely used for basic network troubleshooting to check if a host is up and running on the network. It helps in identifying network connectivity issues and the presence of firewalls or network congestion.
  • Limitations: Ping monitoring does not provide information about the performance of higher-level protocols (like HTTP) or application-specific issues. It merely tells you if the host is reachable, not if a web service or application is functioning correctly.

HTTP Monitoring:

  • What it does: HTTP monitoring involves sending HTTP requests (such as GET or POST) to a web server and evaluating the responses. It checks the status and performance of websites or web services by simulating user access.
  • Purpose: The primary purpose is to ensure that a web server is available and responsive from the user’s perspective. It can check for specific content in the response, measure response times, and verify that a web application is functioning as expected.
  • Use Cases: It is used to monitor the health and performance of websites and web services. HTTP monitoring can alert administrators to issues with web pages, application errors, or server misconfigurations that affect the user experience.
  • Limitations: HTTP monitoring is more resource-intensive than ping monitoring and is specific to web services. It might not detect lower-level network issues that ping could identify, such as problems with network hardware or connectivity issues not related to the HTTP protocol.

To be honest, ping monitoring is a simpler, faster way to evaluate a device’s basic network connectivity and reachability, but HTTP monitoring gives a more in-depth, application-level view of web service availability and performance. Both are complimentary and are frequently used in conjunction to provide comprehensive network and application monitoring techniques. However, the subject of which Monitoring metric is best for you is something we will try to address in this article.

Monitor PING or HTTP?

Choosing between ping and HTTP monitoring depends on what you aim to monitor and the depth of insight you need into your network or web services. Here’s a guideline on which one to use and when:

Use Ping Monitoring When:

  • Basic Network Health Checks: You need a quick, straightforward method to check if devices on your network (servers, routers, etc.) are reachable.
  • Initial Troubleshooting: You’re diagnosing network connectivity issues, such as whether packets are being lost or if a particular host is down.
  • Network Performance: You want to measure network latency and packet loss between two points in the network.
  • Simple, Low-Resource Monitoring: You require a low-overhead method to continuously monitor the up/down status of a large number of devices across different locations.

Ping monitoring is ideal for getting a high-level view of network health and is often used as the first step in troubleshooting network issues.

Use HTTP Monitoring When:

  • Web Service Availability: You need to ensure that web servers are not just reachable but also serving content correctly to users.
  • Application Health Checks: You’re monitoring the performance and functionality of web applications, including error codes, response times, and content accuracy.
  • End-User Experience: You want to simulate and measure the experience of a user interacting with a website or web service, ensuring that web pages load correctly and within acceptable time frames.
  • Detailed, Application-Level Insight: You require detailed insights into HTTP/HTTPS protocol-level performance and behavior, including status codes, headers, and content.

HTTP monitoring is more suitable for web administrators and developers who need to ensure the quality of service (QoS) of web applications and services from an end-user perspective.

Combining Both for Comprehensive Monitoring:

In many scenarios, it’s beneficial to use both ping and HTTP monitoring together to get a full picture of both network infrastructure health and application performance. This combined approach allows network administrators and webmasters to quickly identify whether an issue is at the network layer or the application layer, facilitating faster troubleshooting and resolution.

  • Initial Network Check: Use ping monitoring to verify that the network path to the server is clear and that the server is responding to basic requests.
  • Application Layer Verification: Follow up with HTTP monitoring to ensure that the web services and applications hosted on the server are functioning correctly and efficiently.

By employing both methods, you can ensure a comprehensive monitoring strategy that covers both the infrastructure and application layers, helping to maintain high availability and performance.

What are limitations?

Ping Monitoring Limitations

Ping monitoring, while useful for basic network diagnostics and availability checks, has several limitations:

  1. Does Not Indicate Service Availability: Ping monitoring only tests the reachability of a host on the network. A server can respond to ping requests while the actual services (like a web server or database) on that host are down or malfunctioning.
  2. ICMP Blocking: Some networks or firewalls block ICMP traffic (which ping uses) for security reasons. In such cases, a host might appear unreachable via ping, even though it’s functioning correctly and accessible through other protocols like HTTP or SSH.
  3. Limited Diagnostic Information: Ping provides minimal information — essentially, whether a host is reachable and the round-trip time of packets. It doesn’t give any insights into why a service might be down or the quality of service beyond basic latency.
  4. No Application-Level Insights: Ping cannot monitor the performance or availability of application-level processes. It won’t help in understanding issues related to web page load times, database query performance, or the health of any application beyond network reachability.
  5. Potential for Misinterpretation: Network administrators might misinterpret the success of ping tests, assuming that because a server is responding to ping, all services on that server are operational, which might not be the case.
  6. Network Prioritization Issues: ICMP packets used in ping might be treated with lower priority compared to actual application traffic. During times of network congestion, ping packets might be dropped or delayed, suggesting a problem when the application traffic is flowing normally.
  7. False Positives/Negatives: Due to ICMP blocking or prioritization, ping monitoring might lead to false positives (indicating a problem when there isn’t one) or false negatives (indicating no problem when there actually is one), especially in environments with strict firewall rules or Quality of Service (QoS) policies.

Despite these limitations, ping monitoring is still a valuable tool in a network administrator’s toolkit for quick checks and initial diagnostics. It is most effective when used in conjunction with other monitoring tools that can provide deeper insights into network and application performance.

HTTP Monitoring Limitations

HTTP monitoring, while powerful for measuring the availability and performance of online services, has also a number of limitations:

  1. Higher Overhead: Unlike simple ICMP ping requests, HTTP requests require more resources to send and process, both on the monitoring system and the target server. This could impact performance, especially if monitoring is frequent or targets multiple web services.
  2. Limited to HTTP/HTTPS Protocols: HTTP monitoring is specific to web services and applications that use the HTTP or HTTPS protocols. It cannot directly monitor the status of non-web services or lower-level network issues that might affect overall system performance.
  3. Does Not Detect Network-Level Issues: While HTTP monitoring can indicate when a web service is down or performing poorly, it may not identify the underlying network-level issues, such as routing problems or network congestion, that could be causing the problem.
  4. Complex Configuration: Setting up detailed HTTP monitoring (for example, to check the content of a response or to simulate user interactions with a web application) can be complex and time-consuming, requiring in-depth knowledge of the monitored applications.
  5. False Alarms Due to Content Changes: Monitoring for specific content within a web page response can lead to false alarms if the content changes regularly. Administrators need to constantly update the monitoring parameters to avoid this.
  6. Dependency on External Factors: HTTP monitoring’s effectiveness can be influenced by external factors such as DNS resolution issues, third-party content delivery networks (CDNs), and external web services. These factors might affect the performance metrics, making it harder to pinpoint issues.
  7. Security and Access Control Issues: Web applications with authentication, cookies, or session management might require additional configuration to monitor effectively. This could introduce security concerns or complicate setup, especially for secure or sensitive applications.
  8. Limited Insight into Application Logic: While HTTP monitoring can confirm that a web page is loading or that an application endpoint is responsive, it may not provide insight into deeper application logic issues or database performance unless specifically configured to test those functionalities.

To mitigate these limitations, it’s often best to use HTTP monitoring as part of a broader monitoring strategy that includes other tools and methods. This approach allows for a more comprehensive understanding of both application performance and underlying infrastructure health.

Monitoring from Multiple locations?

Monitoring multiple geographical locations may considerably improve server performance analysis and optimization efforts, especially for companies serving a worldwide audience. With Xitoring’s global nodes you are able to get your services monitored from more than 15 locations around the world, which is helping you to increase performance of your server and applications.

  1. Identifying Geographic Performance Variances – Monitoring from multiple locations allows you to find differences in how users view your service throughout the world. For example, a server may react rapidly to queries from one location but slowly to others owing to network latency, routing pathways, or regional internet service provider (ISP) difficulties. Identifying these variations enables focused optimization.
  2. Load Balancer Effectiveness – Multi-location monitoring allows for reviewing the performance of load balancing strategies used across several servers or data centers. It helps to guarantee that traffic is dispersed equally and that all users, regardless of location, receive efficient service.
  3. Network Path and Latency Issues – Monitoring from various locations allows you to trace the network paths data takes to reach different users and identify potential bottlenecks or latency issues within those paths. With this information, you can work with ISPs, choose better hosting locations, or implement network optimizations to improve data delivery routes.
  4. Disaster Recovery and Failover Testing – Multi-location monitoring can be crucial for testing the effectiveness of disaster recovery and failover systems. By simulating access from different regions, you can ensure that these systems activate correctly in response to an outage and that users are rerouted to backup systems without significant performance degradation.
  5. Optimizing for Mobile Users – Considering the variability of mobile networks across regions, monitoring from multiplie locations can help optimize performance for mobile users. This includes adjusting for slower mobile networks or optimizing content delivery for the specific characteristics of mobile connectivity in different areas.

Did you know you can start monitoring your websites from multiple locations around the world for free?

What is HTTP Monitoring?

HTTP (Hypertext Transfer Protocol) and HTTPS (Hypertext Transfer Protocol Secure) are protocols used to send and receive data over the Internet. They are essential for online communication and play a critical role in data flow between a user’s browser and a website.

In other words, it’s like entering https://xitoring.com into your browser.

HTTP

  • Stands For: Hypertext Transfer Protocol
  • Usage: It is used for transmitting and receiving information on the web.
  • Security: HTTP does not encrypt the data being transferred, which means it’s possible for unauthorized parties to intercept the data. This makes it less secure, especially for sensitive information.
  • Port: By default, it uses TCP (Transmission Control Protocol) port 80 for communication.

(more…)

What is SMTP Server Monitoring?

SMTP monitoring is like keeping an eye on the post office of the internet that sends your emails. Imagine you have a post office (SMTP server) that needs to make sure all the letters (emails) get sent out properly and on time. By monitoring SMTP services, organizations can detect and address problems early, before they impact users or lead to significant downtime. This can include issues like server overloads, failed delivery attempts, authentication errors, or network problems. SMTP monitoring tools may provide real-time alerts, detailed logs, and reports to help IT teams troubleshoot and resolve issues promptly. (more…)

Top Website Monitoring Tools in 2024

A website is the foundation of every online and local business. It serves as the central point for users to interact with your brand, goods, and services. Thus, maintaining your website’s performance, availability, and security is critical.

But how can you maintain a close check on all of these things without being overwhelmed?

The answer is in using proper website monitoring tools. In 2024, the landscape of such tools is extensive and diverse, meeting a wide range of requirements and budgets. This thorough guide attempts to highlight your route to picking the ideal tool, whether you’re a tiny startup or a large organization.

What is Website Monitoring?

So, first let us look into what Website Monitoring is. Website Monitoring is the process of testing and verifying that end users may interact with a website or online service as intended. It requires checking and monitoring the website’s performance, availability, functionality, and security to guarantee optimal functioning and user satisfaction. This ongoing monitoring helps identify issues such as outages, slow page load times, broken links, and security breaches before they have a major effect on users or the business.

Website monitoring is being broken down into two categories. Synthetic Monitoring and Real User Monitoring (RUM) are two important methods for online performance and availability monitoring. Both provide distinct insights and value, but in different ways. Understanding these distinctions is critical to choose the best monitoring method for your needs.

Synthetic Monitoring

Synthetic monitoring, also known as proactive or artificial monitoring, is the process of mimicking user interactions with a website or application using automated scripts. This approach enables you to test web performance and availability in a controlled environment, without requiring actual user traffic. It’s similar to sending a robot to a business to make sure it’s open and running properly before customers come. In our earlier article we have covered all questions about Synthetic Monitoring. Here we will take a fast look into it again.

Key Features:

  • Predefined Actions: Tests are based on scripted interactions predefined by the user, such as logging in, navigating through pages, or completing a transaction.
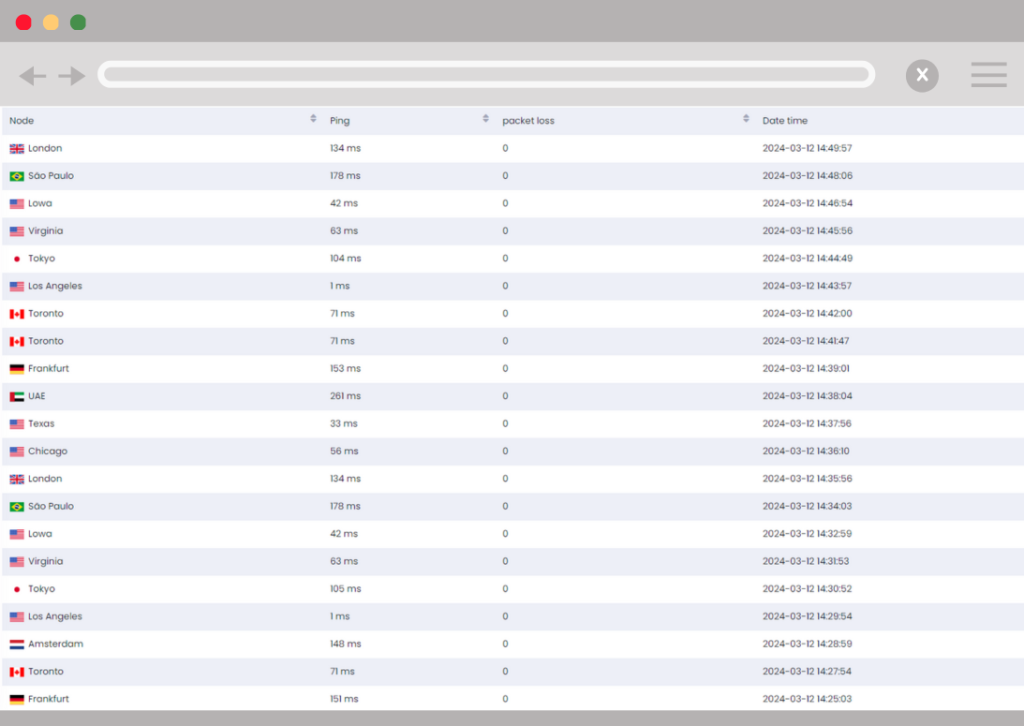
  • Global Perspective: You can run these tests from multiple geographic locations to measure how performance varies across different regions.
  • 24/7 Monitoring: Because it doesn’t rely on real user traffic, synthetic monitoring can operate around the clock, identifying issues during off-peak hours.
  • Consistency: Tests are repeatable and consistent, providing a baseline for performance benchmarks and comparisons over time.

Benefits:

  • Early Problem Detection: Synthetic monitoring can identify issues before they impact real users, allowing for proactive troubleshooting.
  • Performance Benchmarking: It offers a consistent baseline for tracking performance improvements or degradations over time.
  • Global Availability Checks: You can ensure that your website or application is accessible and performs well from different locations worldwide.

Real User Monitoring (RUM)

Real User Monitoring records and analyzes real-time interactions between users and a website or application. It captures information on how real people interact with the website, such as page load times, transaction pathways, and user behavior patterns. Consider having observers in the store to monitor how customers navigate and experience the purchasing process.

Key Features:

  • Real Traffic: RUM relies on actual user interactions, providing insights into real-world performance and user experience.
  • Diverse Data: It captures a wide range of metrics, including device type, browser, network conditions, and geographical location of users.
  • User Behavior Insights: RUM can offer insights into how user behavior impacts performance, such as which pages are most visited or where users face issues.

Benefits:

  • User-Centric Insights: RUM provides a direct look into how real users experience your site, which is crucial for optimizing user satisfaction and engagement.
  • Issue Identification: It helps identify specific problems encountered by real users, which might not be covered by synthetic monitoring scripts.
  • Performance Optimization: By understanding real user experiences, you can prioritize optimizations that will have the most significant impact on your audience.

Comparing Synthetic Monitoring and RUM

While both monitoring techniques are valuable, they serve different purposes:

  • Synthetic Monitoring is best suited for baseline performance testing, availability checks, and identifying issues before they affect users. It’s a controlled approach that allows for consistent testing across various conditions.
  • Real User Monitoring shines in providing insights into actual user experiences, uncovering real-world issues, and optimizing for real user conditions. It’s dynamic and directly reflects the diversity of an actual user base.

Why Website Monitoring is Non-negotiable

Imagine your website as an active store. What if the doors randomly closed during the day, or the inside was so disorganized that consumers were unable to navigate it? This is what happens when your website is down, slow, or hacked. Website monitoring tools serve as your digital stewards, keeping the doors open, the lights on, and the shelves organized. However, these tools do more than just avoid problems; they also provide insights into user experience, allowing for adjustments that may greatly improve your site’s speed and, by implication, your business’s profitability.

  • Minimizes Downtime –Downtime may be extremely costly, not just in terms of missed sales or money, but also in terms of consumer trust and brand reputation. Monitoring notifies you to downtime issues as they occur, allowing you to resolve them quickly and with minimal effect on your users and company.
  • Improves Website Performance –Speed and efficiency are critical for keeping consumers interested. Slow-loading pages can annoy and drive visitors away. Regular monitoring provides performance bottlenecks, allowing you to minimize load times and keep your site running quickly and efficiently.
  • Ensures Functionality of Website Features –Shopping carts, forms, and third-party services are all common features and integrations used on websites. Monitoring ensures that all of these components perform as expected, allowing people to engage with your site without experiencing broken features or issues.
  • Detects Security Threats –With cybersecurity risks on the rise, monitoring your website for unexpected behavior can serve as a first line of protection against assaults. Prompt detection enables you to correct vulnerabilities and preserve sensitive data, preserving your consumers’ confidence while adhering to data protection rules. SSL Health Checks are one of the most important tests performed here.

Top 8 Website Monitoring Tools of 2024 (Free and Paid)

Let’s look at the best website monitoring solutions available, including both free and paid choices that match all budgets and needs.

1. Xitoring (Paid + FREE)

Perfect for startups, small, and medium businesses, Xitoring provides essential monitoring features without breaking the bank. Its uptime checks and alerting features ensure you’re always in the loop about your website’s status. Besides of Uptime Monitoring, it also provides Linux & Windows server monitoring

Features:

  • Real-time performance monitoring
  • 20 monitors with 1-minute checks in the free plan
  • Advanced SSL monitoring included with SSL health checks
  • API Monitoring, which allows you to keep an eye on your api with third-party integrations
  • Over 15 probing nodes for the monitoring your website
  • Alerting via email, SMS, WhatsApp, and various notification channels
  • Maintenance windows to pause monitoring during planned downtime
  • Customizeable Public Status Page
  • Customizable dashboards and reporting

Benefits: Xitoring’s simple setup and operation make it a popular choice among startups, small and medium enterprises. The tool’s free tier provides critical monitoring functions, making it accessible to businesses with low resources. Its integrated Linux and Windows monitoring agents enable all monitoring requirements to be met in one location. You can monitor server software such as Apache, Nginx, MySQL, Docker, and many others, all of which are required for websites to function.

2. Pingdom ( Paid )

Pingdom, a website monitoring tool, provides a package of strong capabilities like as real-time monitoring, performance analysis, and uptime tracking. It’s the go-to solution for organizations that need precise data to improve customer experiences across the board.

Features:

  • Real-time performance monitoring
  • Uptime and response time tracking
  • Page speed analysis tools
  • Transaction monitoring for e-commerce and sign-up processes
  • Alerting via email, SMS, and integrations with apps like Slack

Benefits: Pingdom offers intuitive dashboards that make it easy to understand complex data at a glance. Its robust reporting capabilities allow for historical performance analysis, helping to identify trends and potential issues.

3. Site24x7 ( Paid )

Site24x7 is a solution designed for  enterprises with complicated demands, providing complete monitoring for websites, servers, and cloud services, as well as AI-powered analytics.

Features:

  • Website, server, and network monitoring from over 60 locations worldwide
  • Application performance monitoring (APM)
  • Cloud services monitoring
  • Real user monitoring (RUM)
  • Log management and AI-powered analytics

Benefits: Site24x7 provides a comprehensive suite of monitoring tools, making it an all-in-one solution for larger organizations. Its global monitoring capabilities ensure that you can track your site’s performance from your users’ locations.

4. Datadog ( Paid )

Datadog offers comprehensive analytics, real-time performance tracking, and broad integration possibilities, making it suitable for precise analysis and customization.

Features:

  • Real-time performance metrics
  • Advanced analytics and dashboarding
  • Integration with over 400 services
  • Log management and APM
  • Synthetic monitoring to test website and API endpoints

Benefits: Datadog excels in customization and depth of analysis, offering granular insights into website and application performance. Its integrations make it a powerful tool for teams using a variety of cloud services and technologies.

5. New Relic ( Paid )

New Relic, which focuses on application performance, is the ideal alternative for enterprises looking to optimize their online applications with real-user data and application performance monitoring.

Features:

  • Application performance monitoring
  • Real user monitoring
  • Synthetic transactions to simulate user interactions
  • Serverless function monitoring
  • Infrastructure monitoring

Benefits: New Relic focuses on application performance, providing detailed insights that help developers optimize their code and infrastructure. Its scalability makes it suitable for businesses of all sizes.

8. Uptrends ( Paid )

Uptrends’ worldwide monitoring network sets it apart, making it the ideal solution for businesses that want thorough performance data from around the world.

Features:

  • Uptime, transaction, and server monitoring
  • Real user monitoring (RUM)
  • Global checkpoint network
  • Customizable dashboards and reporting
  • API monitoring

Benefits: Uptrends provides detailed insights into website performance from a global perspective, making it easy to pinpoint issues affecting users in specific regions.

Choosing the Right Tool for Your Needs

Choosing the best website monitoring solution requires an in-depth understanding of your targets and limits. Consider the budget, desired features (e.g., real-time alerts, performance benchmarks, worldwide monitoring), ease of use, integration possibilities, and support level. Balance these factors against the expense to ensure you get value for your investment. Remember that the goal is to increase your website’s performance and dependability, which directly contributes to a better user experience and commercial success.