Unified Server Monitoring, for Linux and Windows
Monitor your Linux and Windows servers effortlessly. From CPU and memory to disk and network performance, stay informed, prevent downtime, and optimize operation
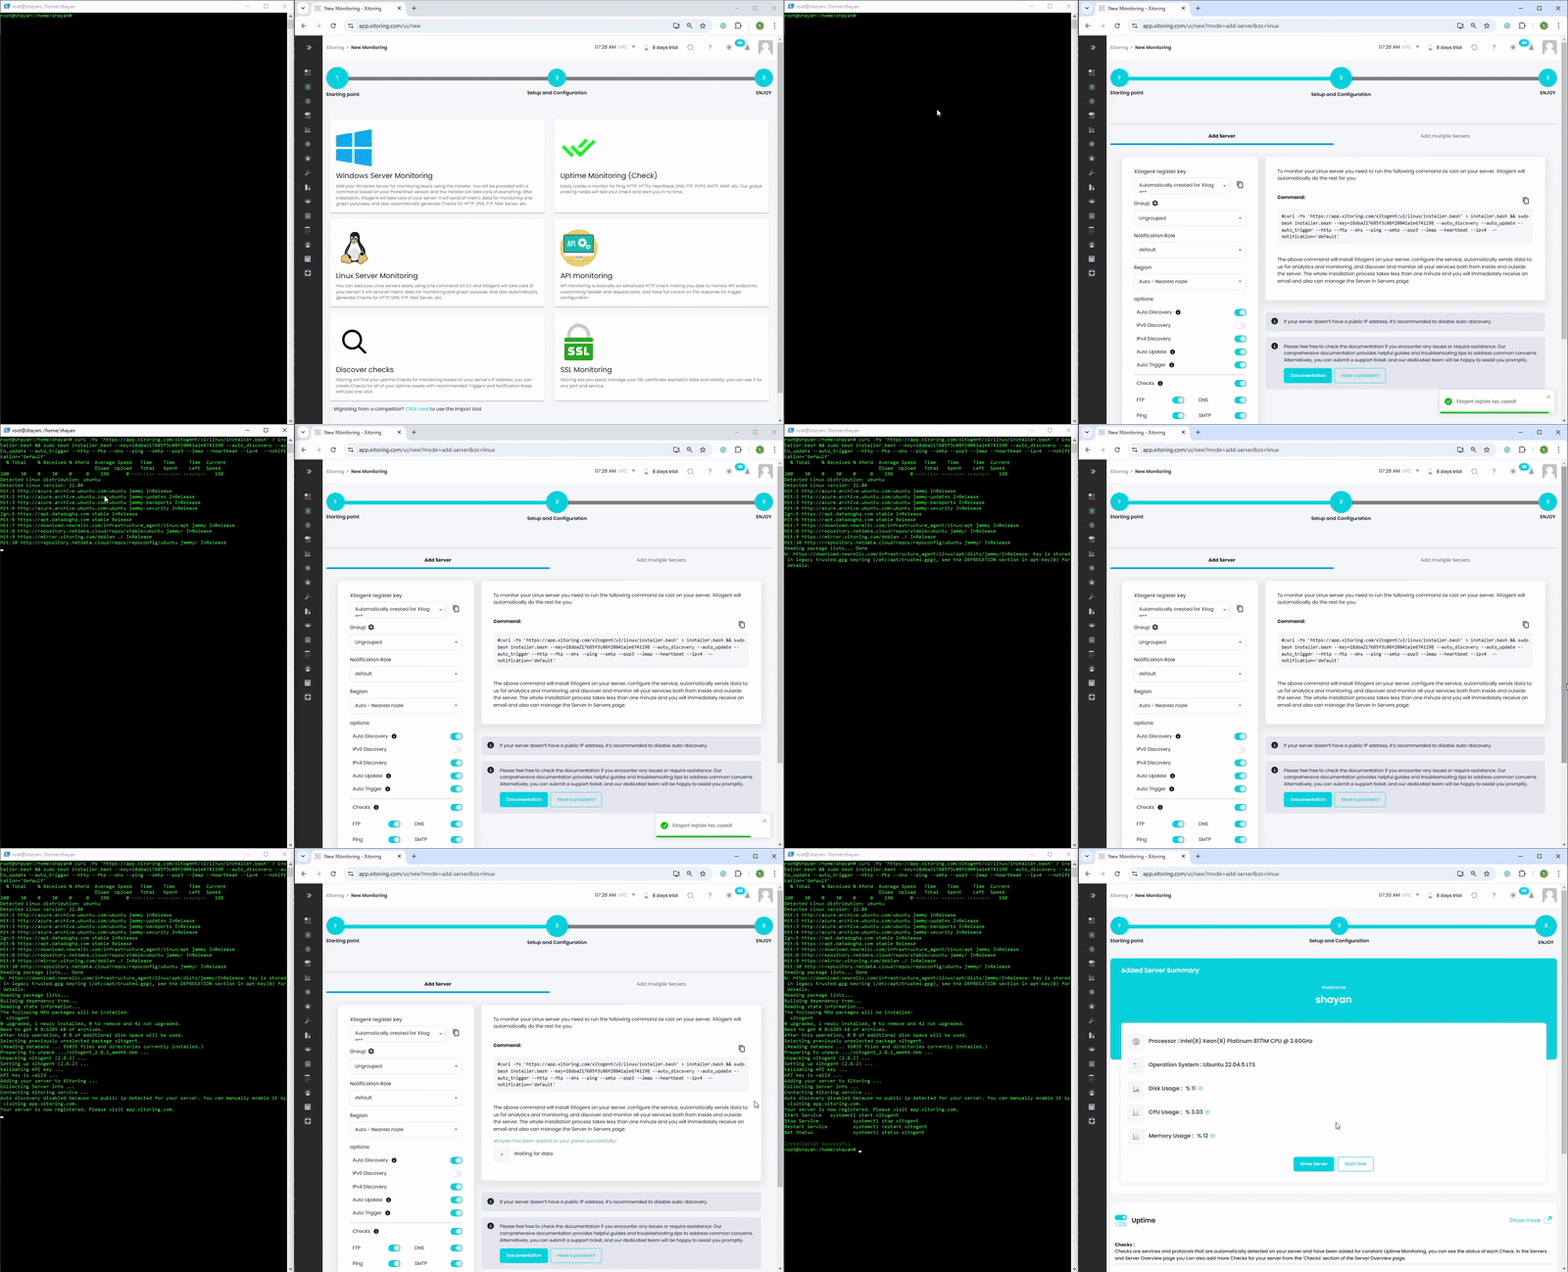
Effortless Server Setup in Seconds
Xitoring makes it easy to start monitoring your Linux and Windows servers in minutes. Copy, paste, and let the magic happen
- Copy the Command
Get your unique installation command instantly - Paste & Run
One command to install and connect your server seamlessly - Start Monitoring
Track server performance in real-time without hassle

Alerts That Matter
Notify the Right Person, the Right Way
Ensure faster resolutions with real-time alerts via Email, SMS, or any of the 25 other notification channels tailored to your team’s needs
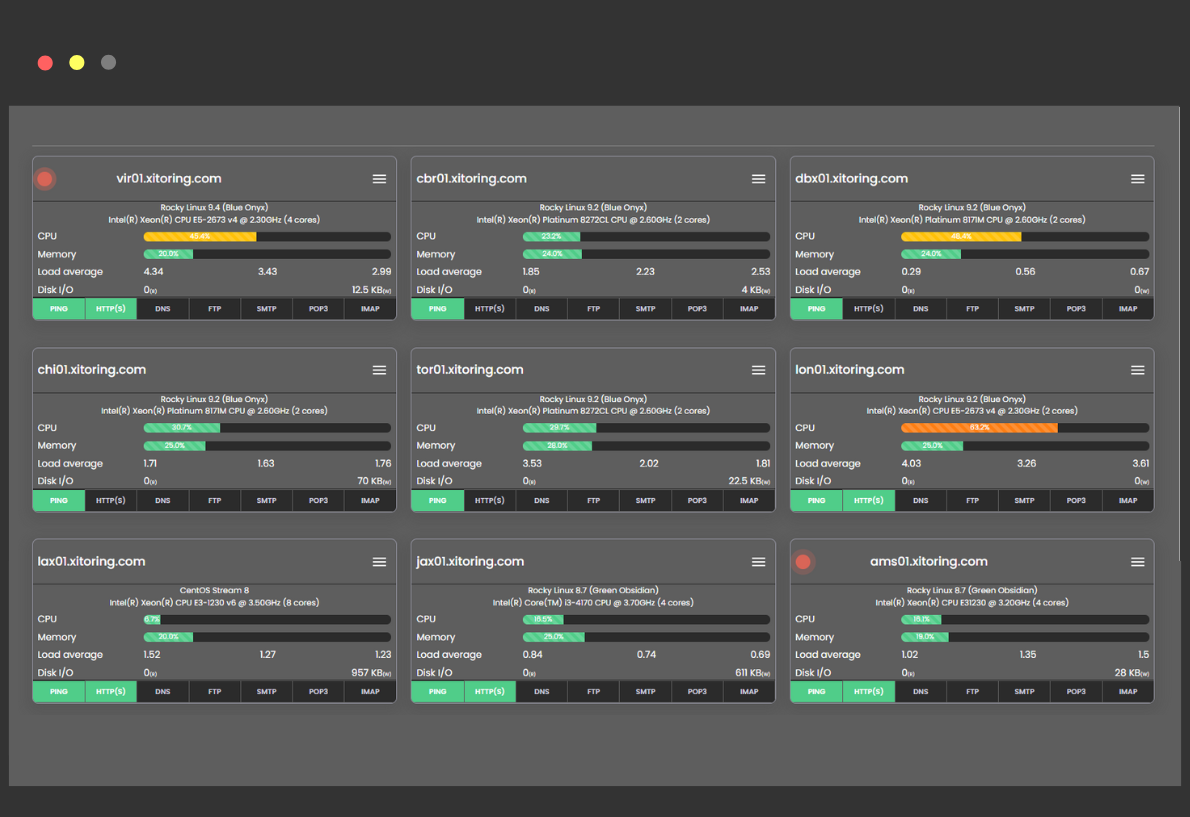
Server Overview: All Your Servers at a Glance
Managing multiple servers?
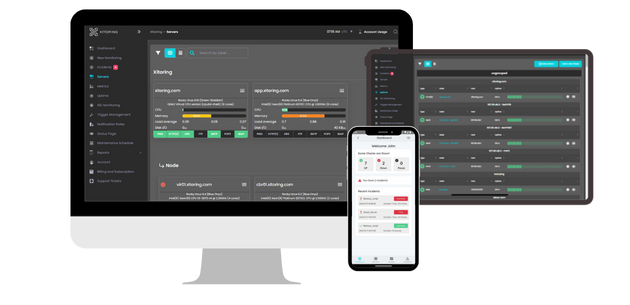
No problem. Our platform gives you an instant overview of all your Linux and Windows servers in one place.
- Choose between list view for detailed insights or widget view for a quick snapshot.
- Easily group servers by location, function, or business unit to streamline management.
- Detect anomalies in real-time, with live statistics for CPU, memory, and incident tracking.
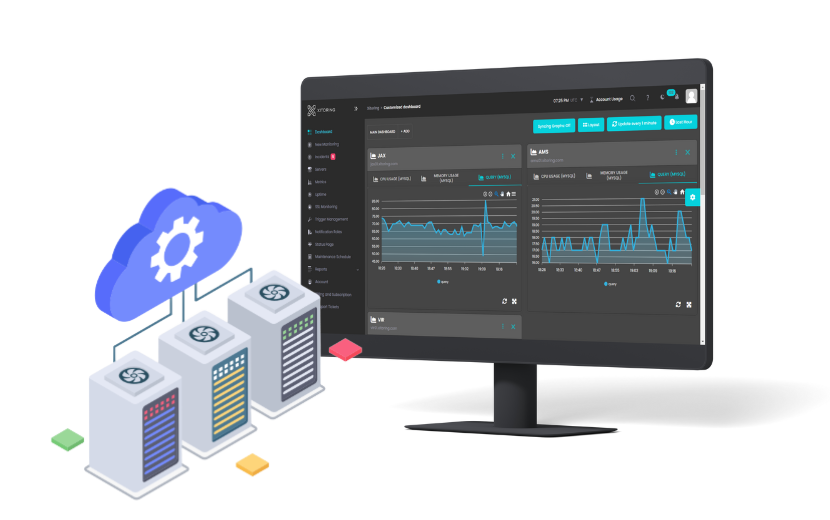
Integration Made Simple and Fast

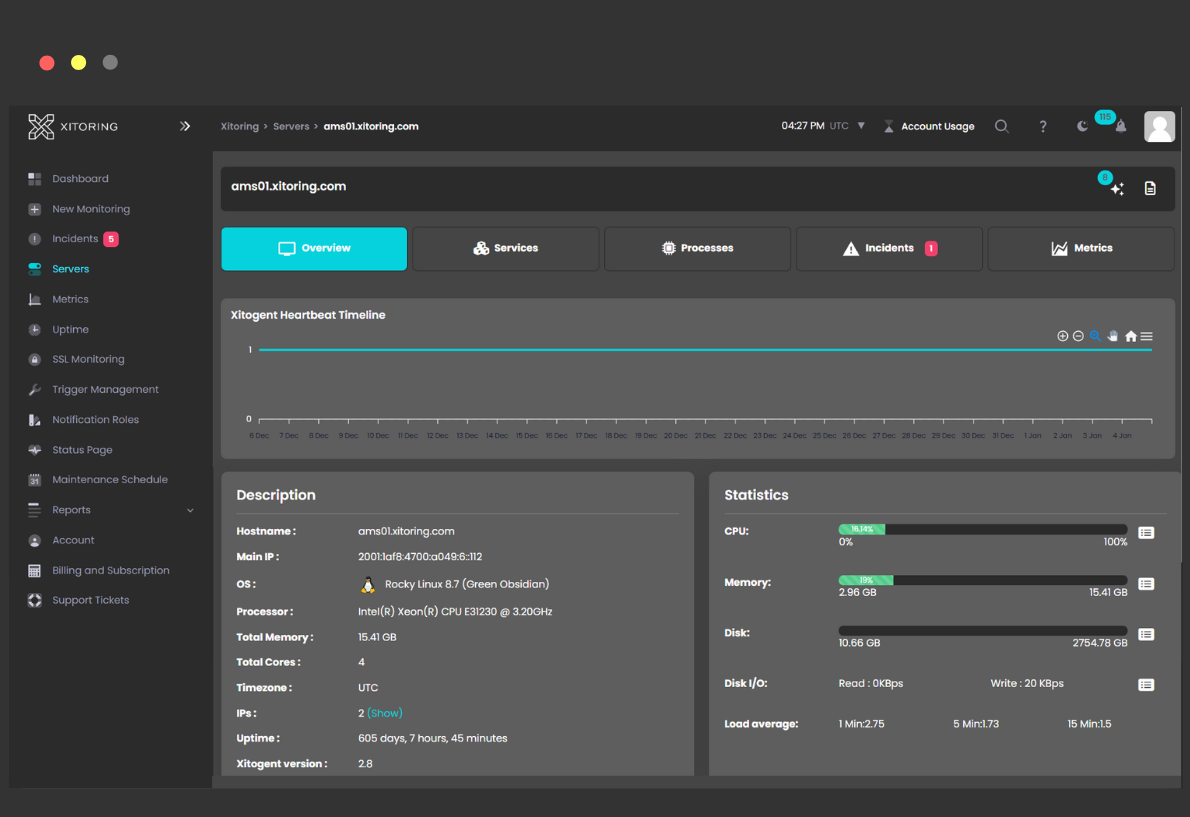
Server Information: Essential Insights at Your Fingertips
Understanding the details of your server’s configuration is key to maintaining performance.
- View critical hardware and software specifications to identify bottlenecks and optimize setups.
- Access detailed operating system information for both Linux and Windows environments.
- Diagnose and troubleshoot issues faster with instant access to logs and incident history.
Advanced Server Monitoring Features
Everything You Need for Proactive Monitoring
Quick agent installation, integrations, auto-updates,
mobile app, and customizable triggers—all in one platform.
Linux and Windows Server Graphs: Live and Historical Metrics
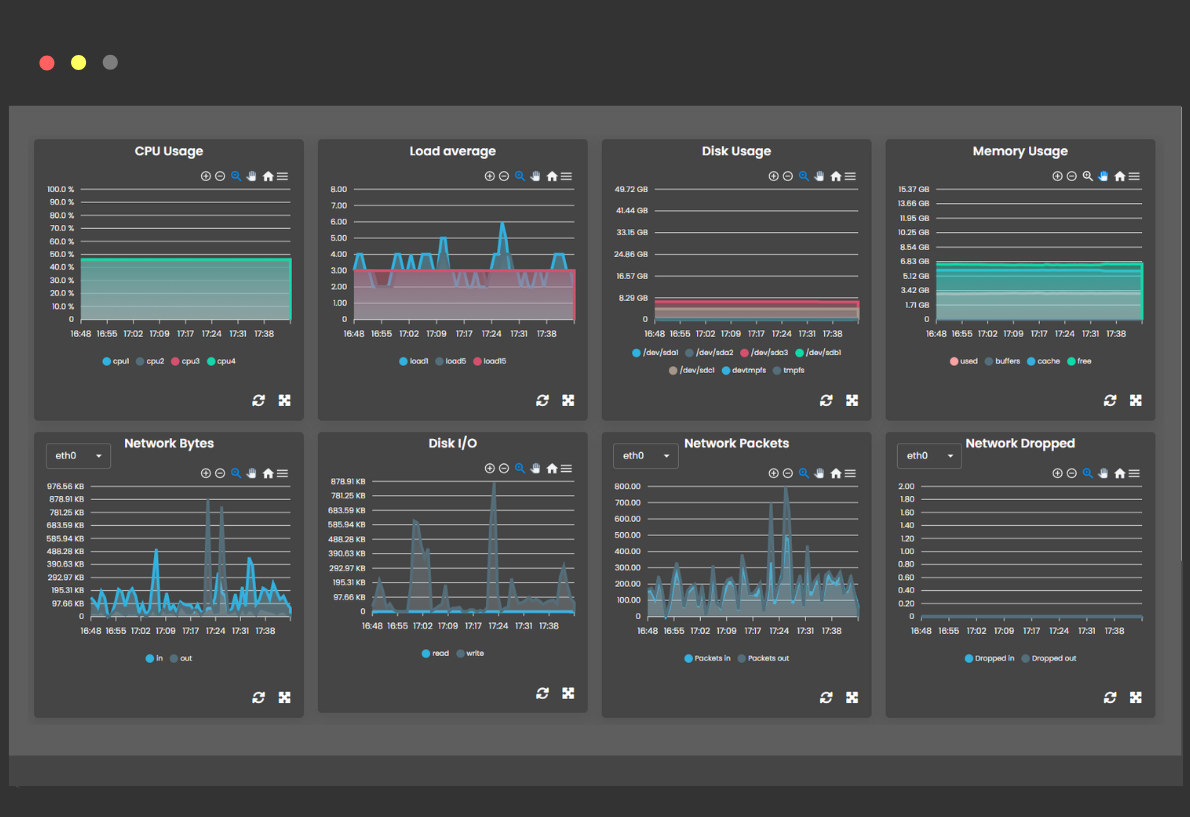
Visualize your server performance with intuitive graphs designed for both Linux and Windows servers.
- Load Average: Analyze resource utilization trends to prevent overloads on Linux systems.
- CPU Usage: Track consumption across all units and cores, configure alerts, and optimize workloads.
- Memory Usage: Monitor real-time and historical memory stats to ensure smooth application performance.
- Disk IO and Usage: Stay ahead of potential storage issues with detailed insights into disk activity and capacity.
- Network Performance: Gain clarity on network activity with per-adaptor graphs and custom triggers.
Ready to Take Control of Your Monitoring?
Xitoring simplifies server, website, and network monitoring with real-time insights, proactive alerts, and user-friendly tools. Start optimizing your infrastructure today and ensure reliability with our all-in-one monitoring solution.
Trusted by engineers worldwide
