What is MySQL Monitoring?
MySQL is an open source relational database management system (RDBMS). It is based on a client-server architecture and is one of the most popular SQL (Structured Query Language) database management systems available today. MySQL is used to manage and organize data in tables, and it supports a variety of data types, including caching solutions like Redis It is commonly used in online applications and serves as the database component of the LAMP (Linux, Apache, MySQL, Perl/PHP/Python) web application software stack.
MySQL is known for its reliability, scalability, and flexibility.It can be used for a wide range of applications, from small to large-scale enterprise applications, and supports numerous operating systems including Linux, Windows, and macOS. Over the years, MySQL has become the go-to choice for many developers, particularly for web applications, due to its ease of use, performance, and strong community support; therefore, monitoring MySQL instances for better performance is becoming increasingly frequent.
Relation Databases
Relational databases are a type of database that store and provide access to data points that are related to one another. They are based on the relational model proposed by E.F. Codd in 1970. In a relational database, data is organized into tables (also known as relations) which are made up of rows and columns. Each table represents a specific type of entity (like a person, or a product), and each row in the table represents a specific instance of that type of entity. Each column in the table corresponds to a data field related to the kind of object represented.
- Tables: The core of a relational database is its tables. Each table holds data about a particular type of item or concept.
- Primary Keys: Each table has a unique identifier known as a primary key, which uniquely identifies each row in a table.
- Foreign Keys: Tables can be related to one another through the use of foreign keys. A foreign key in one table points to a primary key in another table, establishing a relationship between the two tables.
- SQL (Structured Query Language): This is a standard programming language used to manage and manipulate relational databases. SQL can be used to insert, search, update, and delete database records.
- Normalization: This is a process used in designing a database to reduce data redundancy and improve data integrity by organizing fields and tables.
- Transactions: Relational databases support transactions, which are sequences of database operations that are executed as a single unit to ensure data integrity.
Relational databases are widely used due to their simplicity, flexibility, and power in storing and manipulating structured data efficiently. They are suited for cases where relationships between different data items matter and integrity of data is crucial. Examples of relational database management systems (RDBMS) include MySQL, PostgreSQL, Oracle Database, and Microsoft SQL Server.
Improving Performance by Monitoring the Metrics
Monitoring a MySQL server is keeping a watch on a number of variables to maintain peak performance, identify bottlenecks, and avoid possible problems.
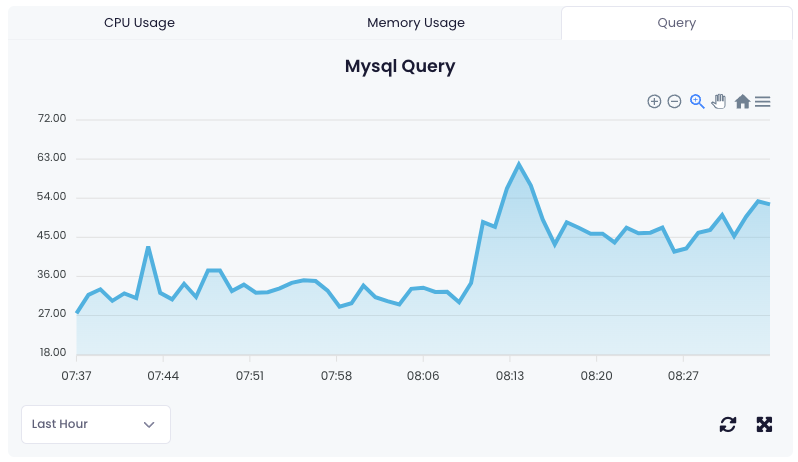
- Query Performance Metrics:
- Slow queries: The number of queries that take longer than a specified time to execute. Reducing slow queries can significantly improve performance.
- Throughput: The number of queries, updates, and other operations performed per second, providing a general measure of workload and activity.
- Query execution times: Monitoring the average and specific query execution times helps in identifying queries that are potential bottlenecks.
- Server Performance Metrics:
- CPU utilization: High CPU usage can indicate that the server is processing a heavy query load or that queries are not optimized.
- Memory usage: Keep an eye on the usage of RAM. MySQL uses memory for caching, which can greatly affect performance.
- Disk I/O: High disk read or write operations can indicate that queries are not efficient or that indexes are not properly used.
- Connection Metrics:
- Threads connected: The number of currently open connections. A sudden increase can indicate a spike in traffic or potential denial of service attacks.
- Aborted connections: The number of failed attempts to connect to the MySQL server. High numbers may indicate configuration errors or attempted unauthorized access.
- InnoDB Metrics (for InnoDB storage engine):
- Buffer pool usage: The InnoDB buffer pool is crucial for performance, as it caches data and indexes. High utilization without free space can lead to performance issues.
- Row operations: The number of rows read, inserted, updated, or deleted can indicate the level of activity and potential hotspots in the database.
- Replication Metrics (if using MySQL replication):
- Slave lag: The time delay between a transaction being committed on the primary server and applied on the replica. Significant lag can indicate issues with replication throughput.
- Replication errors: Any errors in replicating data between servers need immediate attention to ensure data consistency.
- Network Metrics:
- Network throughput: The amount of data being sent to and from the MySQL server. High network traffic could impact performance.
- Connection errors: Errors related to establishing network connections to the MySQL server.
Monitoring these metrics offers information about the health and performance of a MySQL server, as well as other critical components like load balancers. Regular monitoring and analysis enable database administrators to make informed decisions on configuration changes, hardware upgrades, and query optimizations for maintaining optimal performance.
Why is MySQL Monitoring important?
Monitoring MySQL is necessary for many different reasons, all of which contribute to the overall health, performance, and dependability of applications that rely on it.
- Performance Optimization: Monitoring helps identify slow queries, table locks, and other issues that can degrade database performance. By identifying and addressing these issues, you can optimize the performance of your MySQL server, ensuring that applications run smoothly and efficiently.
- Capacity Planning: Regular monitoring of resources such as CPU usage, memory utilization, disk space, and I/O operations allows for effective capacity planning. Understanding trends and growth patterns helps in making informed decisions about scaling and resource allocation to meet future demands.
- Availability and Reliability: By monitoring replication, server status, and other critical metrics, you can ensure high availability and reliability of your MySQL databases. This is crucial for applications that require consistent database access and cannot afford downtime.
- Security: Monitoring access logs and audit trails can help in identifying unauthorized access attempts or suspicious activities. This is critical for preventing data breaches and ensuring that your database environment remains secure.
- Data Integrity: Regular checks and monitoring of backups, replication processes, and error logs help in ensuring data integrity. This means that data remains accurate, consistent, and reliable over its lifecycle, which is crucial for decision-making and operations.
- Compliance: For businesses subject to regulatory requirements, monitoring can help in ensuring compliance with data protection and privacy laws. By tracking access and changes to data, organizations can demonstrate compliance with regulations such as GDPR, HIPAA, etc.
- Troubleshooting: Effective monitoring provides insights into what’s happening within your MySQL servers, making it easier to troubleshoot and resolve issues quickly. This minimizes downtime and prevents minor issues from escalating into major problems.
- Cost Management: By optimizing database performance and resource utilization, monitoring can also help in managing and reducing operational costs. Efficient use of resources prevents over-provisioning and allows for more cost-effective infrastructure management.
How to monitor MySQL Instance?
Monitoring a MySQL database effectively involves using tools and services that can track different performance metrics, log events, and send alerts for anomalies. Here we will discuss several solutions for monitoring your MySQL instances for improved performance.
Using Native MySQL Tools
MySQL offers several native tools and commands for monitoring, such as:
- SHOW STATUS: Provides a wide array of server status information.
- SHOW PROCESSLIST: Displays information about currently running threads, including the state of queries.
- Performance Schema: A feature for monitoring MySQL server execution at a low level.
- Information Schema: Provides access to database metadata, including statistics about table and column usage.
These tools can be useful for ad-hoc checks and troubleshooting.
Open-Source and Third-Party Tools
Several open-source and third-party tools offer comprehensive MySQL monitoring capabilities. Examples include:
- Percona Monitoring and Management (PMM): Offers time-based analysis for MySQL and MongoDB performance.
- Nagios: Provides monitoring and alerting for servers, switches, applications, and services, with support for MySQL.
- Zabbix: A network and application monitoring tool that includes support for MySQL.
- Grafana & Prometheus: A powerful combination for storing (Prometheus) and visualizing (Grafana) MySQL metrics.
Cloud-Based Monitoring Solution
Xitoring is an all-in-one server and application monitoring solution that includes MySQL monitoring among its server integration features. It allows you to monitor key MySQL metrics, including query performance, server load, connection counts, and more. Xitoring simplifies the monitoring process by providing a unified dashboard where you can view all your monitoring data, set up alerts, and receive reports. This can be particularly useful for administrators who need a comprehensive overview of their infrastructure’s health, including databases, servers, and other critical components.
With Xitoring, you can:
- Automatically discover and monitor MySQL instances: No need for manual configuration.
- Receive real-time alerts: Get notified about performance issues, slow queries, and other anomalies.
- Access detailed reports and dashboards: View historical data and trends for better decision-making.
How to Choose
When choosing a monitoring solution for MySQL, consider factors such as:
- The complexity of your database and infrastructure.
- The level of granularity and historical data you need.
- Whether you prefer a self-hosted or cloud-based solution.
- Integration with other tools and services you use.
By carefully evaluating your needs and the features of potential monitoring solutions, you can ensure that you have the visibility and insights needed to maintain optimal performance and reliability for your MySQL databases.
Ready to Take Your MySQL Monitoring to the Next Level?
Choosing the right monitoring solution is a prime factor that contributes to performance, reliability, and security of your MySQL databases. Keep yourself ahead of database health rather than leaving it to chance. Empower yourself with tools that provide real-time insight, actionable alerts, and complete visibility into your infrastructure.
Whether it is an average-sized application or a system considered enterprise-level, Xitoring provides comprehensive coverage and allows MySQL monitoring to become easier and straightforward: from automatic discovery, granular dashboards, and proactive alerting-Xitoring keeps you ahead of potentially serious issues and optimizes performance.
Start monitoring smarter, not harder. Try Xitoring today and experience the peace of mind that only complete control over your MySQL environment can provide.
Or sign up now for free and take a free demo to know more!