
CouchDB Monitoring
Monitor CouchDB request rate, replication scheduler health, document reads/writes, view index build progress, smoosh compaction, and cluster shard balance in real time — via `/_node/_local/_stats` and `/_active_tasks`.
Why monitor CouchDB?
Apache CouchDB powers offline-first PouchDB sync apps, IoT edge replication, and HA document stores. Replication scheduler failures, smoosh compaction backlogs, and shard imbalance show up as sync failures or 'my mail looks empty' reports before they're traceable. Monitoring catches the issue at the replicator job, not at the user.
CouchDB monitoring, explained
CouchDB monitoring catches replication scheduler failures, smoosh compaction backlogs, shard imbalance, view index build stalls, and HTTP error spikes before they cause sync failures in PouchDB clients, document corruption, or query timeouts. For offline-first mobile/web apps, IoT edge sync, and any multi-master CouchDB cluster, per-node visibility plus replication-job health is what separates a clean 60-second alert from a multi-day chase through fabric logs. Xitoring auto-discovers your CouchDB, reads native HTTP endpoints, and routes alerts to Slack, PagerDuty, Telegram, or your existing on-call.
What we monitor
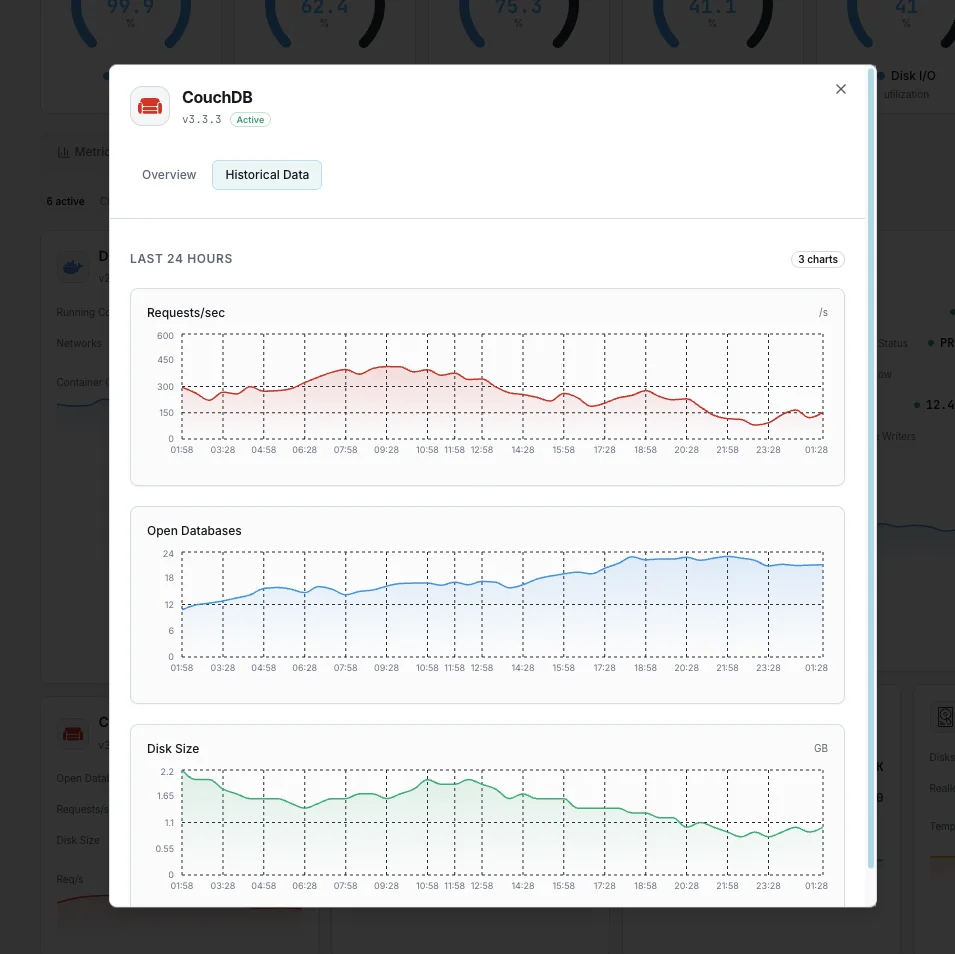
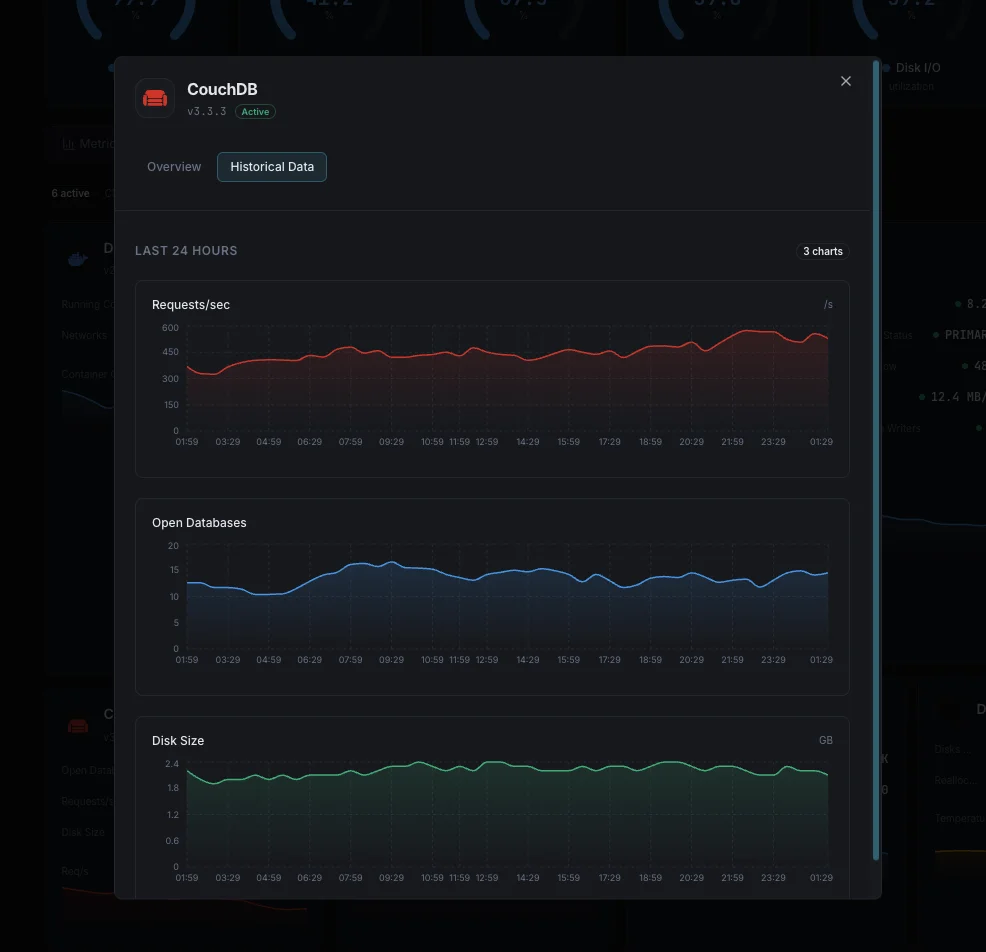
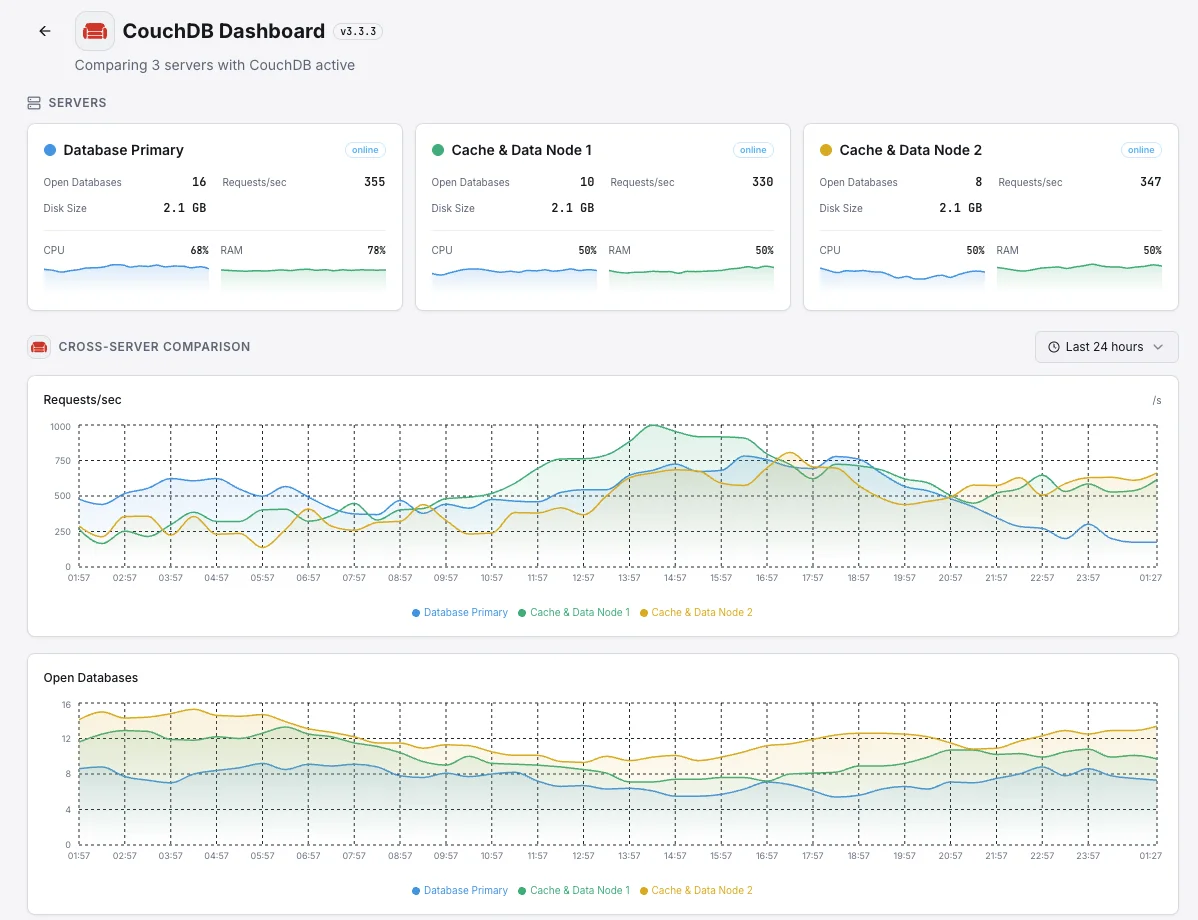
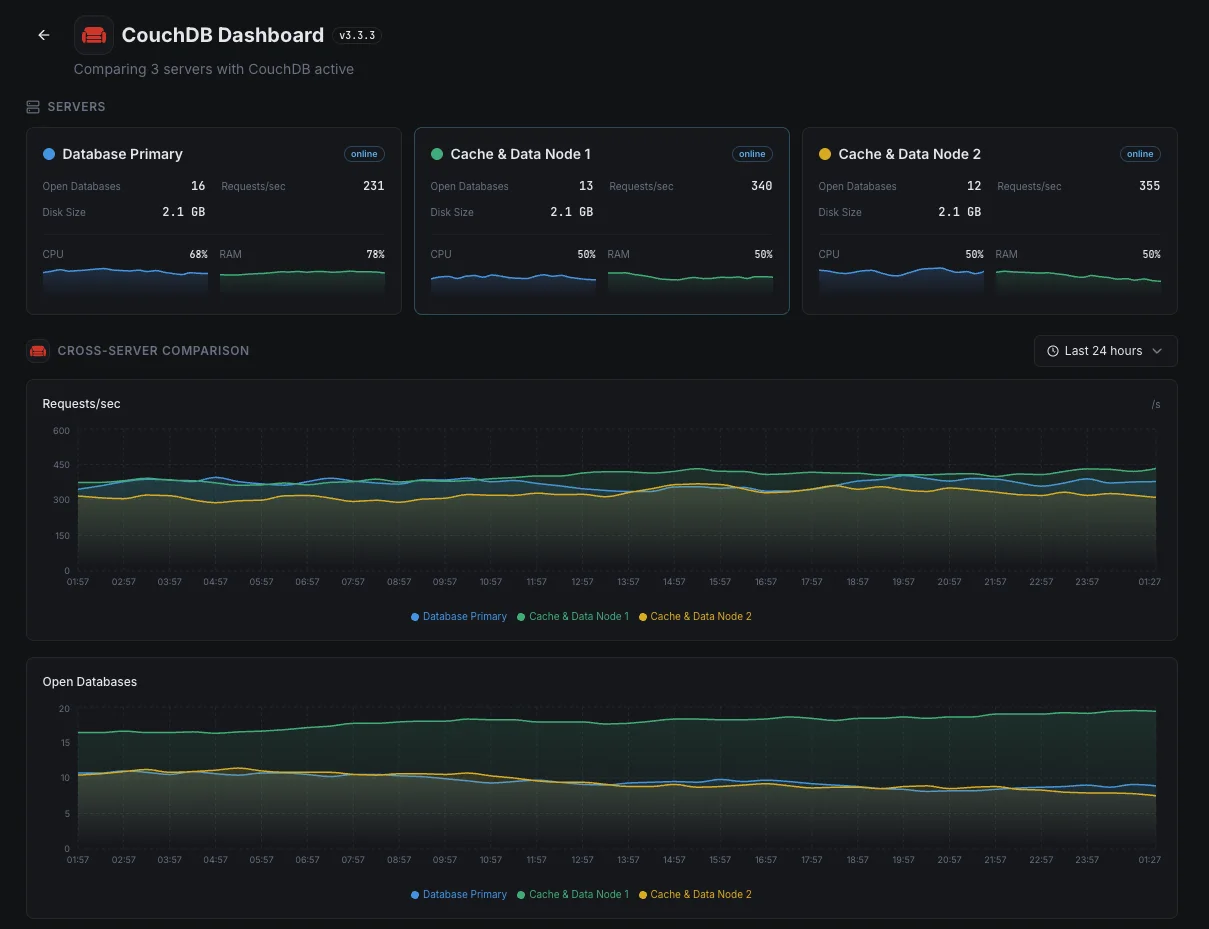
Requests / sec
Live HTTP API request rate from `couchdb.httpd.requests`. Spikes flag PouchDB sync storms or app-side query patterns; sustained zero rate flags broken clients.
HTTP Status Codes
Distribution of `couchdb.httpd_status_codes.{200,201,202,4xx,5xx}`. 409 spikes flag document-update conflicts; 5xx spikes flag server-side failures.
Document Reads / Writes
`couchdb.database_reads`/`database_writes` plus `couchdb.document_inserts`/`writes`. Track per-database to surface noisy clients or background sync workloads.
Replicator Jobs (running / pending / crashed)
`couch_replicator.jobs.running`, `.pending`, `.crashed`. Any non-zero `crashed` is an immediate alert — replication is stalled. Pending growing without running movement = scheduler bottleneck.
Replicator Checkpoint Failures
`couch_replicator.checkpoints.failure`. Failed checkpoints mean replication can't durably resume; sustained failures usually point at write-permission or disk-space issues on the source/target.
Cluster Stability
`couch_replicator.cluster_is_stable` (boolean). Goes false during membership changes or node restarts — extended false state = split-brain risk.
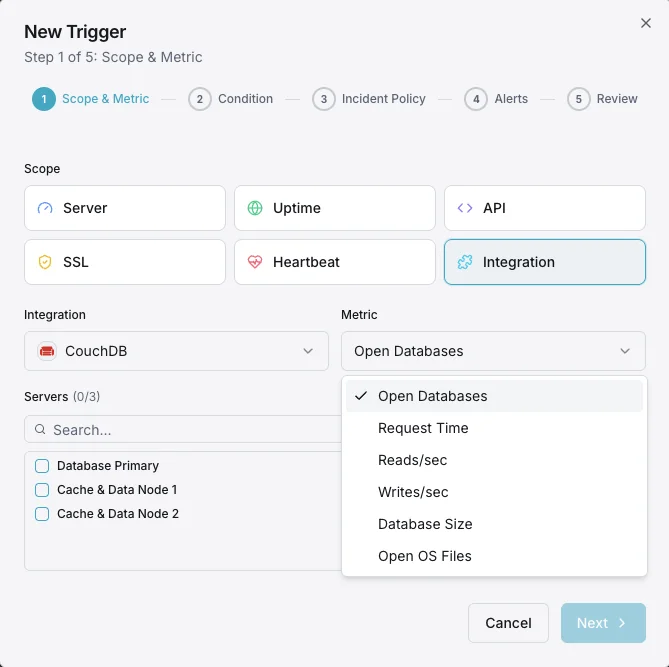
Open Databases / Open OS Files
`couchdb.open_databases` and `couchdb.open_os_files`. Approaching the OS `ulimit -n` ceiling causes hard failures — raise both `ulimit` and CouchDB's `[couchdb] max_dbs_open` together.
View Index Build Progress
From `/_active_tasks` (type=indexer): `changes_done`/`total_changes` per design document. Slow or stalled builds block queries that depend on those views.
Compaction Progress
From `/_active_tasks` (type=database_compaction / view_compaction): progress percentage. Smoosh handles auto-compaction in 3.x — alert when a compaction task runs longer than expected for the database size.
Fabric Read Repairs
`fabric.read_repairs.success`/`failure`. Reflects shard inconsistency being fixed on the fly during reads. Sustained read repairs flag a node out of sync or a bad shard.
Shard Cache Hit Rate
`mem3.shard_cache.hit` / (`hit` + `miss`). The cluster's internal cache for shard routing — low hit rate means churn (membership changes) or memory pressure.
Database Size on Disk
Per-database file size, tracked over time. Steady growth between compactions is normal; spike-and-not-recover means compaction isn't keeping up with write rate.
Configurable alert triggers
Set up custom triggers in your dashboard to get notified the moment CouchDB metrics cross your defined thresholds.
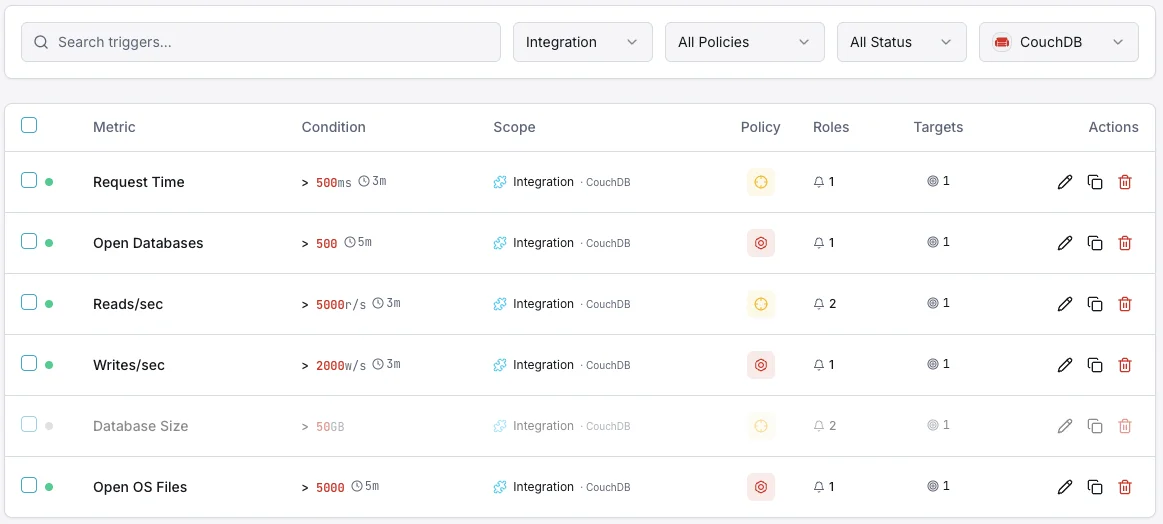
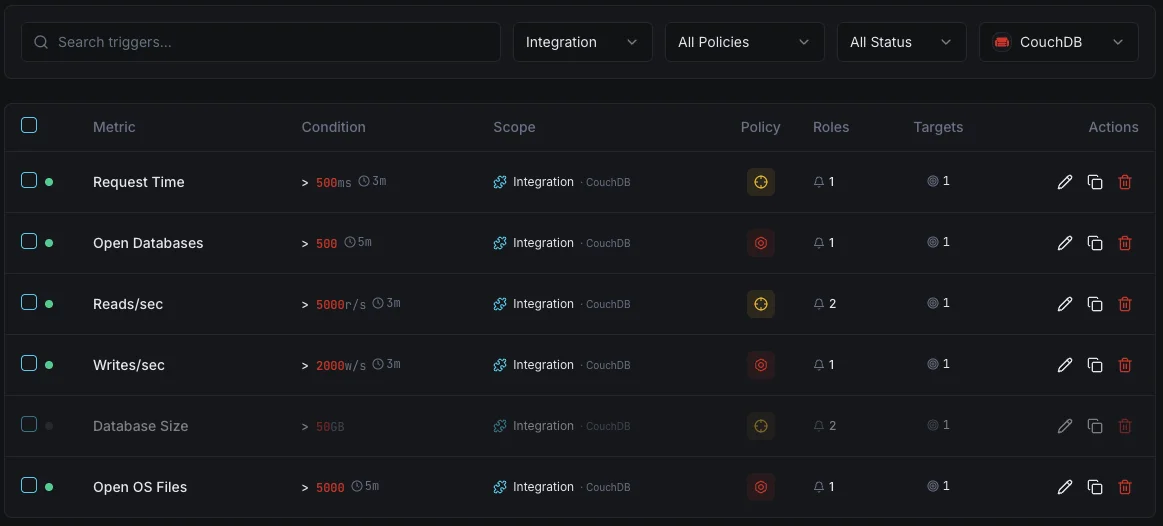
Replication Lag
criticalFires when replication falls behind.
Request Rate
warningAlerts on unusual request patterns.
Database Size
warningTriggers when database exceeds size threshold.
Compaction
warningFires when compaction hasn't run recently.
Importance of CouchDB Monitoring
CouchDB's multi-master replication requires monitoring to ensure data consistency and performance.
- Track replication health across clusters
- Monitor document operations for performance
- Detect compaction needs
- Ensure database size management
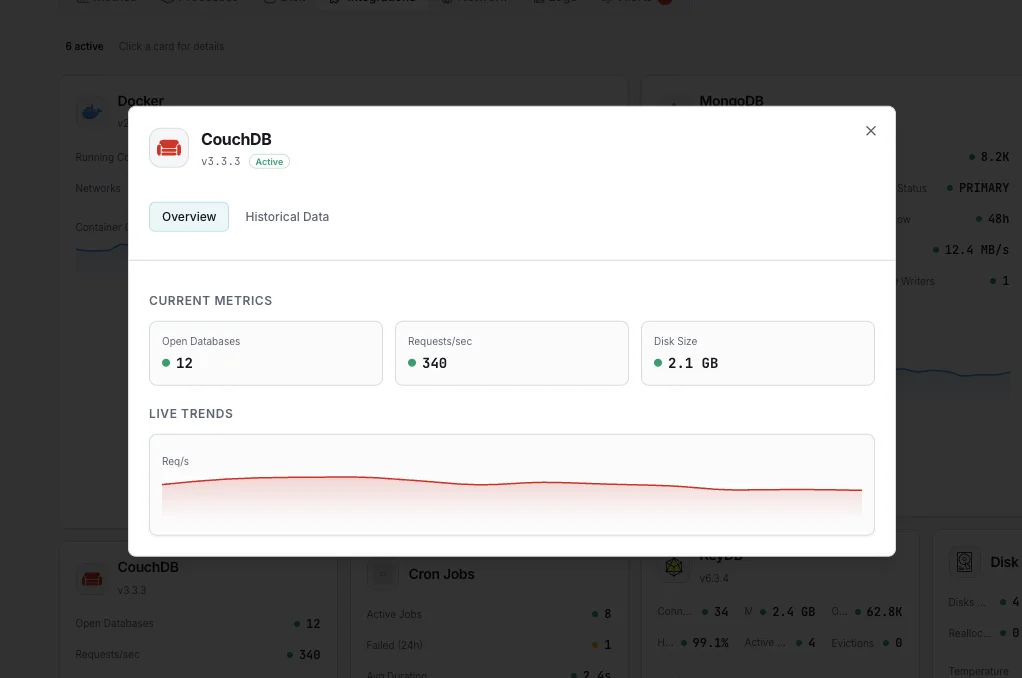
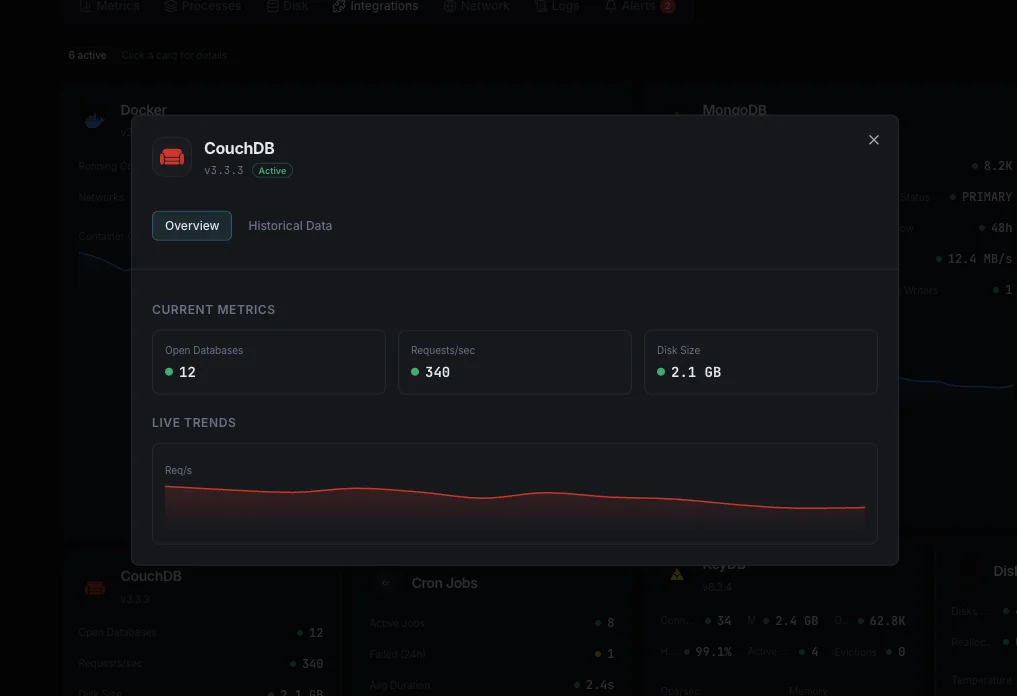
Why Choose Xitoring
Zero-config CouchDB monitoring.
- One-command install
- Global nodes
- Unified dashboard
- Multi-channel alerts
- Historical retention
Common CouchDB monitoring scenarios
Where CouchDB typically runs today — and what could go wrong if no one's watching.
Mobile and field apps that work offline
Retail point-of-sale, healthcare, and field-service apps sync their data back to a central server whenever they're online. When that sync silently fails, staff keep working — but the office is making decisions on stale information. We catch the failure the moment it begins so the data stays trustworthy.
Data flowing in from remote devices
Sensors and devices in the field send their readings back to a central database. When that pipeline gets stuck, data piles up at the device and eventually gets lost. We watch the flow end to end so any blockage is caught before a single reading is dropped.
High-availability database for critical apps
Production apps spread their database across multiple servers so a single failure doesn't take them down. But subtle imbalances between servers can quietly erode that protection. We surface them early so the safety net stays real when you actually need it.
Prerequisites for CouchDB
Make sure you've got these in place — most installs are a 60-second job once they are.
- Apache CouchDB 2.x or 3.x (3.3/3.4/3.5 in 2026) running
- Admin credentials with read access to
/_node,/_stats,/_active_tasks,/_scheduler/jobs, and/_membership - Network reachability from Xitogent to the CouchDB HTTP API (default port 5984; 5985 for the Clouseau Lucene/FTS sidecar when used)
Get started in minutes
Install Xitogent on your server
If you haven't already, install the lightweight Xitogent monitoring agent on the host running CouchDB.
curl -s https://xitoring.com/install.sh | sudo bash -s -- --key=YOUR_API_KEYExpose the CouchDB stats endpoint
CouchDB ships server statistics over its HTTP API at `/_node/_local/_stats` (port 5984 by default). Ensure the endpoint is reachable from the agent host and that the configured user has read access to administrative endpoints.
sudo xitogent integrateEnable the CouchDB integration
Use the Xitoring dashboard or CLI to enable the CouchDB integration. Xitogent auto-detects your node and starts collecting request, replication, and storage metrics.
Configure alert thresholds (optional)
Set custom thresholds for Replication Lag, Request Rate, or Database Size to catch capacity and replication issues before they become outages.
Verify it's working
Run this command on the server to confirm Xitogent picked up the integration. Fresh metrics will start streaming to your dashboard within ~30 seconds.
sudo xitogent statusConsidering alternatives?
See how Xitoring stacks up against the alternatives for CouchDB monitoring — flat pricing, deeper integrations, and one agent that covers your whole stack.



Frequently asked questions
What is CouchDB monitoring?
How do I monitor a CouchDB cluster's health?
What is compaction in CouchDB and how do I monitor smoosh?
How do I monitor CouchDB replication?
How do I track CouchDB view index build progress?
What does the /_active_tasks endpoint show?
How do I monitor CouchDB read/write throughput?
How do I detect CouchDB shard imbalance?
What CouchDB versions are supported?
Start monitoring CouchDB today
Set up in under 60 seconds. No credit card required. Full metrics from day one.
Start Free TrialKeep exploring


