
Disk Health Monitoring
Monitor SMART attributes (Reallocated_Sector_Ct, Current_Pending_Sector_Ct, Offline_Uncorrectable, Temperature, UDMA_CRC_Error_Count) plus NVMe percentage_used, available_spare, and critical_warning in real time.
Why monitor Disk Health?
Disk failures cause more data loss than any other hardware issue — and SMART data predicts most of them days or weeks ahead. Reallocated sectors creep up, NVMe spare capacity drops, temperatures spike. Monitoring those signals is the highest-ROI alert you can set: catch the failing drive while you still have time to migrate data and swap it without downtime.
Disk health monitoring, explained
Disk health monitoring catches reallocated-sector growth, NVMe wear-out, temperature spikes, and impending failure indicators days or weeks before drives die — long enough to migrate data and swap the drive without downtime. For database servers, backup hosts, and any workload where drive failure means data loss, SMART monitoring is the single highest-ROI alert you can set. Xitoring runs smartctl + nvme-cli locally and routes alerts to Slack, PagerDuty, Telegram, or your existing on-call.
What we monitor
SMART Overall Health (PASS / FAIL)
`smartctl -H` overall assessment. PASS = no pre-fail attributes below threshold; FAIL = drive replacement urgent. The single most actionable disk health signal — alert immediately on any FAIL.
Reallocated_Sector_Ct (SMART 5)
Sectors the drive has remapped to spare area after read/write failures. > 0 = warning (drive is starting to fail); > 10 or any rapid increase = critical. The first Backblaze 5 attribute.
Current_Pending_Sector_Ct (SMART 197)
Sectors that failed a read and are waiting to be remapped on next write. Any non-zero value is a hard warning — the drive has detected unreadable data. Backblaze 5.
Offline_Uncorrectable (SMART 198)
Sectors permanently unreadable. Any non-zero value = data loss has occurred. Critical alert. Backblaze 5.
Reported_Uncorrectable_Errors (SMART 187)
ECC errors the drive's internal correction couldn't fix. Strong failure predictor in the Backblaze studies — alert on any growth.
Command_Timeout (SMART 188)
Commands that exceeded the SATA bus timeout. Rising values usually mean cable, controller, or drive electronics are failing. Backblaze 5.
Temperature_Celsius (SMART 194)
Current drive temperature. HDDs degrade above 50°C; consumer SSDs throttle above 70°C. Alert at vendor-rated maximum minus 10°C for early warning.
UDMA_CRC_Error_Count (SMART 199)
Cable-related CRC errors on the SATA/SAS interface. Rising values flag a bad cable or loose connection — easy fix that's often misdiagnosed as drive failure.
SSD Wear (Wear_Leveling_Count + Total_LBAs_Written)
SSD endurance tracking. `Wear_Leveling_Count` normalised remaining life; `Total_LBAs_Written` plus the drive's rated TBW gives current wear percentage. Alert at 80% used.
NVMe percentage_used
From `nvme smart-log` — vendor's estimate of life consumed (0–100%, can exceed 100% on worn drives). Warn above 80%; critical above 95%.
NVMe available_spare
Percentage of spare capacity remaining for bad-block replacement. Warn below 10%; critical below 5% (`available_spare_threshold` is typically set there).
NVMe critical_warning
Bitfield from `nvme smart-log` flagging: spare below threshold, temperature above threshold, device reliability degraded, read-only mode, volatile memory backup failed. Any non-zero value = immediate alert.
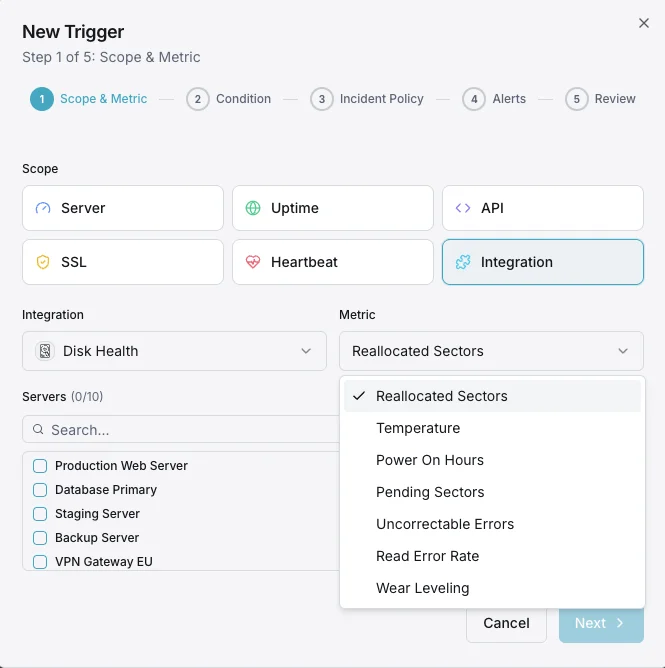
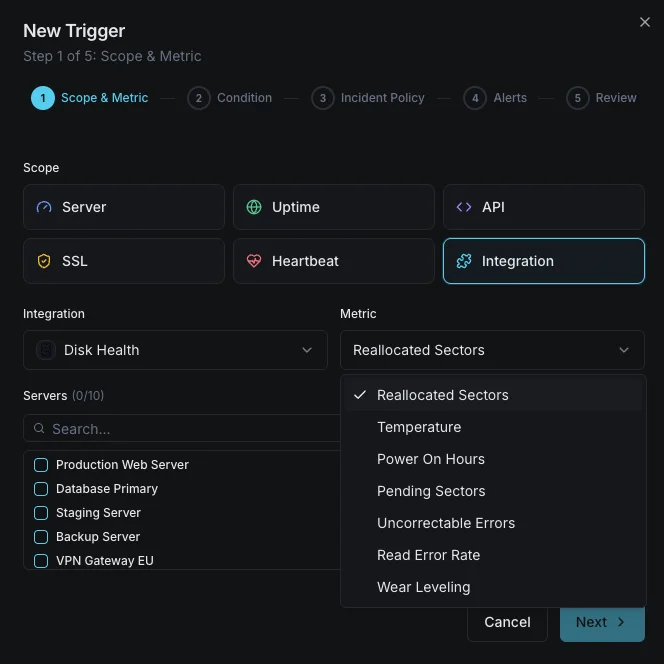
Configurable alert triggers
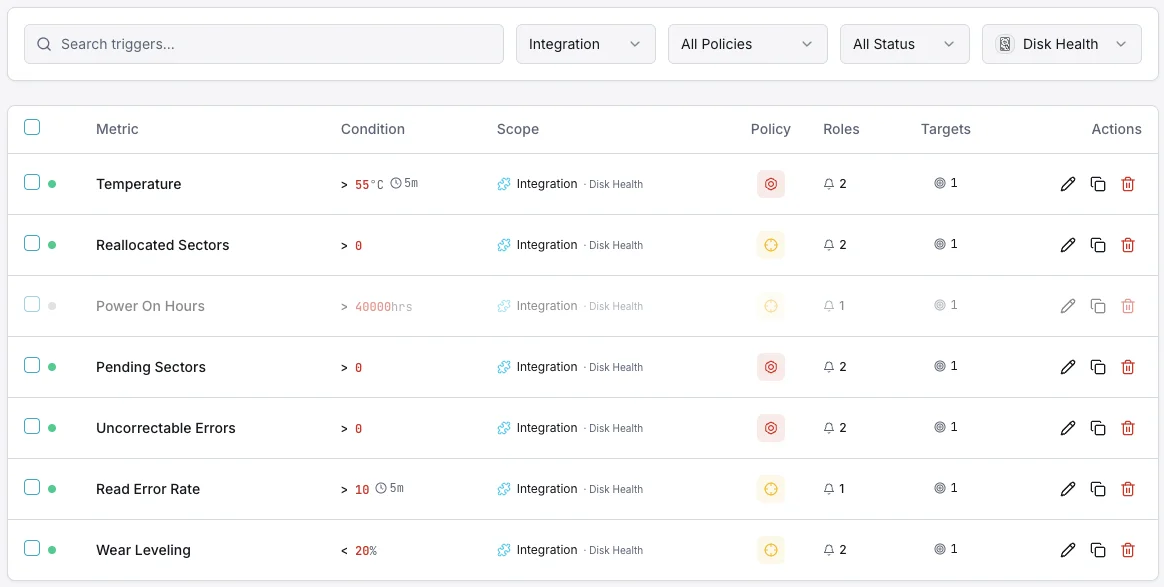
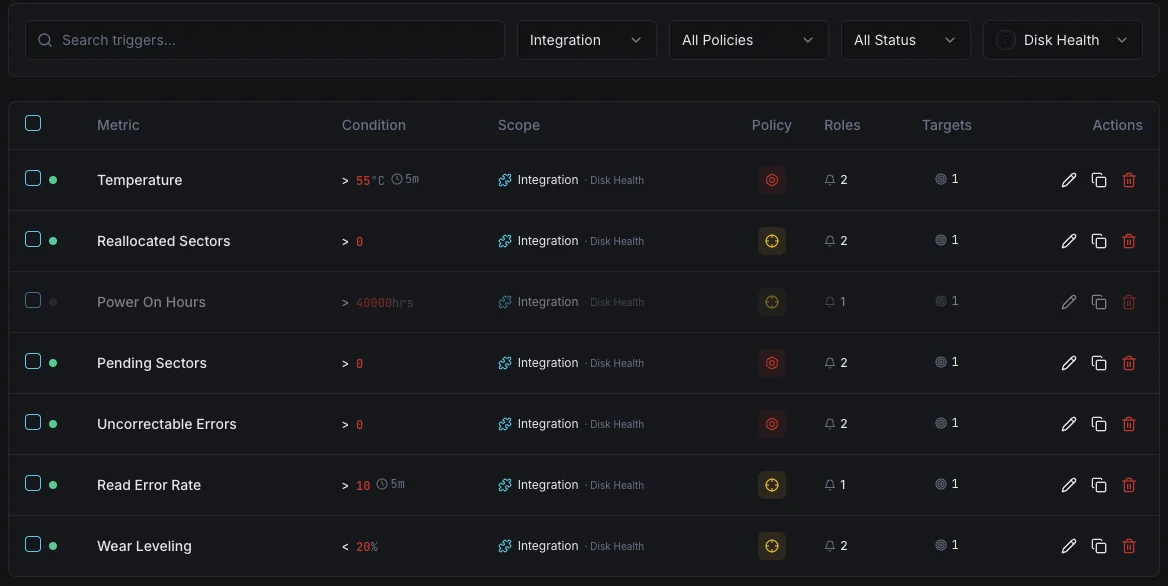
Set up custom triggers in your dashboard to get notified the moment Disk Health metrics cross your defined thresholds.
SMART Health Status
criticalFires when SMART reports a failing health status.
Reallocated Sectors
criticalAlerts when reallocated sector count exceeds threshold.
Disk Temperature
warningTriggers when disk temperature exceeds safe operating range.
Pending Sectors
warningFires when pending sector count indicates potential failure.
Importance of Disk Health Monitoring
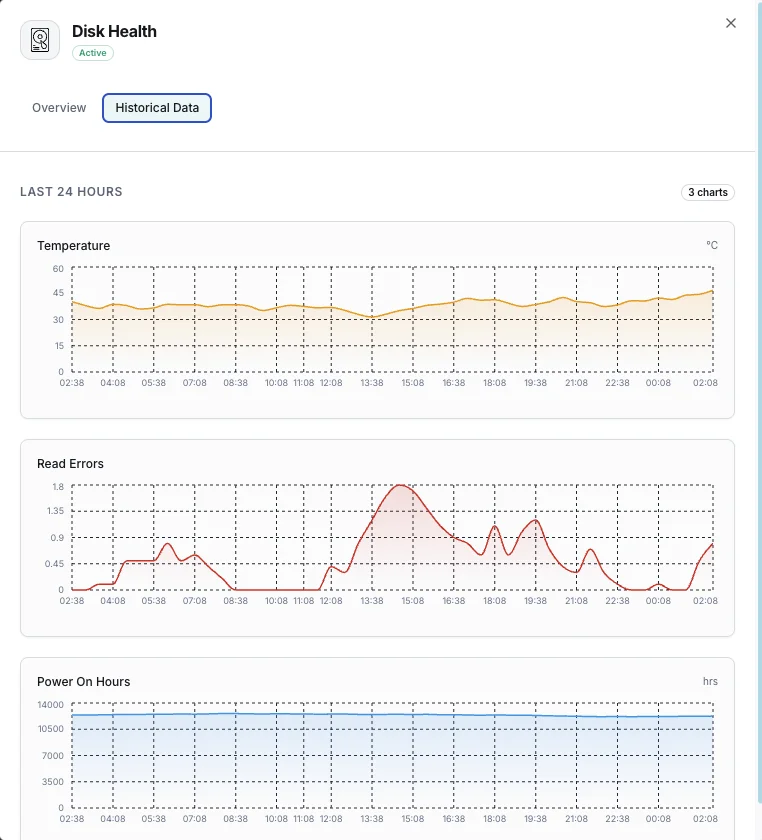
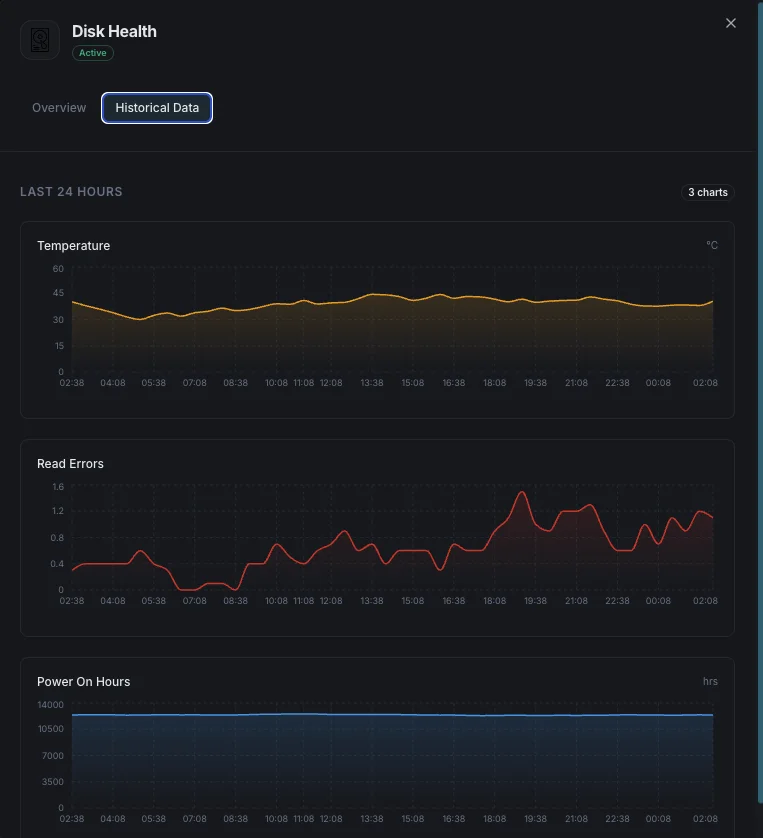
Disk failures can result in data loss and costly downtime. SMART monitoring provides early warning signs — from rising temperatures and increasing reallocated sectors to read error spikes — so you can act before a drive fails.
- Prevent data loss with early failure detection
- Optimize performance by identifying bottlenecks
- Plan capacity with historical trend analysis
- Maintain compliance with data integrity monitoring
Why Choose Xitoring
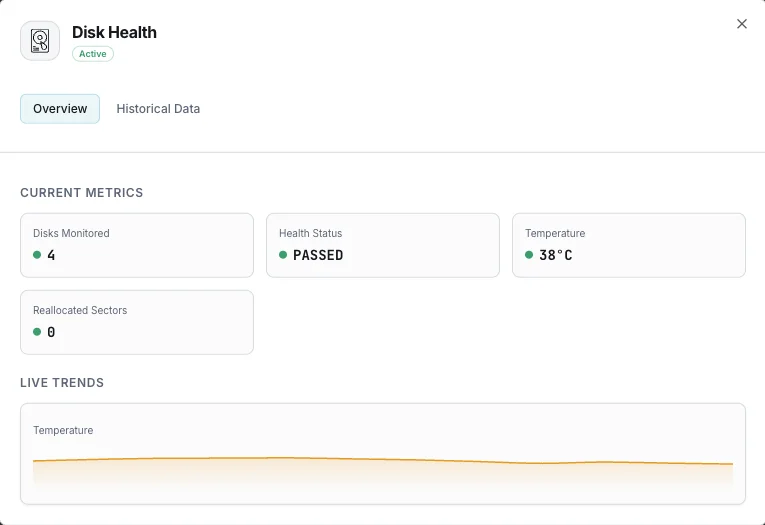
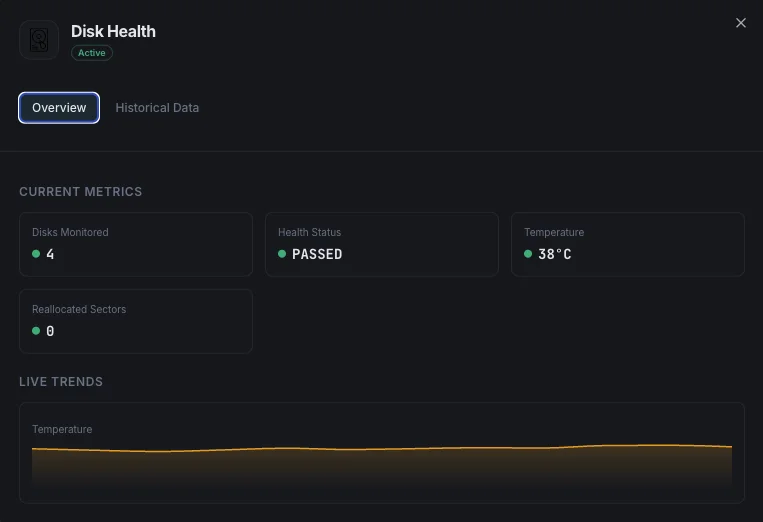
Xitoring provides zero-config disk health monitoring with SMART integration for all disk types. Get real-time alerts, historical trends, and predictive failure indicators in a unified dashboard.
- Supports SSDs, HDDs, and RAID arrays
- One-command setup on Linux & Windows
- Customizable SMART attribute thresholds
- Multi-channel alerting for critical disk events
Common disk health monitoring scenarios
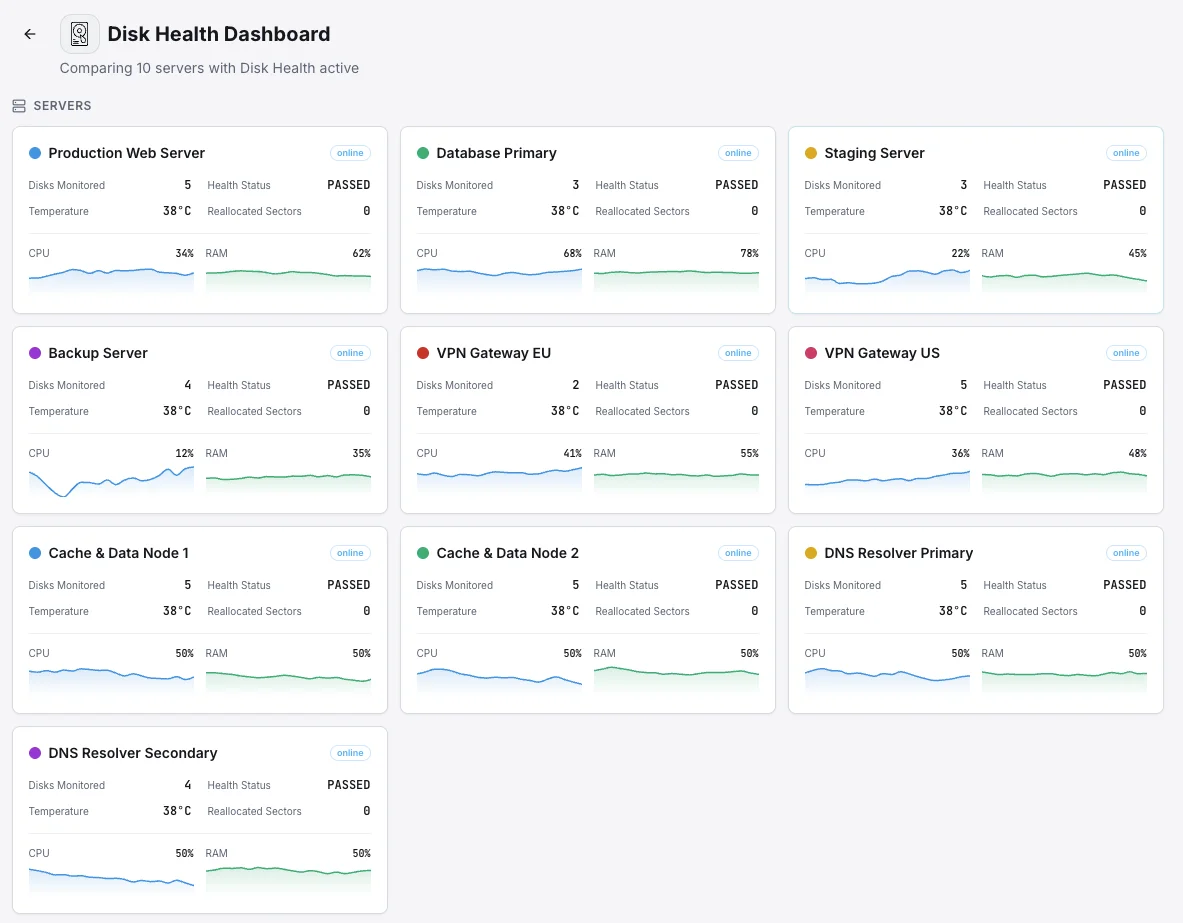
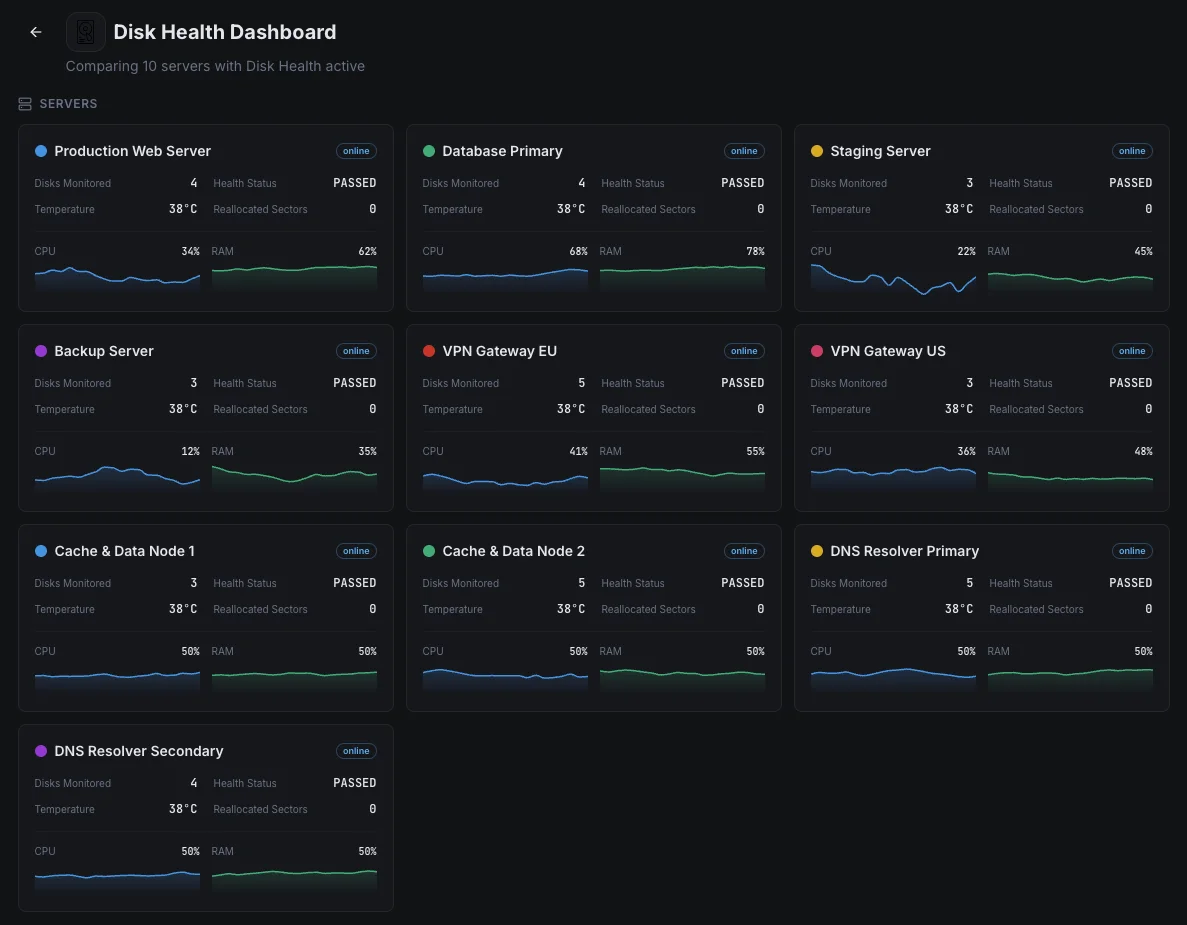
Where disk monitoring most often catches drive failures before they cause real damage.
Database servers
A failed drive in a database can mean downtime, lost orders, or in the worst case, corrupted data. We watch every drive for the early warning signs of failure so the team can swap a struggling disk on their own schedule — not in the middle of an outage at 3 AM.
Backup and archive servers
The unique problem with backup drives is that a failure stays invisible until the day you actually need the backup — by then it's too late. We test each drive on a schedule and surface wear early so you never reach for a backup that isn't there.
Servers that write a lot of data (SSDs)
SSDs have a limited number of writes before they wear out, and busy databases and data-heavy apps burn through them faster than most teams realize. We track wear in plain percentages so drives get replaced on time — not after a sudden, unrecoverable failure.
Prerequisites for Disk Health
Make sure you've got these in place — most installs are a 60-second job once they are.
- Linux server (Debian/Ubuntu, RHEL/CentOS/Alma/Rocky, or compatible) — OR Windows Server
- Linux:
smartmontools(apt install smartmontools/dnf install smartmontools) +nvme-cli(for NVMe drives) +lsblk - sudo / root access — SMART data requires elevated permissions
Get started in minutes
Install prerequisites (Linux)
Install smartmontools to enable SMART data collection. Ensure lsblk is available on your system.
# Ubuntu/Debian
sudo apt-get install smartmontools

# CentOS/RHEL
sudo yum install smartmontoolsEnable Disk Health integration
Run the integrate command and select Disk Health. Xitogent will auto-detect your disks and start collecting SMART data. No prerequisites needed on Windows.
xitogent integrateVerify it's working
Run this command on the server to confirm Xitogent picked up the integration. Fresh metrics will start streaming to your dashboard within ~30 seconds.
sudo xitogent statusConsidering alternatives?
See how Xitoring stacks up against the alternatives for Disk Health monitoring — flat pricing, deeper integrations, and one agent that covers your whole stack.



Frequently asked questions
What is SMART monitoring?
How do I check disk health on Linux?
What does Reallocated_Sector_Ct mean?
How do I monitor SSD wear-out?
What SMART attributes predict drive failure?
How do I monitor NVMe drive health?
How do I monitor disk health on Windows?
How often should I run smartctl self-tests?
Does this work with RAID arrays?
Start monitoring Disk Health today
Set up in under 60 seconds. No credit card required. Full metrics from day one.
Start Free Trial