RabbitMQ Monitoring
Monitor RabbitMQ queue depth (messages_ready / unacknowledged), publish/deliver/ack rates, memory & disk alarms, file descriptors, cluster partitions, and quorum queue state in real time — via the management HTTP API or `:15692` Prometheus endpoint.
Why monitor RabbitMQ?
RabbitMQ is the broker behind Celery, Sidekiq, microservice eventing, and MQTT IoT pipelines. Queue saturation, memory and disk alarms (which block all publishers cluster-wide), and quorum queue leader-election storms cause processing delays or full broker outages. Monitoring catches the signals before stuck consumers and multi-million-message backlogs.
RabbitMQ monitoring, explained
RabbitMQ monitoring catches queue saturation (consumers can't keep up), memory + disk alarms (publishers get blocked), unacknowledged-message buildup (slow consumers), connection / channel leaks, cluster partition events, and quorum queue leader election issues before they cause message processing delays, full broker outages, or data loss. For Celery / Sidekiq task queues, microservice eventing, MQTT IoT ingestion, and any production RabbitMQ cluster, per-queue + per-node visibility is what separates a 60-second alert on a stuck consumer from finding 10M messages backed up tomorrow. Xitoring auto-discovers your RabbitMQ, reads the management API + Prometheus plugin, and routes alerts to Slack, PagerDuty, Telegram, or your existing on-call.
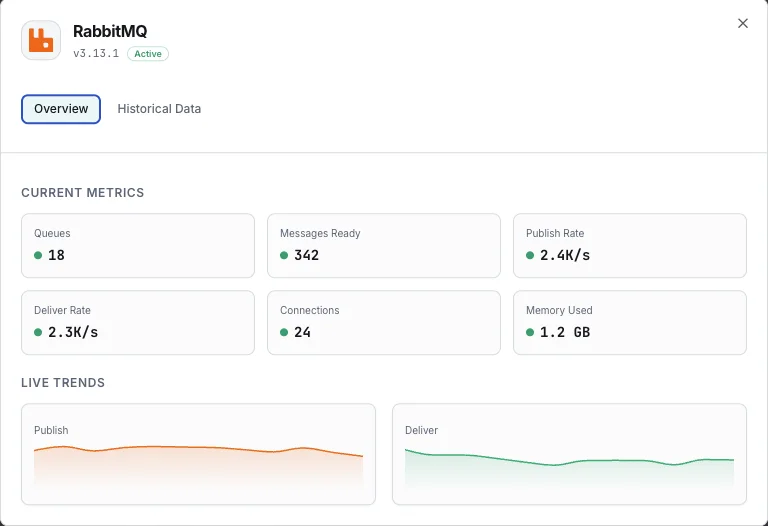
What we monitor
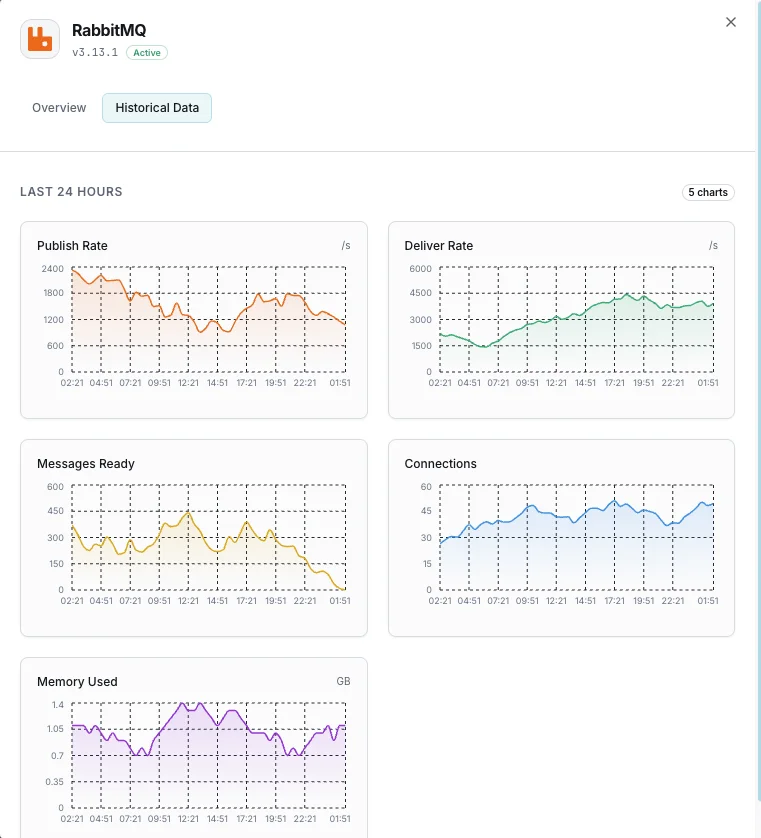
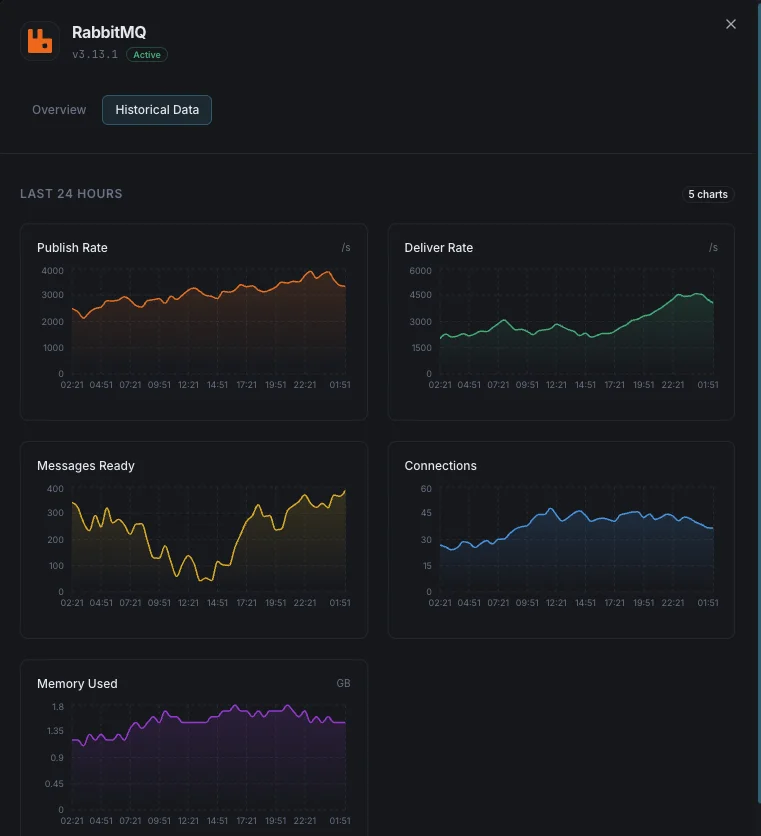
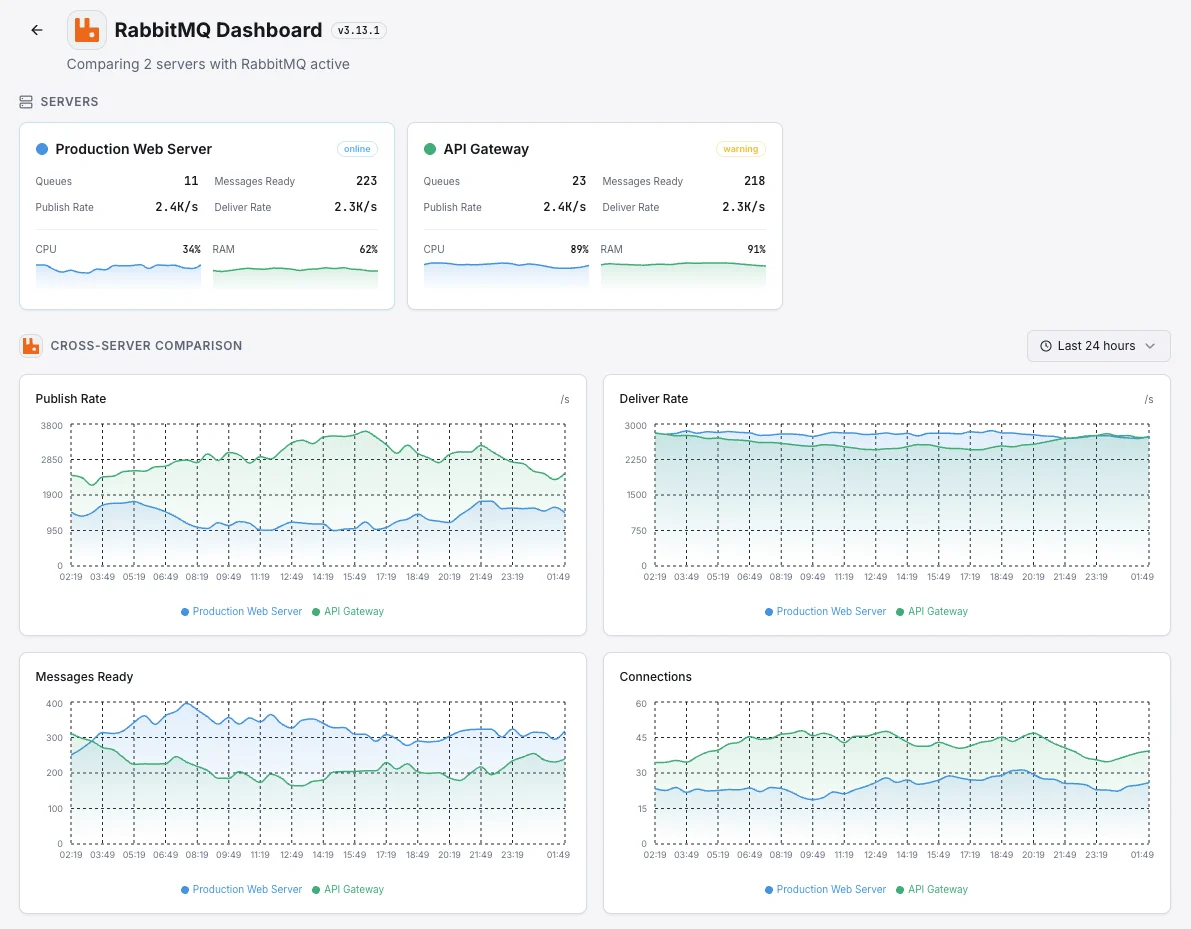
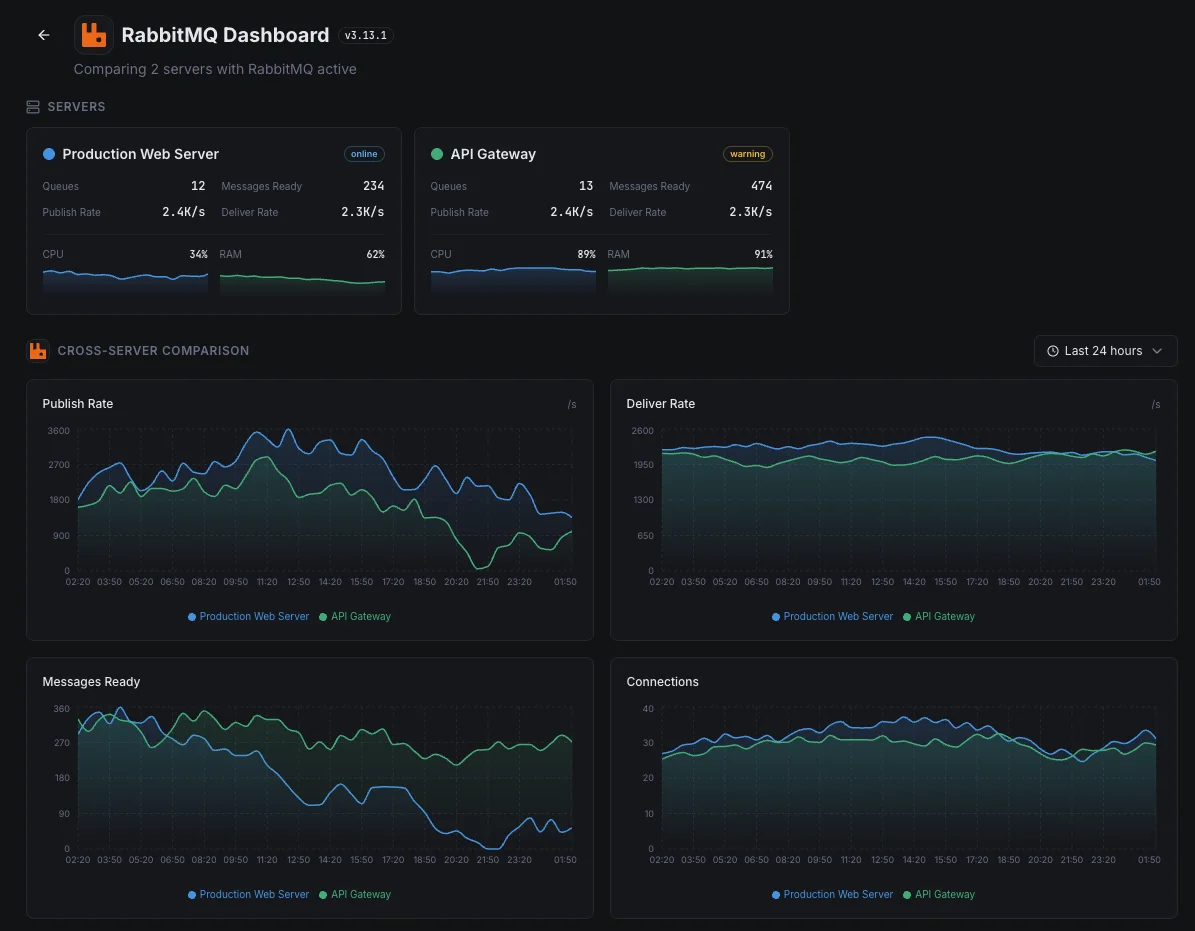
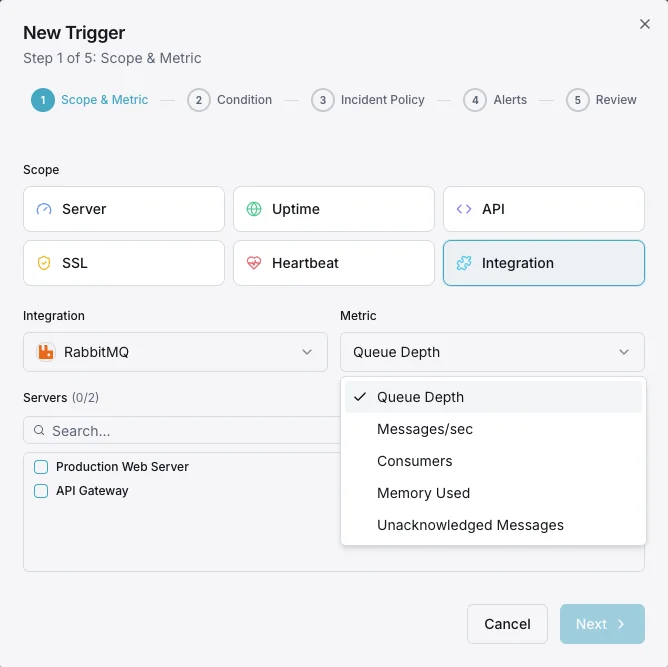
Queue Depth
Number of messages ready and unacknowledged in each queue.
Message Rates
Publish, deliver, acknowledge, and redelivery rates per second.
Consumer Count
Number of active consumers attached to each queue.
Node Memory
Memory used by each RabbitMQ node including binary and queue memory.
Disk Free Space
Available disk space on each node against the configured alarm threshold.
Connection Count
Total client connections and channels across the cluster.
Exchange Rates
Message rates through each exchange (publish in/out).
Unroutable Messages
Messages that couldn't be routed to any queue.
File Descriptors
Used vs available file descriptors on each node.
Erlang Processes
Number of Erlang processes running on each node.
Cluster Partitions
Network partition events between cluster nodes.
Dead Letter Messages
Messages routed to dead letter exchanges due to rejection or TTL expiry.
Configurable alert triggers
Set up custom triggers in your dashboard to get notified the moment RabbitMQ metrics cross your defined thresholds.
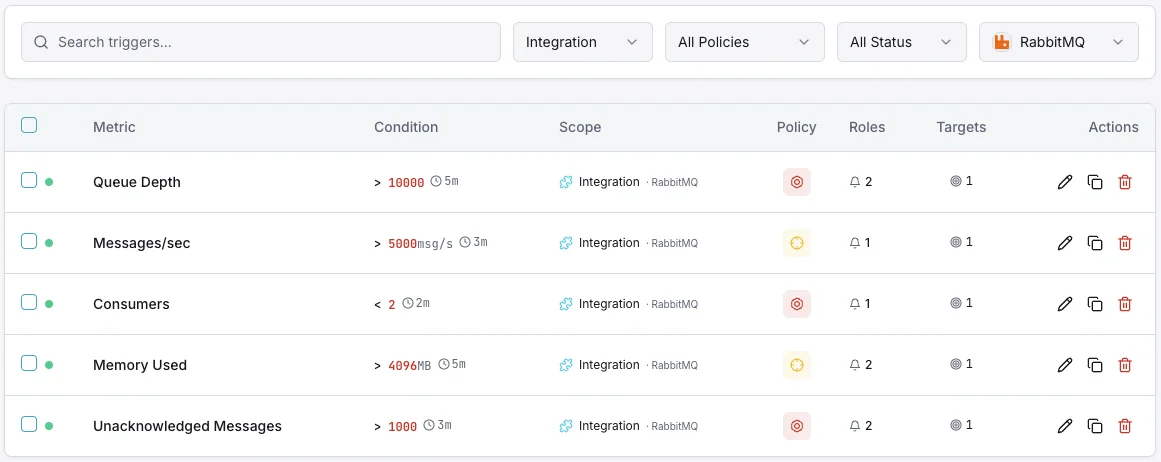
Queue Depth
criticalFires when messages pile up in a queue, indicating consumers can't keep up with producers.
Consumer Count
warningTriggers when consumers drop below threshold, risking message processing delays.
Node Memory
criticalAlerts when node memory approaches the high watermark, risking flow control activation.
Message Rate
warningFires when publish or delivery rates deviate significantly from baseline.
Disk Free Alarm
criticalTriggers when disk space drops below the configured threshold, blocking all publishers.
Unacknowledged Messages
warningAlerts when unacked messages grow, indicating slow or stuck consumers.
Importance of RabbitMQ Monitoring
RabbitMQ is the backbone of event-driven architectures — handling order processing, notifications, data pipelines, and inter-service communication. Without monitoring, queue saturation, consumer failures, and memory pressure can cascade into full system outages.
- Detect queue buildup before it causes application timeouts
- Monitor consumer health to ensure message processing continuity
- Track memory and disk usage to prevent flow control activation
- Identify unroutable and dead-lettered messages early
- Ensure cluster partition recovery for high availability
Why Choose Xitoring
Xitoring delivers enterprise-grade RabbitMQ monitoring with zero-config setup. Our lightweight agent auto-discovers your RabbitMQ nodes, starts collecting metrics in under 60 seconds, and integrates with your existing notification channels.
- One-command install — no complex YAML or config files
- 15+ global monitoring nodes for low-latency checks
- Unified dashboard for servers, message brokers, and uptime
- Flexible alerting via Slack, PagerDuty, Telegram & more
- Historical data retention for capacity planning & audits
Common RabbitMQ monitoring scenarios
Where RabbitMQ typically runs today — and what could go wrong if no one's watching.
Background jobs in a web app
Web apps push slow work — sending emails, generating PDFs, processing payments — to a background queue so the site stays fast. When that queue quietly backs up, those tasks are delayed for every user. We catch the backup early so the team can fix it before customers notice.
The messaging backbone connecting your apps
When messages pass between apps to keep data in sync, any slowdown means one app is silently falling behind. We catch the lag the moment it begins so it doesn't quietly grow into a customer-visible problem.
Collecting data from IoT devices
Smart devices and sensors send constant streams of data to a central server. When that pipeline gets stuck, data is silently dropped or delayed. We watch the flow so every device reading is accounted for.
Prerequisites for RabbitMQ
Make sure you've got these in place — most installs are a 60-second job once they are.
- RabbitMQ 3.13.x or 4.x running with the management plugin enabled (port 15672) — OR
rabbitmq_prometheusplugin enabled (port 15692) - A user with the
monitoringtag for management API access - Network reachability from Xitogent to the management API and/or Prometheus endpoint
Get started in minutes
Install Xitogent on your server
If you haven't already, install the lightweight Xitogent monitoring agent on your server.
curl -s https://xitoring.com/install.sh | sudo bash -s -- --key=YOUR_API_KEYEnable the RabbitMQ management plugin
Xitogent collects metrics via the RabbitMQ management API. Enable the plugin if not already active:
rabbitmq-plugins enable rabbitmq_managementEnable the RabbitMQ integration
Use the Xitoring dashboard or CLI to enable the RabbitMQ integration. Xitogent will auto-detect your instance.
sudo xitogent integrateConfigure alert thresholds (optional)
Set custom thresholds for queue depth, consumer count, or memory usage to get notified when something needs attention.
Verify it's working
Run this command on the server to confirm Xitogent picked up the integration. Fresh metrics will start streaming to your dashboard within ~30 seconds.
sudo xitogent statusConsidering alternatives?
See how Xitoring stacks up against the alternatives for RabbitMQ monitoring — flat pricing, deeper integrations, and one agent that covers your whole stack.


Frequently asked questions
What is RabbitMQ monitoring?
How do I monitor queue depth in RabbitMQ?
How do I detect RabbitMQ memory and disk alarms?
What is the difference between classic, quorum, and stream queues?
How do I monitor RabbitMQ cluster status and network partitions?
How do I enable the Prometheus plugin in RabbitMQ?
What does the rabbitmq_management UI show?
RabbitMQ vs Kafka monitoring — what's different?
What RabbitMQ versions are supported?
Start monitoring RabbitMQ today
Set up in under 60 seconds. No credit card required. Full metrics from day one.
Start Free TrialKeep exploring