Why SQL Server Monitoring is Essential
Your SQL Server databases are the backbone of your applications—when they slow down or fail, your entire business feels the impact. Here’s what happens without proper monitoring:
Silent Performance Killers Creep In
-
Queries that ran in milliseconds suddenly take seconds—but no one notices until users complain
-
Index fragmentation builds up, turning your once-efficient database into a sluggish mess
-
Memory pressure forces excessive disk I/O, dragging down entire workloads
Outages Strike Without Warning
-
A full transaction log brings operations to a halt—during peak business hours
-
Failed automatic backups leave you unprotected before a critical failure
-
Availability groups fall out of sync, creating data inconsistencies
Resources Get Wasted Blindly
-
Overprovisioned servers drain budgets when optimization could cut costs
-
TempDB contention throttles throughput despite available capacity
-
Storage runs out at the worst possible moment because growth wasn’t tracked
Security Risks Go Undetected
-
Brute force attacks probe your login pages for weeks before discovery
-
Privileged accounts access sensitive data without triggering alerts
-
Malicious queries exfiltrate data disguised as normal traffic
Scaling Becomes a Guessing Game
-
New application features cause unpredictable load spikes
-
Cloud migrations fail because baseline metrics weren’t established
-
Seasonal traffic overwhelms systems that ran fine in testing
This Is What Xitoring Fixes
Our SQL Server monitoring doesn’t just show metrics—it exposes the make-or-break details that prevent disasters:
Query-Level DNA Analysis – See exactly which queries are degrading, why, and how to fix them
Failure Predictions – Get alerts on transaction log growth, deadlock patterns, and other failure precursors
Resource Truth-Telling – No more guessing about real CPU/memory/disk needs
Stealth Threat Detection – Spot abnormal login patterns and data access before breaches occur
Growth Forecasting – Right-size your infrastructure with science instead of hunches
This isn’t “nice-to-have” monitoring—it’s your early warning system against everything that can derail your databases.


Key Benefits of Xitoring for SQL Server
-
Comprehensive Coverage – Monitor all critical aspects from query performance to hardware resources
-
Expert-Tuned Thresholds – Pre-configured alerts based on SQL Server best practices
-
Root Cause Analysis – Correlate database issues with underlying system problems
-
Historical Benchmarking – Compare current performance against baselines
-
Customizable Dashboards – Tailor views to DBA, developer, or executive needs
-
Multi-Instance Support – Centralized monitoring for all your SQL Servers
Monitor What Matters Most
Xitoring provides specialized monitoring for:
-
Query Store performance data
-
In-Memory OLTP metrics
-
Columnstore index health
-
Temporal table performance
-
PolyBase external query stats
Ensure your SQL Server environment delivers the performance and reliability your business demands. With Xitoring’s SQL Server monitoring, gain the insights needed to optimize, secure, and scale your database infrastructure with confidence.
How to start monitoring your SQL Server?
-
1
Install Xitogent
Easily run one command and install Xitogent on your Linux or Windows server
-
2
Enable Integration
Now run `xitogent integrate` on your server and select SQL Server, it will show you the process of the installation.
-
3
Configure Triggers
You can easily configure several triggers including CPU and Memory Usage and alerts and receive them in your favorite notification channel.
Start monitoring your SQL Server today
FAQ
How much does it cost for each SQL Server?
SQL Server monitoring is included at no cost for all servers. on the Flexible plan, each server costs $5.00/mo and you can save much more on combo plans (up to 50%)
More details about pricing
How long does it take to setup SQL Server monitoring?
If you have Xitogent running on your server on average it would take five minutes to configure and make everything running!
More technical details can be found here: How to monitor SQL Server on Xitoring
How to monitor SQL Server for free?
Xitoring offers 30 days trial to try SQL Server monitoring. Basic Server metrics and uptime monitoring are always free.
What kind of alerts do I get for SQL Server monitoring?
There are many options to configure your customized trigger and alerts, including cache hit, user connections, cpu usage, memory usage and etc.
What graphs do you provide for SQL Server monitoring?
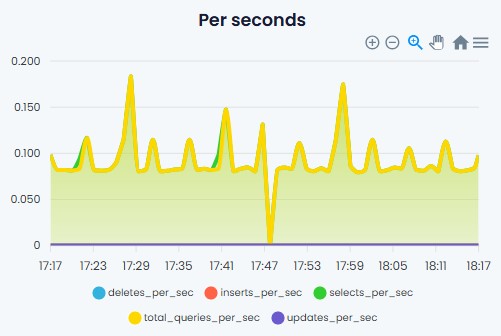
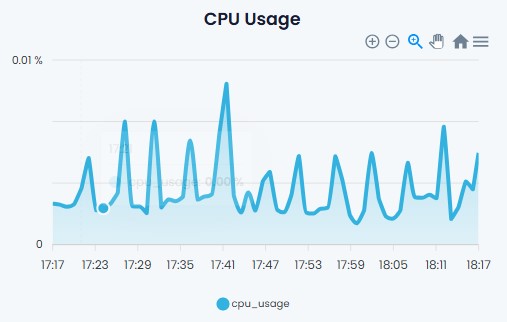
We provide graphs tons of graphs about your cache hit, user connections, cpu usage, memory usage and etc.
Need Help or Quote?
Have questions or need assistance? Our dedicated support team is here to help. Reach out to us anytime, and we’ll be happy to assist you.


