How to Analyze and Optimize MySQL performance
Introduction
MySQL is an open-source relational database that many users prefer to use in their daily operations because of the diversity of storage engines it supports, its flexibility and high performance, robust data security, cost-effectiveness, ease of maintenance, and reliability.
Why should MySQL performance be measured and monitored?
Ensuring smooth and effective database performance is one of the most important features of any organization or company, large or small. Thus, in some cases, having a complete understanding of database uptime or load is crucial and should be monitored frequently.
As a result, numerous monitoring tools are available on the market to track, analyze, and measure performance, as well as examine potential difficulties. They help you optimize queries and visualize database metrics, collect statistics, and present the performance status so that you can understand the influence on overall performance and potential issues that need to be troubleshot.
The following advantages may emerge from optimizing database performance:
- Boost data retrieval speed
- Improve query performance significantly
- Determine sluggish performance
- Enhance the user experience
- Prevent potential downtime and unnecessary resource utilization
- Determine the effect of database modifications
- Security flaws must be identified
Metrics for MySQL Database Performance
MySQL provides several valuable metrics that you should watch to spot bottlenecks and determine which queries should be improved.
The following are the most essential database performance monitoring metrics:
- System: The server’s system resources comprise CPU utilization, memory utilization, disk utilization, network bandwidth, read/write requests, input/output wait statistics, average read/write time, and so on.
- Query throughput: A database burden that can be assessed in terms of queries per second. With this measure, you may examine the performance of specific statements and analyze how your server performs and processes queries over time (SELECT, INSERT, UPDATE, and DELETE).
- Connections: The number of concurrent open connections may overburden the server and slow down performance.
- Uptime: The amount of time required to set up a MySQL instance’s database and to shut it down.
- Threads: The number of clients who are currently connected.
- Response time: The average response time for each query or all queries on the database server to which you are connected.
- Latency: The length of time required for queries or activities.
- Errors: The number of code faults that occur most frequently and are the root cause of failures.
- Queries: the total amount of statements, including stored procedures, that the server executes most frequently.
- Questions: the number of statements clients have sent.
- Buffer pool usage: use of memory on the server. It is typically employed to look into performance-related problems.
Depending on the location, server status variables, performance schema, and sys schema can be used to categorize MySQL database performance metrics and statistics.
MySQL Server Stats
You can utilize server status variables to gather server statistics. You can see these internal counters at the session or global levels to learn more about the activities taking place on the MySQL server.
Use the SHOW [GLOBAL | SESSION] STATUS statement to inspect these variables. SESSION only returns information for the current connection, while GLOBAL returns aggregated values for all connections.
MySQL Performance Schema
Low-level statistics concerning server events and query execution are stored in the MySQL performance schema. As of MySQL v5.6.6, it is turned on by default.
MySQL represents it as the performance schema database, which has tables you can query with SQL commands. You subsequently receive performance-related data, such as real-time events, event histories, and summaries, object instances, setup information, the length of server events, status monitoring, etc.
Sys Schema in MySQL
The MySQL sys schema includes stored procedures, views, and functions to understand data gathered by the performance schema and determine how a MySQL instance is currently running. It is enabled by default in MySQL versions 5.7.7 and beyond. The sys schema gives details about how the database is being used, including the open connections, the queries that are running, the buffer size, the locks, and a summary of statement activity, I/O latency, host and user memory usage, wait for stats, and resources used by users, among other things.
Monitor Queries Performance
Users can keep an eye on various indicators, including CPU and memory consumption, execution time, disk activity, wait for stats, the I/O cycles, etc., to study query performance and identify lengthy and resource-intensive queries.
You can locate and look at slow query logs in MySQL. Run the following command to confirm that logs are enabled for this:
MariaDB [(none)]> show global variables like 'slow%log%';Along with this, turn on the “slow query log file” variable, which sets the name of the file where slow query logs will be stored, the “long query time” variable, which sets the real-time execution time, and the “min examined row limit” variable, which sets the minimum number of rows to be looked at. In order to increase query speed, it is possible to use all of these factors to identify queries that run slowly.
Running the following command is another way to find slow MySQL queries:
SHOW [FULL] PROCESSLIST;

-- or

SHOW ENGINE INNODB STATUS \G
They let you see what queries are running and their status:
The MySQL query logs are useful metrics for keeping track of queries. However, they do not fully picture how well queries work. In this case, MySQL third-party tools for query performance can help.
Tools for keeping an eye on MySQL performance
Many tools, like MySQL Enterprise Monitor, MySQL Workbench, and Query Profiler in dbForge Studio for MySQL, are on the market for monitoring MySQL performance that can be used to look at and improve query performance.
MySQL Enterprise Monitor is a monitoring tool that keeps an eye on MySQL real-time instances and hosts, notifies users of potential problems, and tells them how to fix them. With the tool, you can improve performance, stay up-to-date on releases and bug fixes, manage and avoid any problems or downtime, and optimize how things work. The Enterprise dashboard in MySQL Enterprise Monitor lets you check execution statistics, look for the most expensive queries, observe InnoDB performance tuning metrics, find security holes, analyze queries visually, and see the metrics of the MySQL servers you’re running. Still, you should know that MySQL Enterprise Monitor depends on MySQL performance schema. So, for work to go right, it should be turned on.
MySQL Workbench provides a graphical interface for modeling MySQL databases. It has a lot of useful and advanced features, and it also has a set of tools to look at database performance and make it better. The Performance dashboard can show the main performance metrics, such as incoming and outgoing network traffic, performance statistics, executed SQL statements, and the InnoDB status, which includes disk activity, writes and reads. Also, performance reports make it much easier to look at how well a MySQL database runs. Check the explained plan to fine-tune how well a SQL statement works.
Query Profiler is a MySQL query profiling and optimization tool with dbForge Studio for MySQL. It lets you look at and improve the performance of queries in MySQL and MariaDB databases. With the MySQL performance tuning tool’s “explain plan,” you can easily see how MySQL operations are run, how long it will take to run queries, and whether or not you should use indexes to improve performance. Query Profiler collects session statistics and shows profiling results that help you find possible bottlenecks and see how many resources are being used, so you can choose an effective way to improve performance. See MySQL Server Performance Tuning with Tips for Effective Optimization for more information on how to tune performance in a way that works.
Tackling Server Load
Often, a general slowdown is the first indication that something is wrong. Changing the settings in MySQL’s configuration file might result in more ideal settings if you’re experiencing extended periods of excessive resource use.
Running MySQLTuner is an excellent place to begin. This script evaluates your MySQL server automatically using 300 different performance metrics. It will generate a list of recommendations that can enable you to benefit more from your surroundings.
Since MySQLTuner is supplied as a Perl script, your system must have Perl installed. The commands below should be used to download and launch MySQLTuner:
wget http://mysqltuner.pl/ -O mysqltuner.pl
chmod +x mysqltuner.pl
./mysqltuner.pl --host 127.0.0.1 --username root --pass mysql-password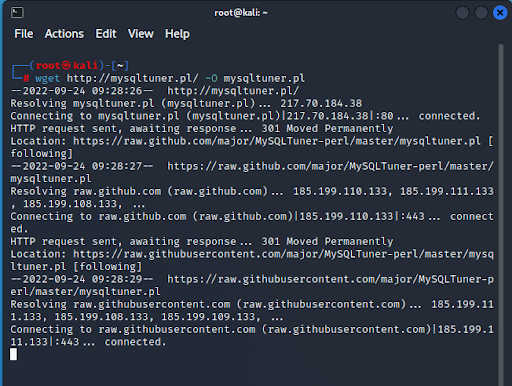
The syntax for connections is comparable to that of the MySQL command-line client. For the script to have complete access to your server, you should connect as the root user.
Because MySQLTuner bases its evaluation on the server that houses your data collection, it is useful. However, the results are only indicative; not all the advice will be taken, and some may even have the opposite effect of improving performance.
The script MySQLTuner is entirely read-only. It won’t alter the settings on your server in any way. If you accept a proposal, you must manually adjust the designated variable in your MySQL configuration file. Each operating system distribution has a different location for this file.
Location may be:
/etc/mysql/my.cnf and /etc/mysql/mysql.conf.d/mysqld.cnfRestart the MySQL server after making a change to a variable:
sudo /etc/init.d/mysql restartNow, you should give the server some time to operate regularly. The server performance can then be reevaluated by starting MySQLTuner once more. It can recommend altering the same variable once again. Continue making adjustments, but make sure all the settings are balanced. It’s unlikely that you’ll be able to change every variable to its recommended value without further suggestions. The output of MySQLTuner suggests running the server for 24 hours to obtain reliable assessment results.
Customizing Buffer Sizes
A noticeable performance boost can be achieved by altering the buffer and cache sizes. The comparatively tiny buffer sizes that MySQL, by default, won’t be effective for heavier workloads. K, M, or G are used to write values in the MySQL configuration file to denote the storage unit (e.g., 512M means 512 megabytes).
- innodb_buffer_pool_size: Generally speaking, this is between 70 and 80 percent of your memory. It specifies the size of the pool that is used to cache InnoDB table query requests. Assuming you have enough memory, try to make this at least as big as the whole size of your data set.
- innodb_buffer_pool_instances: an integer between 1 and 64 specifies how many InnoDB buffer pools will be active. Each page kept in the buffer pool is given a randomly selected instance. Concurrency may be enhanced by adding more instances.
- innodb_log_file_size: Redo log files can only be a certain size in a log group. These files are used to restore stalled transactions during crash recovery. Larger numbers enhance performance but lengthen the time it takes to recover from a crash.
- key_buffer_size: This is used for MyISAM tables and is comparable to “innodb buffer pool size.” Note that you should set the appropriate variable appropriately and modify the other to a reasonably small value, such as 32M if you only use MyISAM or InnoDB tables. Otherwise, supplying a huge buffer area for an idle table type would be a waste of RAM.
- join_buffer_size: The buffer size for joins without indexes is specified using this. The size of this buffer can be increased to speed up queries that use unindexed joins. Setting it too high may cause memory problems because each full join between tables requires allocating a join buffer. Multiple buffers, each with the capacity of “join buffer size,” are required for complex joins involving several tables, and this can quickly use up a lot of RAM. 256K is the default setting.
- sort_buffer_size: Similar to “join buffer size,” but for file sort sorting operations. Large result sets can be sorted more quickly with higher numbers, but a frequently used server runs the risk of having more memory use.
MySQL Monitoring
Conclusion
When it comes to increasing MySQL’s performance, there is no silver bullet solution that will work for everyone. Your server’s resources, the size of your data collection, and the level of resource competition caused by other workloads operating on the machine are all factors that will determine the steps that you will need to perform in order to complete the task.
It is possible that MySQL is not the cause of the performance issues you are experiencing; yet, you should not dismiss the importance of your application layer. Examine the questions that are asked of the database by your code.