How to install Wireshark on Windows Server and use it
Introduction
This blog will teach you how Wireshark functions. We’ll walk you through where to find and install the Wireshark application on your PC or Server. You will learn how to start a packet capture and what data you may expect to receive from it. The Wireshark lecture will also show you how to utilize the data manipulation features in the interface fully. You’ll also learn how to get data analysis tools better than Wireshark’s built-in features.
What can you do with Wireshark?
As one of the most dependable network protocol analyzers on the market in recent years, Wireshark has gained a solid reputation. This open-source program has been used as a comprehensive network analysis tool by users worldwide. Users can use Wireshark to analyze network security vulnerabilities, debug protocols, and learn about network activities.
How to Use Wireshark
Wireshark is a network protocol analysis tool, as was already described. Wireshark’s primary function is to deconstruct data packets sent across various networks. The user can look for particular data packets and filter them, then examine their passage across their network. These packets can be examined either in real-time or offline.
The user can use this data to produce statistics and graphs. Originally known as Ethereal, Wireshark has become one of the most important network analysis tools. Users who want to view data from various networks and protocols should use this tool.
Both novice and professional users can utilize Wireshark. Once you understand how to capture packets, the user interface is easy to use. Advanced users can decrypt packets using the platform’s decryption capabilities as well.
Wireshark main Features
The main characteristics of Wireshark are listed below:
- Take live packet data capture
- Packets from text files imported
- View the protocol and packet data information
- Save packet data obtained
- Display packets
- Filter packets
- Search packets make packets colorful
- Generate Statistics
Most users use Wireshark to check their software and find network issues. Wireshark is an open-source project maintained by a special staff that upholds high service standards. We explain how to utilize Wireshark in this guide. The official user manual for Wireshark has more details.
How to Download and Install Wireshark
Downloading and installing Wireshark is the initial step before using it. The firm’s website offers Wireshark for free download. You should download the most recent version from the “stable release” section for your platform to get the smoothest operating.
https://www.wireshark.org/download.html
Install Wireshark on Windows Server
Once the application has been downloaded, you can begin the setup procedure. You might be prompted to install WinPcap during installation. WinPcap is essential since you cannot record live network data without it. Only stored capture files can be opened without WinPcap. Check the Install WinPcap box to install.
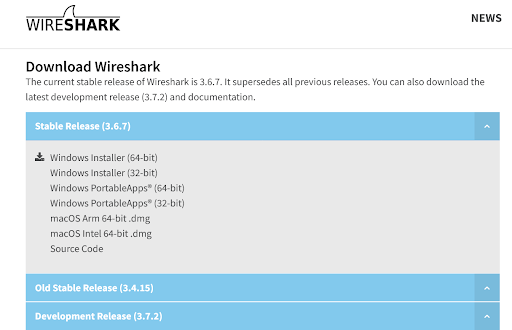
Choose the installer (64-bit or 32-bit) appropriate for your Windows architecture before clicking the link to download the file.
1. To launch the downloaded file, click on it. In the User Account Control window, select Yes.
2. On the installer’s welcome screen, select Next.
3. Click the Noted button on the License Agreement screen.
4. The Choose Components screen’s default settings should be left alone. Then press the Next button.
5. Click Next after leaving the Additional Tasks screen’s options alone.
6. click Next after choosing your installation location.
7. Leave the Consent box checked and click the Next button on the Packet Capture screen.
8. Check the Install USBPcap box on the USB Capture screen, then click the Install button.
9. Allow the installation to go forward. You will see a consent screen for Npcap during the procedure. Click “I Agree.”
10. Check the boxes next to Support raw 802.11 traffic (and monitor mode) for wireless adapters, Restrict Npcap driver access to Administrators Only, and Install Npcap in WinPcap API-compatible Mode on the NPcap Installation Options screen. Select Install.
11. once the Npcap setup is complete. To close that dialog box, click Next, followed by Finish. The installation of Wireshark will proceed.
12. Click Next after the Complete Installation screen before selecting Finish on the following screen.
How to Capture Data Packets using Wireshark
Data packet capture is one of Wireshark’s main network analysis tool features. To perform in-depth network analysis, you must understand how to configure Wireshark to capture packets. It’s crucial to remember that if you’re unfamiliar with Wireshark, it can be challenging to capture packets. There are two things you must perform before you can begin to capture packets:
- Ensure you have administrative rights before beginning a live capture on your device.
- Select the appropriate network interface to use for packet data capture.
After completing these two steps, you are now prepared to begin the capture procedure. When you use Wireshark to capture packets, they are shown to the user in a format that is easy to read. You may also segment packets using filters and color coding to examine more detailed information.
The following launch screen will appear when you initially launch Wireshark:
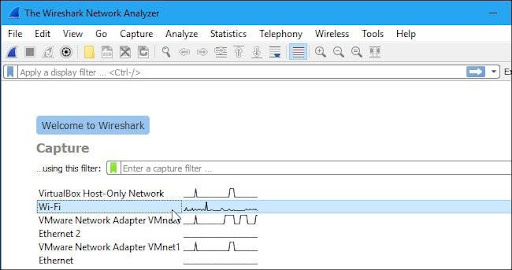
It would help if you start by examining the offered capture interfaces. Select Capture > Options to get started. After that, as seen below, the “Capture Interfaces” dialogue box will appear.
To begin, select the box next to the interface you wish to record, then click the Start button. You can choose different interfaces if you wish to collect data from several sources at once.
The toolbar’s shark fin button can also be used as a shortcut to start packet recording. This button will launch Wireshark and initiate the live capture procedure.
Click the red stop button next to the shark fin to end the capture.
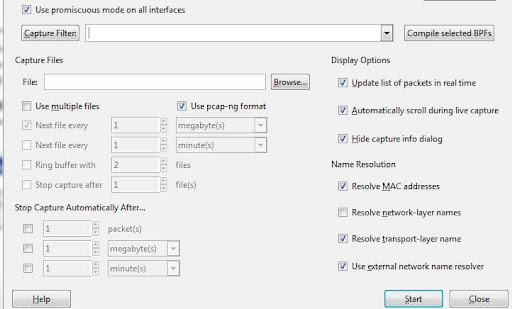
Promiscuous Mode
You must switch to “promiscuous mode” if you want to generate an overhead view of your network packet transfers. In promiscuous mode, Wireshark examines each packet it encounters as it passes across the interface. When this mode is turned off, your network is less transparent, and you only get a restricted snapshot of it (this makes it more difficult to conduct any analysis).
Click on the Capture Options dialogue box, then select Promiscuous Mode to start the promiscuous mode. This should display all of the active traffic on your network, in theory. The below image depicts the promiscuous mode box:
But this frequently isn’t the case. You must visit the Wireshark website to find information about your particular hardware because many network interfaces resist promiscuous mode.
It’s helpful to launch Device Manager on Windows and verify that your settings are set to disallow promiscuous mode.
The promiscuous mode will be rejected if your settings are set to “reject,” reducing the number of packets Wireshark may collect. Check your Device Manager to make sure that your interface isn’t preventing any data from passing through, even if promiscuous mode is active in Wireshark. By looking through your network architecture, you can make sure Wireshark gets all the data packets it needs.
How to Analyze Captured Packets in Wireshark
It would help to examine your collected packets after collecting your network data. Three panes—the packet list pane, the packet bytes pane, and the packet details pane—can be seen in the screenshot below.
Any field in each packet can be clicked to get more details. The byte view section displays a breakdown of a packet’s internal bytes when you click on it.
Packet List
At the top of the screenshot is the packet list window. Each component has a number and information about the time, source, destination, protocol, and backing.
Packet Details
The middle contains packet information, which displays the chosen packet’s protocols. Each segment can be made larger by clicking the arrow next to the row you want to expand. You may easily add other filters by selecting the item with the right click.
Packet Bytes
The page’s footer displays the packet bytes pane. The internal data of the packet you picked is displayed in this window. When you select a portion of the data in this section and highlight it, the packet details pane also highlights the information that goes with it. By default, the hexadecimal format is used to display all data. Right-click the pane and choose this choice from the context menu to convert it to bit format.
How to Analyze Network Performance Using Wireshark
Close any running applications on your network before using Wireshark to examine your network and examine all live traffic. This will significantly lessen traffic, allowing you to see your network’s activity. However, even if you disable every application, you’ll still send and receive several packets.
The best way to analyze your network data is to filter these packets using Wireshark. Thousands of packets are moving through your network per second when your connection is active. To gain a clear picture of what’s happening, you must weed out the information you don’t need.
Capture Filters and Display Filters
Two filters can be applied on Wireshark: Capture Filters and Display Filters.
Two filters can be applied on Wireshark: Capture Filters and Display Filters. By essentially filtering out other packets during live packet capturing, capture filters are used to minimize the size of incoming packet capture. Therefore, before you start the live capture procedure, capture filters are configured.
By essentially filtering out other packets during live packet capturing, capture filters are used to minimize the size of incoming packet capture. Therefore, before you start the live capture procedure, capture filters are configured.
Once a capture has begun, Capture Filters cannot be changed. On the other hand, data that has already been recorded can be filtered using display filters. While viewing previously captured packets, Acquire Filters control what data you see, and Display Filters control what data you capture from real-time network monitoring.
Using the filter box beneath the toolbar is one of the simplest ways to begin filtering your data. You will be given a list of all HTTP packets recorded, for instance, if you type HTTP into the filter box. When you begin typing, an autocomplete field will appear.
Once you begin capturing live network traffic, your changes will take effect if you decide to create a capture filter. Simply click the arrow to the right of the entry area to activate a display filter. Alternatively, you can select a filter from the list of defaults by selecting Analyze > Display Filters.
After selecting a filter, you can see the TCP discussion hidden behind a packet. Click Follow > TCP stream in the right-click menu of the packet to accomplish this. This will display the client and server’s TCP communication.
Using Color Coding in Wireshark
The Wireshark color-coding feature not only filters which packets are displayed or captured but also makes it simpler for the user to distinguish between various packet kinds based on their color. For instance, light purple and light blue indicate TCP and UDP traffic, respectively. The usage of black to denote packets containing mistakes must be noted.
In Wireshark’s default settings, you have a selection of about 20 colors. These can be modified, turned off, or removed. To disable colorization, go to the View menu and select the Colorize Packet List field option. Click View >Coloring Rules to view additional details about Wireshark’s color-coding system.
Viewing Network Statistics in Wireshark
The statistics drop-down option is immensely helpful for viewing more details about your network. The statistics menu, located at the top of the screen, provides several metrics, including size and time data and plotted charts and graphs. You can also apply display filters to these statistics to focus on key information.
Network Packet Visualization Using IO Graphs
Open IO graphs are required if you wish to build a visual representation of your data packets. Pick IO graphs from the statistics menu by clicking on them.
You can configure IO graphs using your settings depending on the data you wish to present. By default, only graph 1 is active; to enable graphs 2 through 5, you must click on them. Similarly, to apply a display filter to a graph, click the filter icon next to the desired graph. You can modify the structure of your graph using the style column. Line, bar, Dot, or Impulse are your options.
You may also play about with the X and Y axis measurements on your graph. The tick interval parts on the X-axis let you choose the interval length, from minutes to seconds. To change the time displayed on the X-axis, you can also select the view as a time of day checkbox.
You can select the following options for the unit of measurement under the Y-axis section: Packets/Tick, Bytes/Tick, Bits/Tick, or Advanced. The scale lets you select the measurement scale for the graph’s Y-axis.
The graph is then saved in the file format you choose after selecting the “Save” button.
How to Use Wireshark’s Sample Captures
Using “sample captures” is an excellent alternative if you want to practice using Wireshark, but your network is inaccessible for any reason. Sample captures provide you access to packet data from another network.
Conclusion
This finishes our explanation of Wireshark’s usage. This platform is a very flexible network analysis tool, regardless of whether you are a beginner or an experienced Wireshark user. It is strongly advised that you conduct more research on the Wireshark website if you want to make the most of this program.
This is even more crucial if you want to employ more sophisticated features and build your own protocol dissectors. The official Wireshark user manual is the most thorough source of information on the subject.