Top Linux GPU monitoring and Diagnostic Tools
Introduction
The components shown on a computer monitor are controlled by a specialized circuit board known as a video card. It is also known as a graphics processing unit or GPU and is responsible for calculating 3D visuals and pictures for use in Linux gaming and other applications. Let’s have a look at the best Linux command-line tools for GPU monitoring and diagnostics so we can fix this problem.
There is a possibility that a graphical processing unit (GPU), often called a video or graphics card, could be present on a Linux machine. Active graphics card monitoring and control can be necessary for various contexts, including mining cryptocurrencies, operating gaming servers, or improving the user experience on a desktop computer.
GPU monitoring and Diagnostic Tools
lshw -C display -short
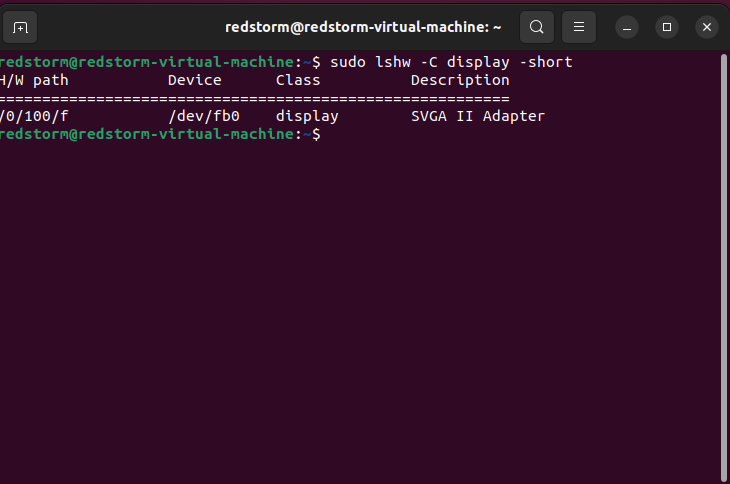
Lshw is a piece of software that is both open source and free, and it is a utility that offers in-depth information about the computer’s hardware configuration. The supported operating systems are Linux, Microsoft Windows, and Apple’s macOS. Lshw is a program that may be utilized to determine the components of a computer’s Hardware, as well as obtain specific information regarding the configuration of the Hardware. Lshw can also be used to generate a report that can be utilized for diagnosing and fixing problems with the system.
Downloading the lshw package from the project website is the first step toward installing lshw on a Linux operating system. The source code and a binary version of the package can be obtained. To install the binary package, you need rights equivalent to the root users.
Install Lshw
Install Lshw In Ubuntu:
sudo apt-get install lshwInstall Lshw in CentOS:
yum install lshw -yAfter the installation has been finished, you will be able to retrieve information regarding the hardware setup of your computer by using the lshw command.
We can now use the lshw command on our Terminal after installation:
sudo lshw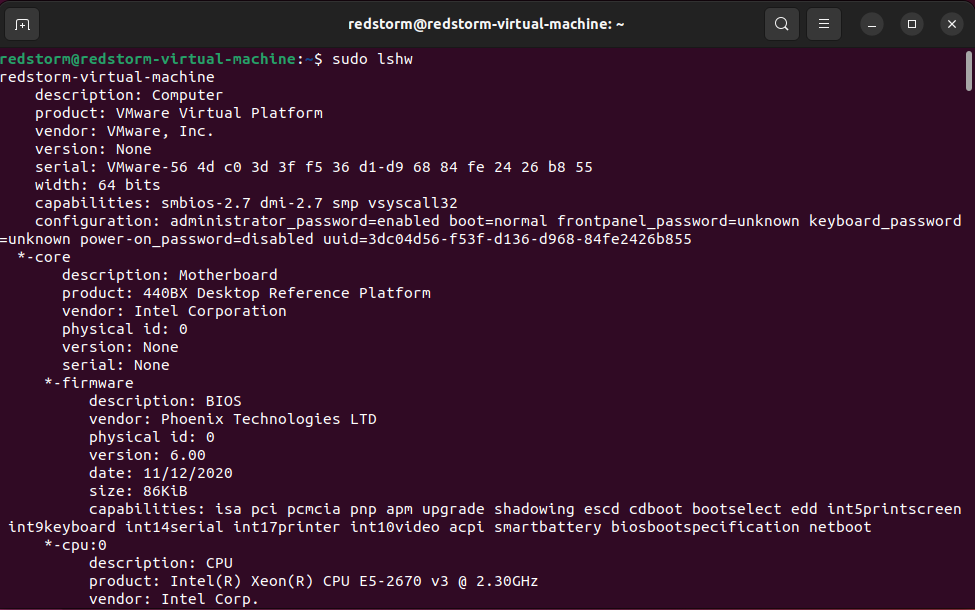
However, because the output is large, we will utilize the -short option
lshw -short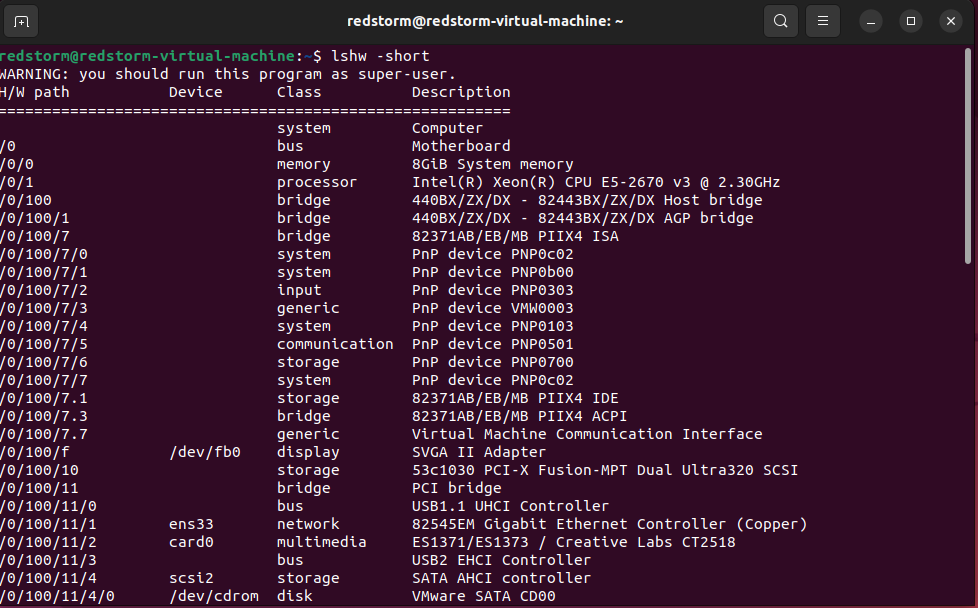
To see only a certain class of Hardware, use the -class option.
lshw -class CPUTo obtain GPU information:
sudo lshw -C display -shortlspci -v | moreglmark2
The X11 benchmark for OpenGL 2.0 can be found in this package. An OpenGL (ES) 2.0 benchmark solely uses OpenGL ES 2.0 compliant APIs. It includes tests for aspects of OpenGL (ES) 2.0 that are considered standard, including vertex arrays, VBOs, texturing, and shaders.
The X11 benchmark for OpenGL 2.0 can be found in this package.
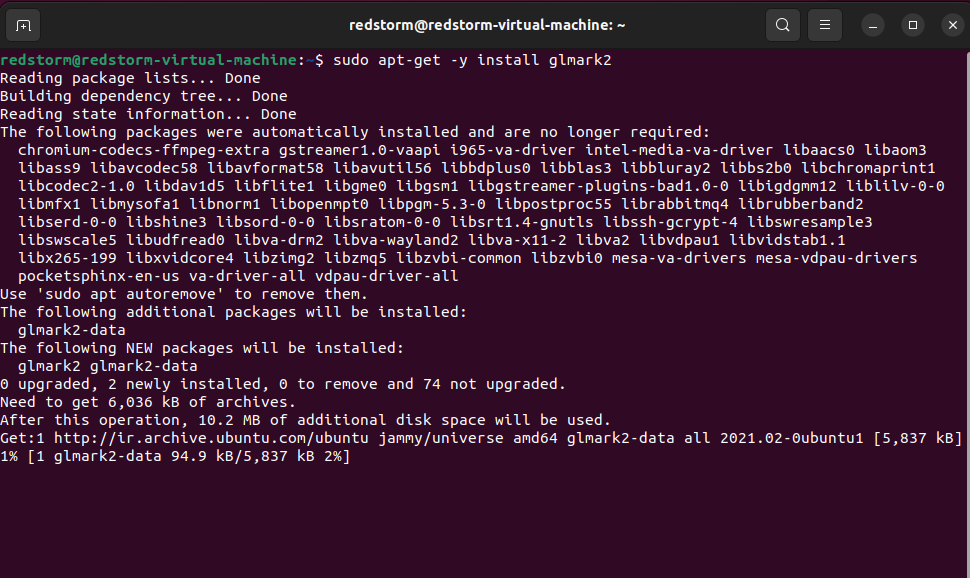
Install glmark2 on Ubuntu:
sudo apt-get -y install glmark2
Run the default benchmarks by typing:
glmark2glxgears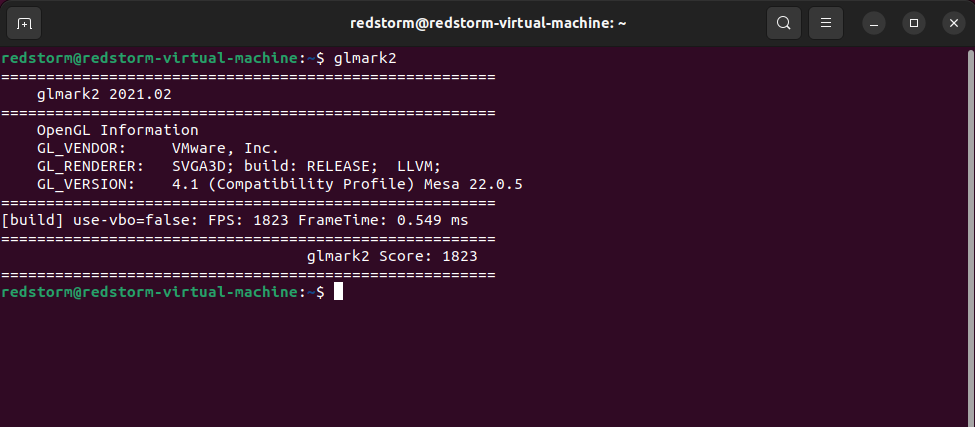
GNU/Linux releases include the modest and uncomplicated MESA OpenGL demonstration software glxgears. Although it belongs to Mesa-Demos, it is installed by default because it comes with the Glx-Utils package (unlike other mesa-demo programs like glxheads, shape, offset, etc.).
Type:
glxgearsDisplay: Indicate the X display on which to run.
Info: Show information about the OpenGL renderer.
Fullscreen: Use the fullscreen setting.
Gpustat
It is created in Python and is the ideal CLI tool, especially for ML/AI engineers. The following installation instructions for PIP
NOTE: At this time, only NVIDIA Graphics Devices are supported.
Install Gpustat on Ubuntu:
sudo apt-get -y install gpustat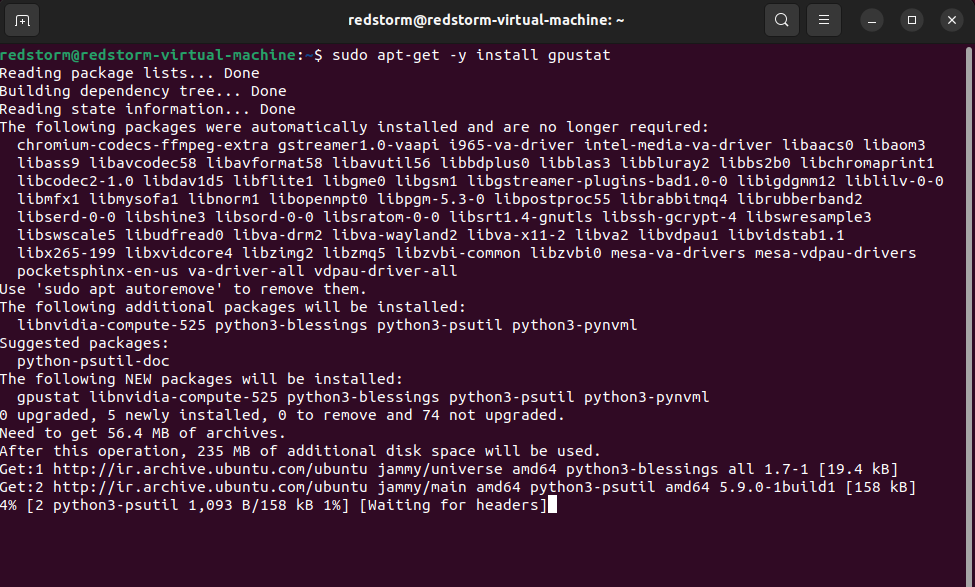
Install using PIP:
pip install gpustatpip3 install gpustatUsage:
gpustatgpustat -cpintel_gpu_top
The tool intel GPU top shows usage data for Intel GPUs.
The program uses platform drivers like RAPL (power) and Uncore IMC, as well as perf performance counters (PMU) exposed by i915, to collect statistics (memory bandwidth).
Install intel_gpu_top on Ubuntu:
sudo apt install intel-gpu-tools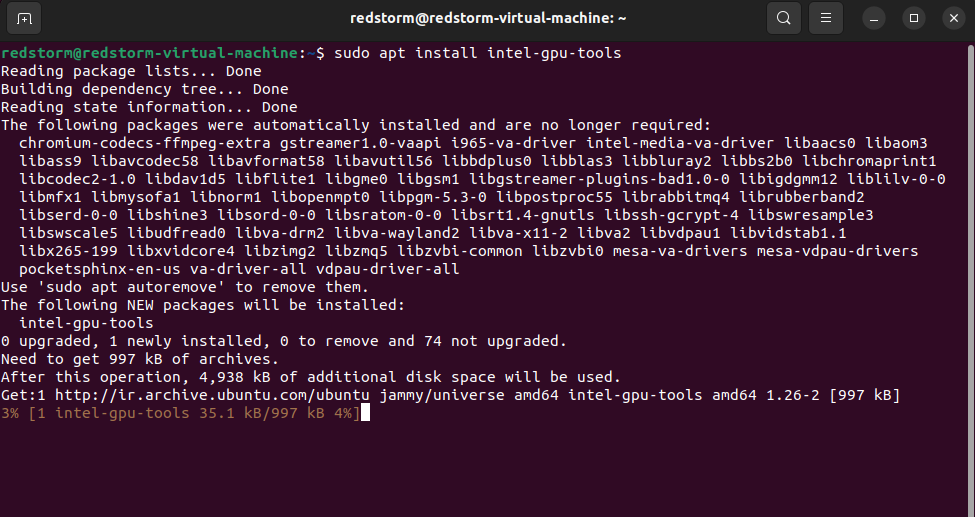
Install intel_gpu_top on CentOS/RHEL/Fedora Linux
sudo dnf install intel-gpu-toolsThe command line Arguments:
OPTIONS
-h Display help text.
-J Output JSON formatted data.
-l List plain text data.
-o <filepath|->
Instead of using normal output, output to the designated file. Standard output can also be chosen explicitly by using the prefix "-".
-s <ms>
The time between updates in milliseconds.
-L Show available GPUs on the platform.
-d Using the supported filter, pick a certain GPU.
nvidia-smi
For NVIDIA’s Tesla, Quadro, and GRID devices from the Fermi and higher architecture families, nvidia-smi (also known as NVSMI) offers monitoring and administration features. Additionally, very few details are offered for Geforce devices. NVSMI is a cross-platform application that works with all Linux distributions typically supported by NVIDIA drivers and 64-bit Windows versions beginning with Windows Server 2008 R2. Users can access metrics directly through stdout, or metrics can be delivered as files in CSV and XML formats for scripting reasons.
It should be noted that the underlying NVML C-based library provides most of the functionality of NVSMI. For additional details about NVML, see the developer website for NVIDIA at the link provided below.
There are also NVML-based Python bindings available.
There is no guarantee that the NVSMI’s output will work with older devices. On the other hand, the Python bindings and NVML are backward compatible and ought to be used first when creating any tools that must be maintained between NVIDIA driver updates.
Install nvidia-smi on Ubuntu
sudo apt purge nvidia-*
sudo add-apt-repository ppa:graphics-drivers/ppa
sudo apt update
sudo apt install nvidia-381
nvidia-smi Usage:
nvidia-smi [OPTION1 [ARG1]] [OPTION2 [ARG2]] ...options:
GENERAL OPTIONS
-h, --help
Print usage information
SUMMARY OPTIONS
-L, --list-gpus
List all of the system’s NVIDIA GPUs along with their UUIDs.
-d TYPE, --display=TYPESpecify only the information below: Memory, utilization, energy conservation code, temperature, power, clock, computer, pids, performance, supported clocks, page retirement, and accounting Flags can be separated by commas, as in “MEMORY,ECC.” The display types for POWER, UTILIZATION, and CLOCK now include sampling data with maximum, minimum, and average values. using the -u/—unit or -x/—xml-format options fails.
-l SEC, --loop=SECReport query data more than once, as opposed to just once, as is the default, at the selected interval. The software will fall asleep in between requests. It should be noted that in Linux if the -x flag is not supplied, ECC error or XID error events will print out during the sleep period.By using Ctrl+C, the loop can be terminated at any time; otherwise, it will run indefinitely.
If no argument is provided, the default interval for the -l form is 5 seconds.
[one of]
--query-gpu=
details relating to GPU. Pass a list of the properties you want to query, separated by commas. For instance, —query-gpu=pci.bus id, persistence mode. For additional information, dial —help-query-gpu.
--query-supported-clocks=The list of supported clocks. For additional information, dial —help-query-supported-clocks.
--query-compute-apps=A list of computing processes that are now running. For further information, use —help-query-compute-apps.
--query-accounted-apps=list of computer operations with accounting. For additional information, dial —help-query-accounted-apps.
--query-retired-pages=A list of the memory pages on the GPU device that have been decommissioned. For additional information, dial —help-query-retired-pages.