Uptime
Monitoring
Ensure your websites and services are reachable 24/7 from 15+ global probing nodes. Multi-protocol support with intervals as low as 1 minute.
Social Proof
Trusted by thousands — rated on
See what real users say about Xitoring on the world's top review platforms.
What is uptime monitoring?
Uptime monitoring is the practice of continuously checking whether a website, API, or network service is reachable and responding correctly from real user locations. An uptime monitor sends synthetic requests — HTTP/S, DNS, TCP, UDP, ICMP ping, FTP, SMTP, IMAP, or POP3 — at fixed intervals from globally distributed probing nodes, then alerts the on-call team when a check fails or response latency crosses a threshold. The uptime metric, expressed as a percentage of successful checks, is the primary input for service-level objectives and customer-facing status pages.
Industry-standard uptime monitoring runs at one-minute intervals from at least three geographic regions to distinguish real outages from local network blips. Reaching 99.99% annual uptime allows under 53 minutes of downtime per year; 99.999% allows just over five minutes. Effective uptime monitoring goes beyond simple ping checks to validate that responses contain expected content, complete within acceptable latency, and present valid TLS certificates — catching the partial outages and degraded states that simple availability checks miss.
Key Features
Everything you need for Uptime Monitoring.
Multi-Protocol Checks
Monitor HTTP(S), Ping (ICMP), DNS, FTP, TCP, UDP, and mail servers (SMTP, IMAP, POP3) from a single dashboard.
15+ Global Nodes
Distributed probing from North America, Europe, Asia, and more. Detect regional outages before your users do.
1-Minute Intervals
Near-instant failure detection with check intervals as low as 1 minute.
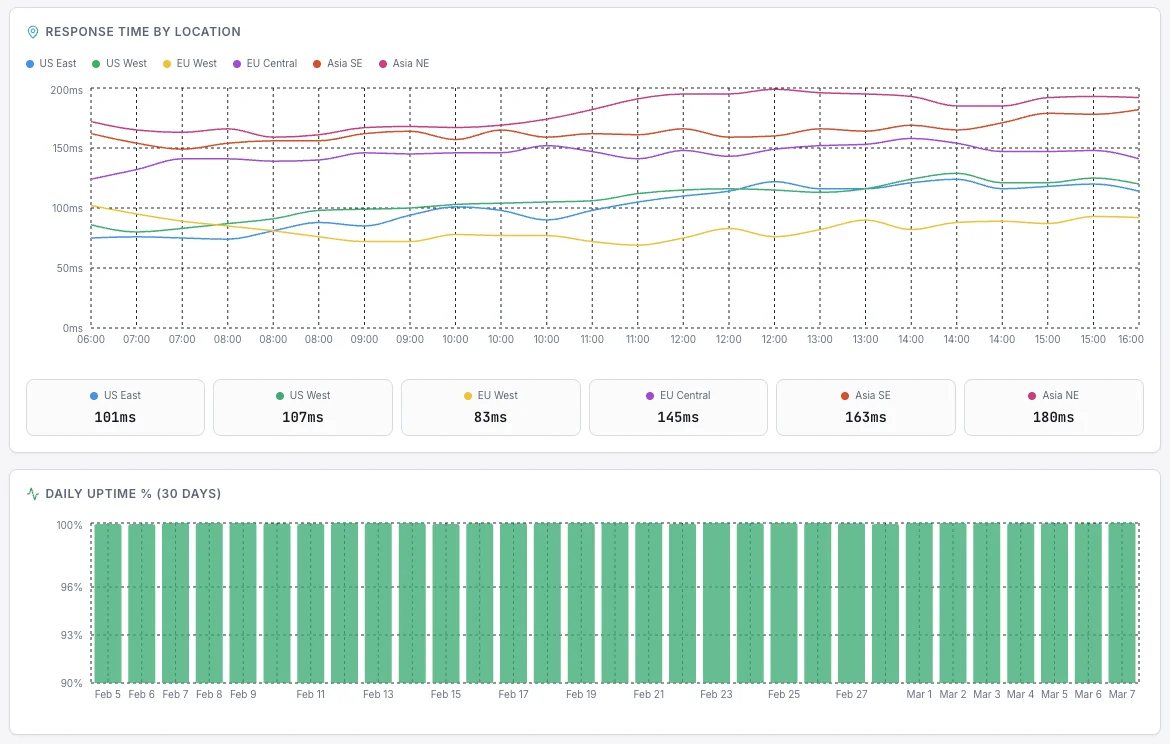
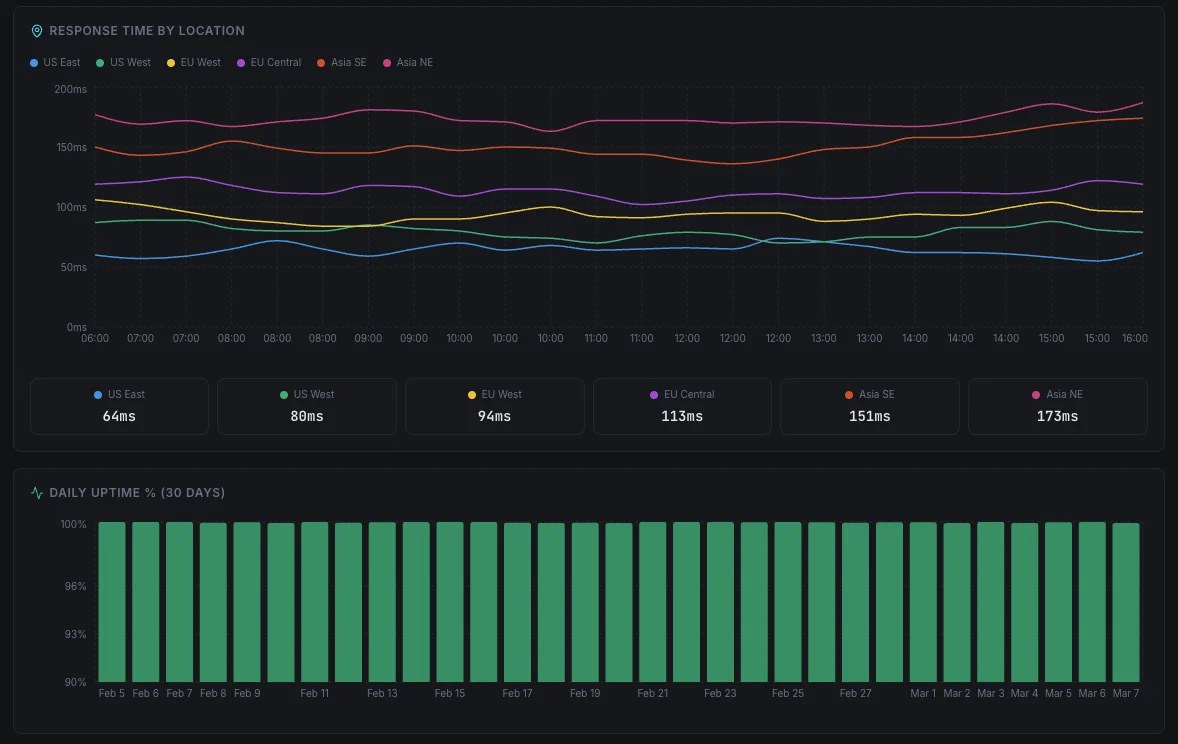
Response Time Tracking
Track response times over days, weeks, and months. Identify performance degradation trends early.
Smart Alert Triggers
Configure confirmation thresholds to eliminate false positives. Only get alerted on real downtime events.
Custom TCP/UDP Ports
Monitor any custom service port for responsiveness — not just standard web and mail ports.
Powerful Uptime Check Features
Everything you need to monitor, manage, and respond to uptime incidents at scale.
Group Management
Organize with ease
Create and manage groups of uptime checks to keep your infrastructure structured and scalable.
Create HTTP with cURL
From CLI to dashboard
Easily paste a cURL command to generate a new HTTP check without manual setup.
Incident Policy
Stay in control
Define automated incident response rules to ensure the right team gets notified instantly.
1 Minute Interval
Faster detection
Get notified of issues in as little as 60 seconds for near real-time awareness.
Incident Timeline Notes
Add context
Write notes directly into the incident timeline to keep the whole team aligned.
Bulk Actions
Save time at scale
Create, delete, or update multiple uptime checks in one go.
HTTP Advanced Mode
More power, more flexibility
Configure advanced HTTP checks with headers, authentication, and custom rules.
Root Cause of Incident
No guesswork
Get detailed insights into what caused the downtime to speed up recovery and prevention.
Supported Uptime Checks
Add Uptime monitoring checks within seconds!
Xitoring's free plan includes 8 checks at no cost, you can easily create any type of check you desire within seconds. They're easily configurable, you can assign your desired notification roles to each check. There are too many features included within Uptime monitoring including different notifications, fault tolerance, repeated incidents, etc.
Uptime Overview
Everything about your infrastructure health — visible at a single glance.
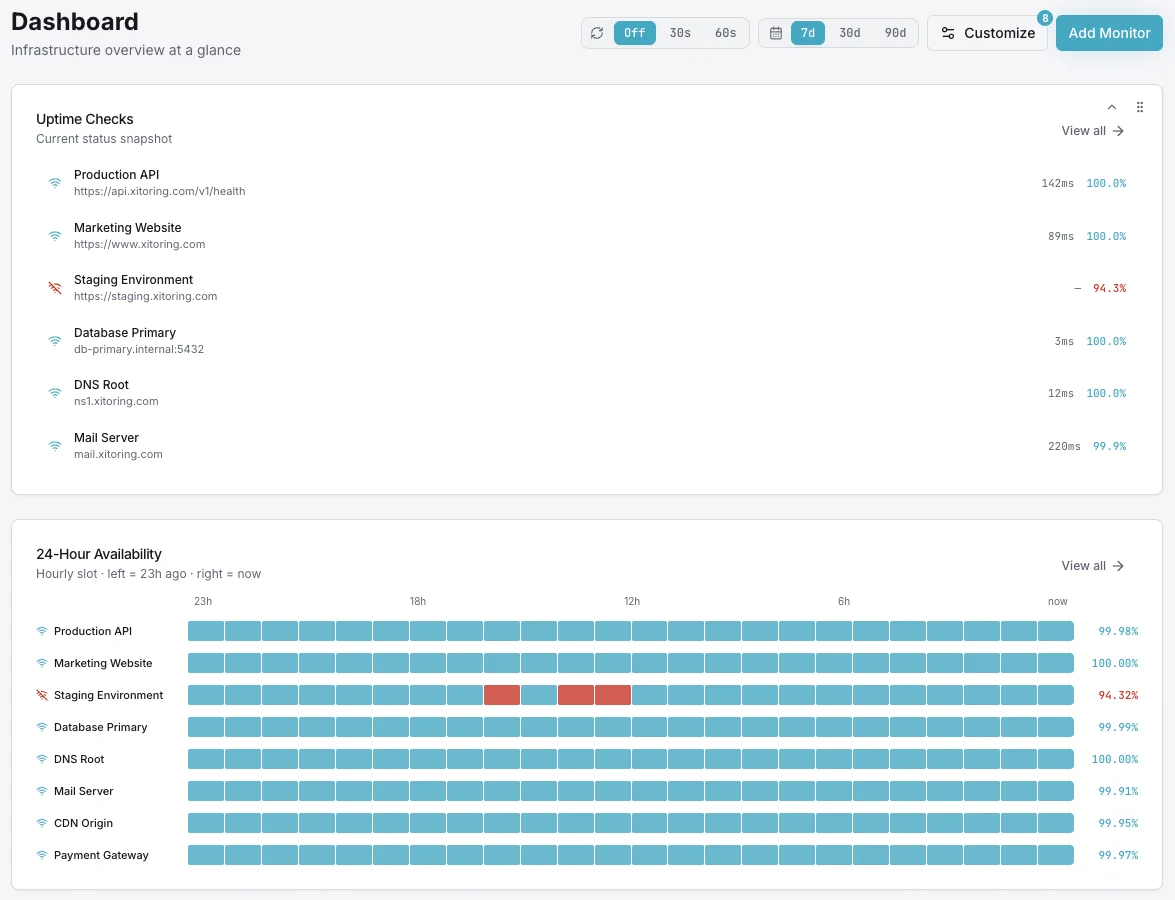
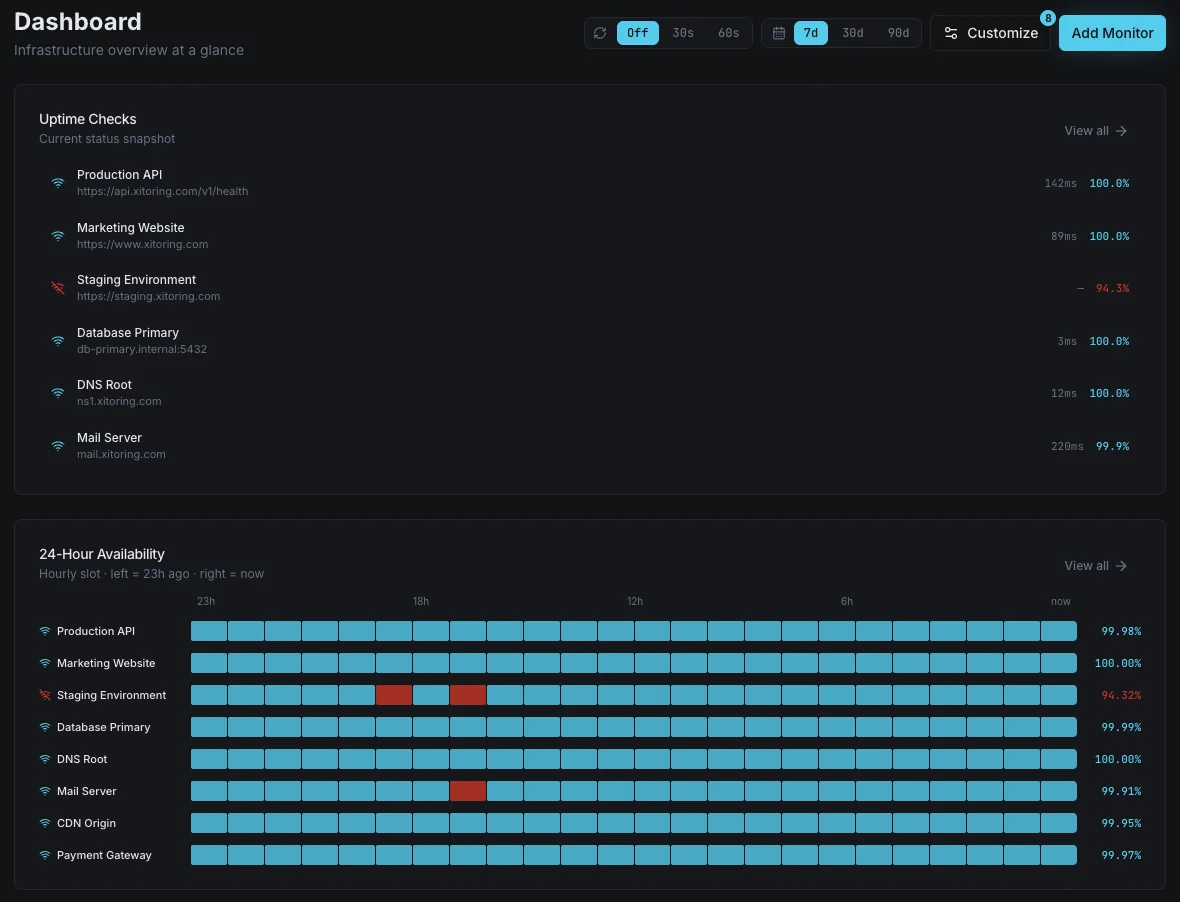
All Servers in a Glance
The most detail you can ever seen in a window. All of your checks, nested under groups, and historical uptime statistics for each of them is shown here!
Live Statistics
Watch your checks live in a big screen, as soon as a checks hiccups, you will notice.
Group Management
Checks can be nested under groups and sub-groups, you can easily set them as country and city, or datacenter and city!
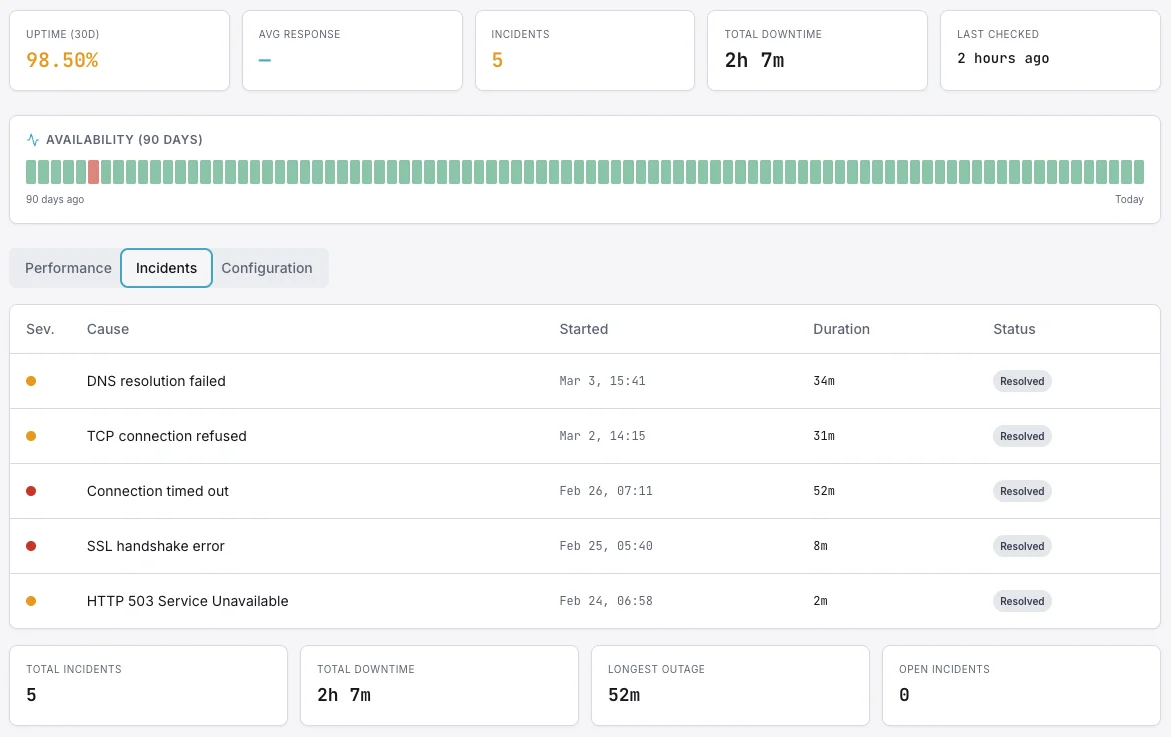
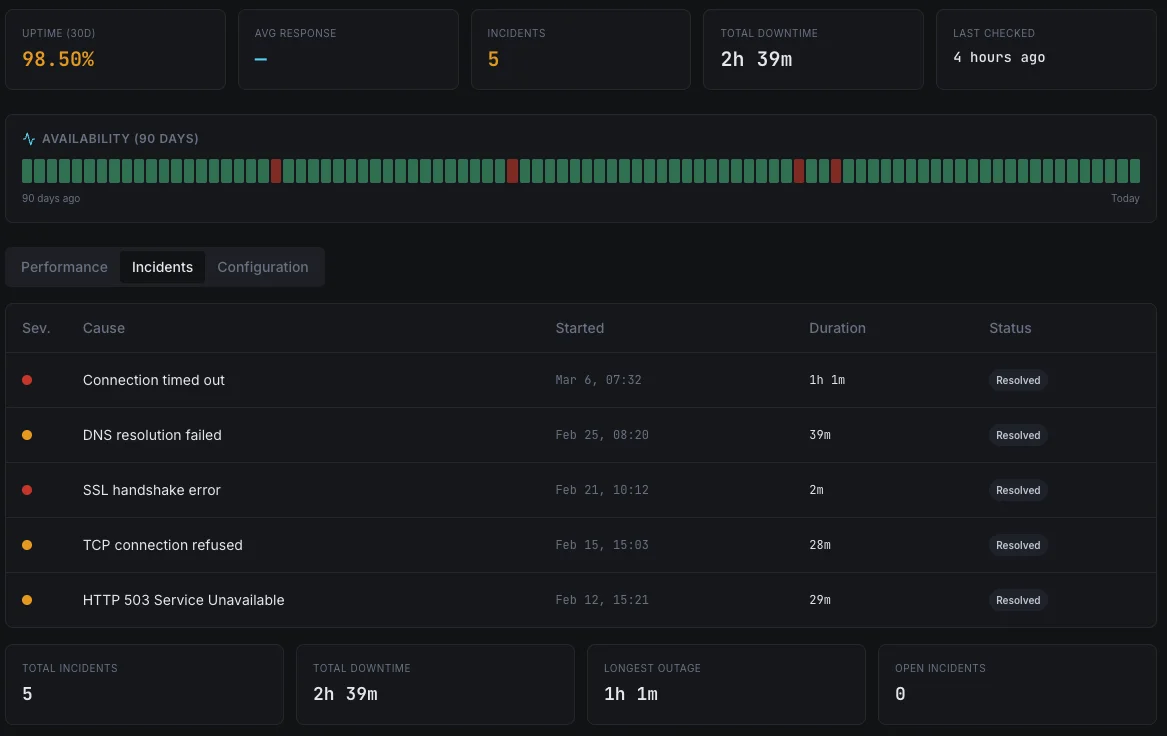
Checks Status
It's very easy to see which day, which check, had how many and how much interruption.
Who it's for
Uptime Monitoring Use Cases
See how teams across industries use Xitoring to keep their infrastructure reliable.
E-Commerce Stores
Monitor product pages, checkout flows, and payment gateways. Catch downtime before lost sales pile up during peak traffic.
SaaS Applications
Track your app's login page, API endpoints, and dashboard availability. Meet SLA commitments with real uptime data.
Education Platforms
Ensure LMS portals, video streaming servers, and student registration systems stay accessible during enrollment periods.
Government & Finance
Monitor citizen-facing portals, banking dashboards, and compliance systems with multi-node verification and audit trails.
Healthcare Portals
Keep patient portals, appointment booking systems, and telehealth platforms always reachable for critical care access.
Hosting & MSPs
Monitor client websites and services across your hosting fleet. Prove SLA compliance with automated uptime reports.
Why Uptime Monitoring Matters
Every minute of downtime costs revenue, erodes customer trust, and damages your brand. Without proactive monitoring, you're relying on your users to tell you something is broken — and by then, it's too late.
- Downtime costs SMBs an average of $427/minute
- Detect outages before customers notice
- Multi-location checks eliminate false positives
- Historical data for SLA compliance reporting
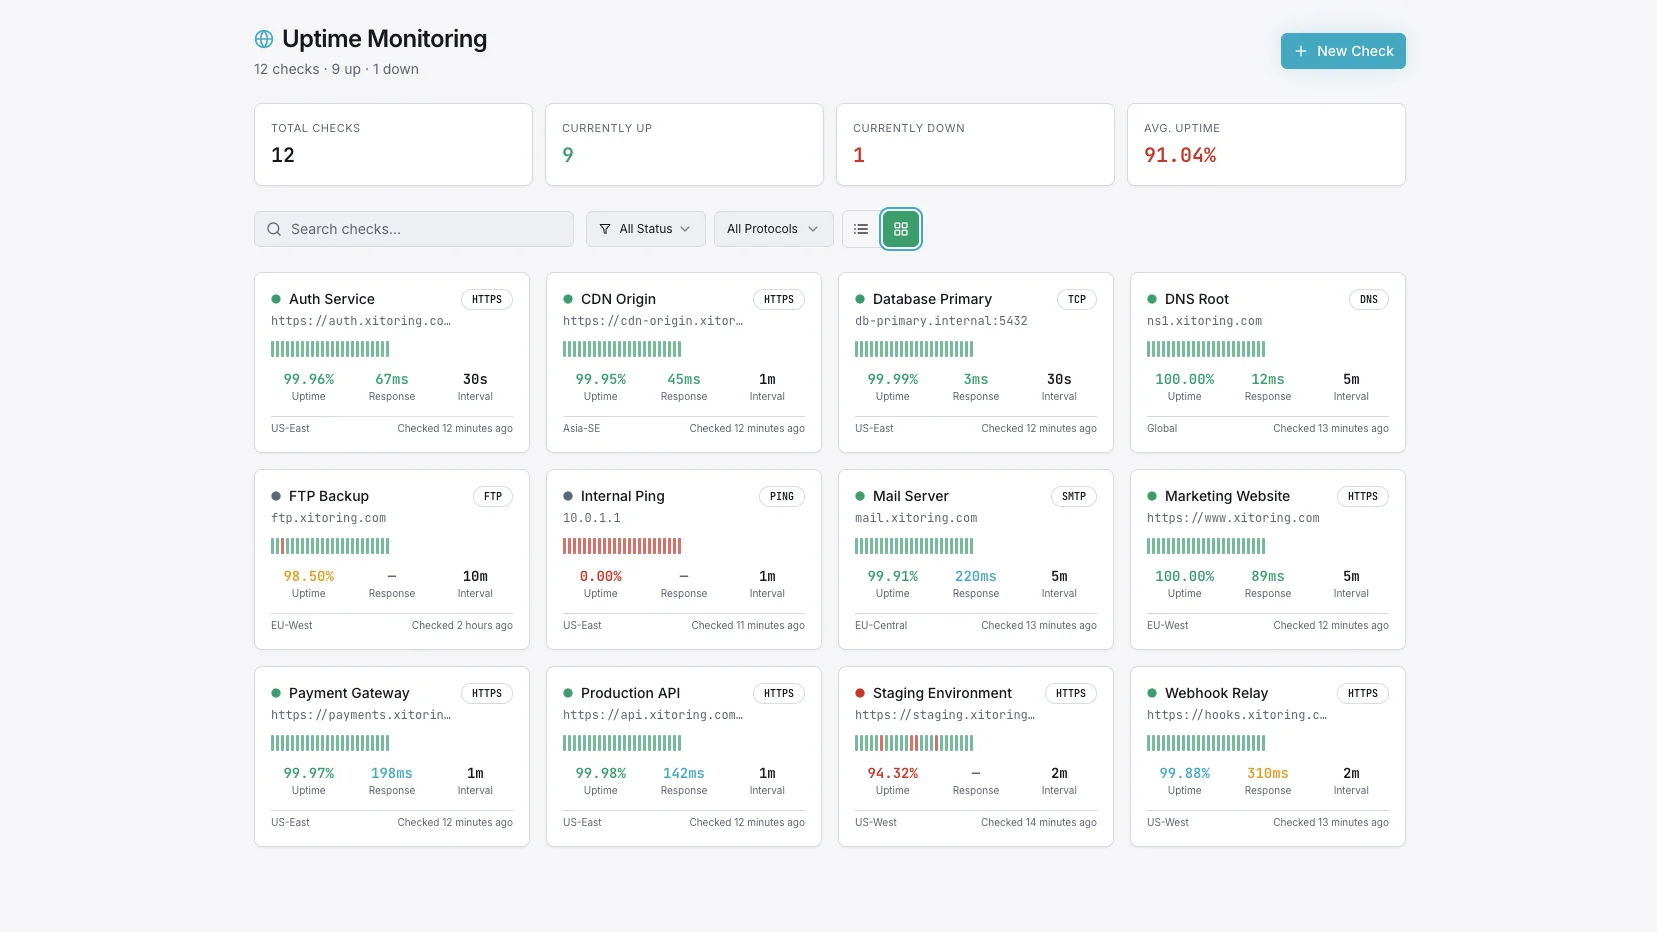
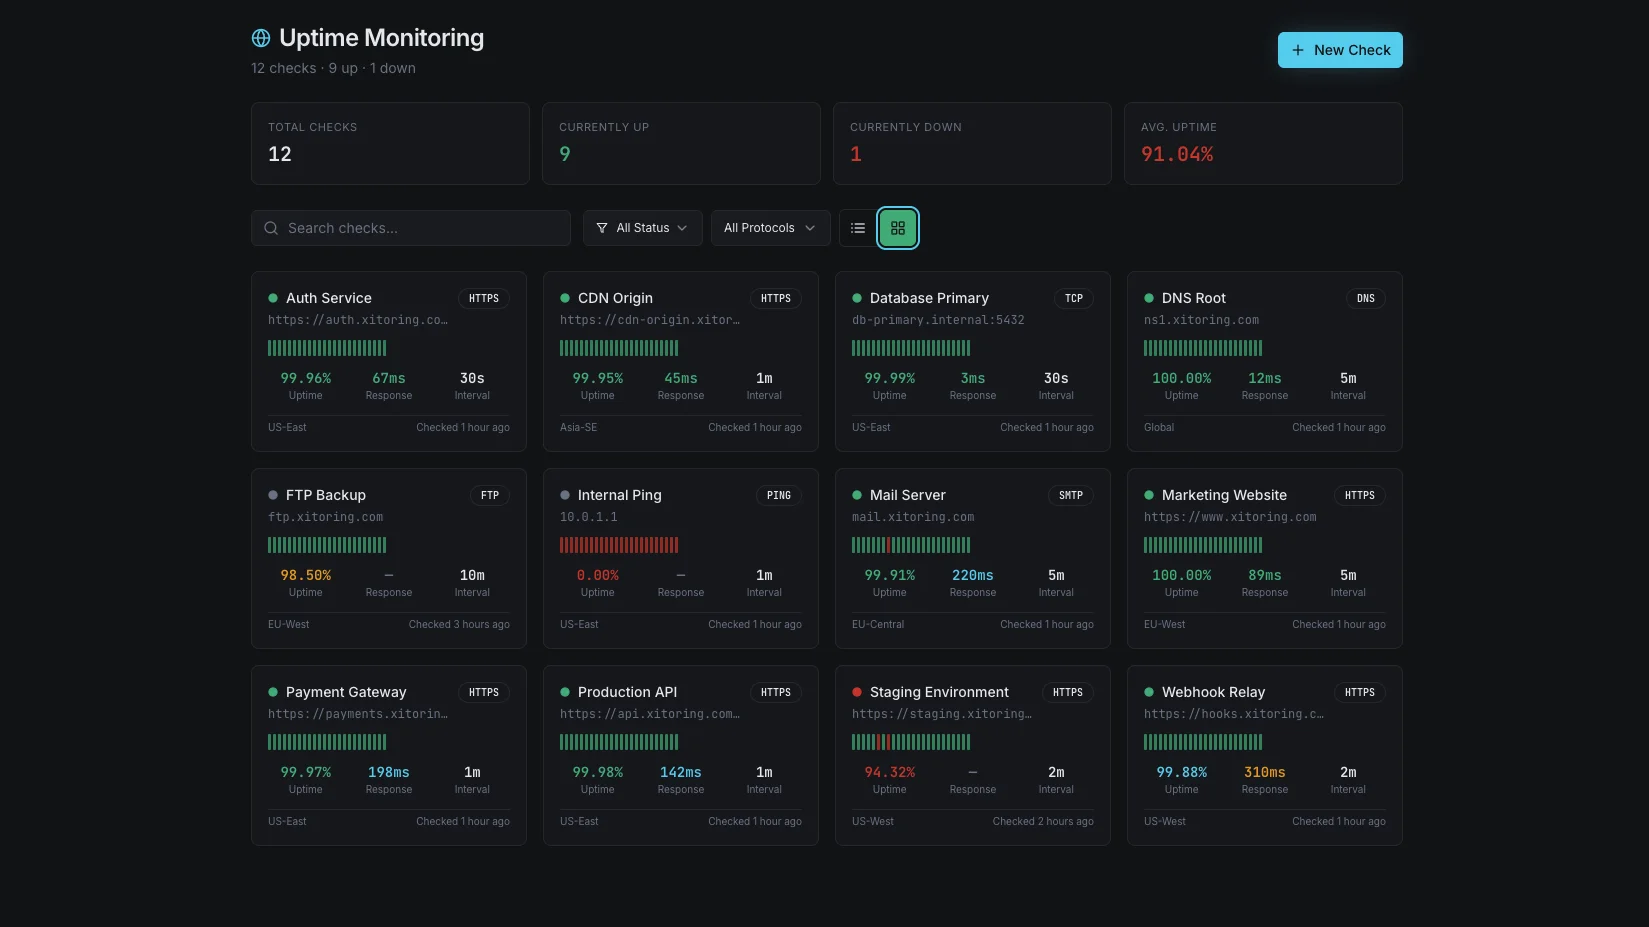
Xitoring's Uptime Dashboard
A global command center for all your monitors. See real-time status from 15+ worldwide nodes, track response time trends, and drill into any incident — all from a single, unified view.
- Global map with live monitoring node status
- 99.98% uptime SLA with response time charts
- Multi-protocol status at a glance
- One-click incident drill-down with root cause analysis
Additional Capabilities
Maintenance Windows
Schedule planned downtime to prevent false alerts during updates and deployments.
Root Cause Analysis
Get plain-English incident reports that explain why a service went down — not just that it did.
One-Click Migration
Import your existing monitors from Pingdom, Uptime.com, or BetterStack with a single click.
Frequently asked questions
Common questions about Uptime Monitoring.
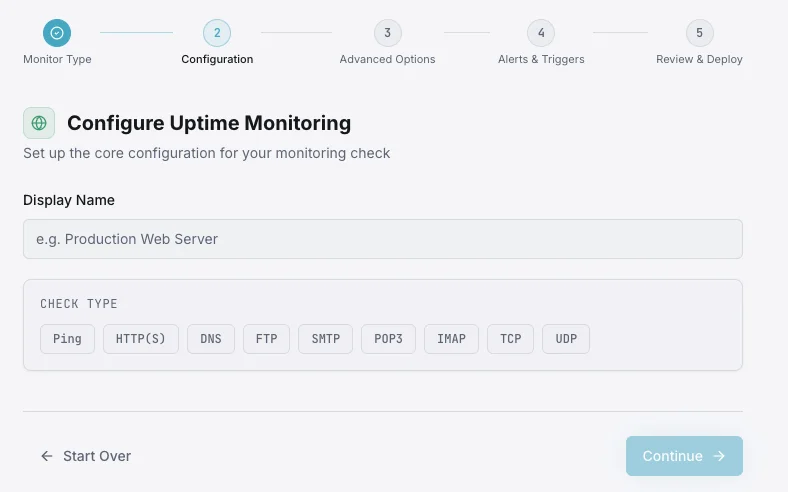
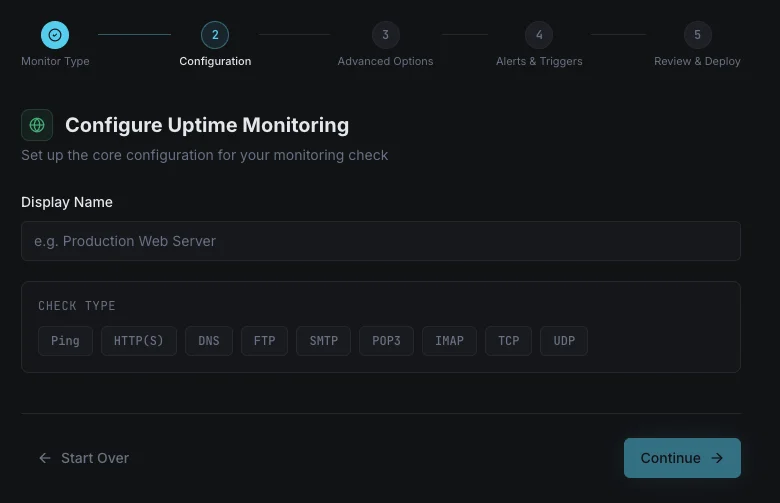
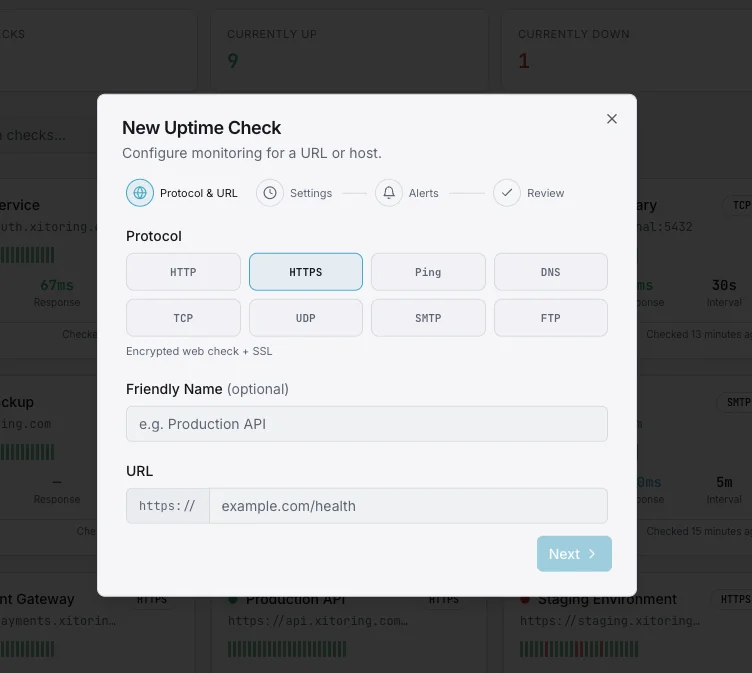
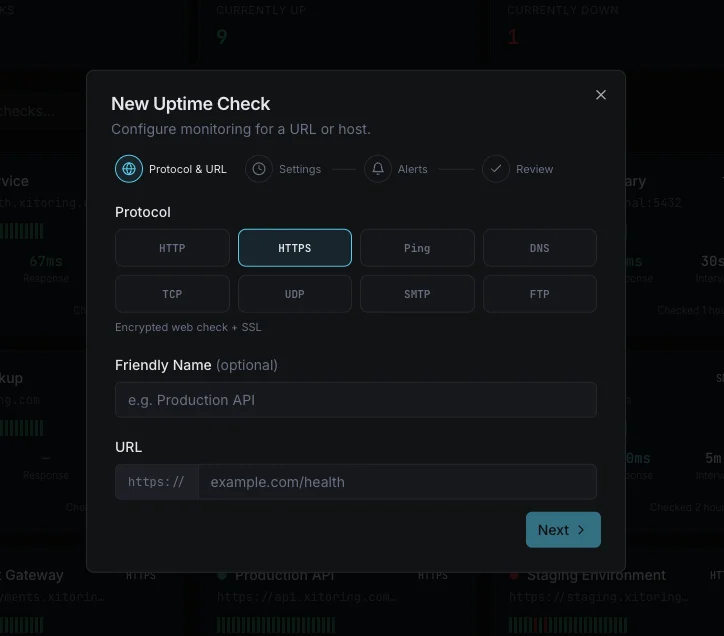
Add Your URL, We Monitor the Rest
Enter your website or service URL and Xitoring starts monitoring from 15+ global nodes instantly. Choose your protocol, set your interval, and get alerted quickly — no agent required.
Start Free Trial