PostgreSQL Suivi
Surveillez en temps réel les transactions, les connexions, la réplication et les performances de l'opération VACUUM de PostgreSQL, sans aucune configuration.
Pourquoi surveiller ? PostgreSQL?
PostgreSQL est la base de données relationnelle open source la plus avancée au monde, à laquelle on fait confiance pour les charges de travail critiques, des systèmes financiers aux applications géospatiales. La surveillance de PostgreSQL est essentielle pour détecter les requêtes de longue durée, éviter la saturation des connexions, suivre l'état de la réplication et optimiser les opérations de vacuum. L'intégration PostgreSQL de Xitoring offre une observabilité complète de la base de données.
La surveillance de PostgreSQL, expliquée
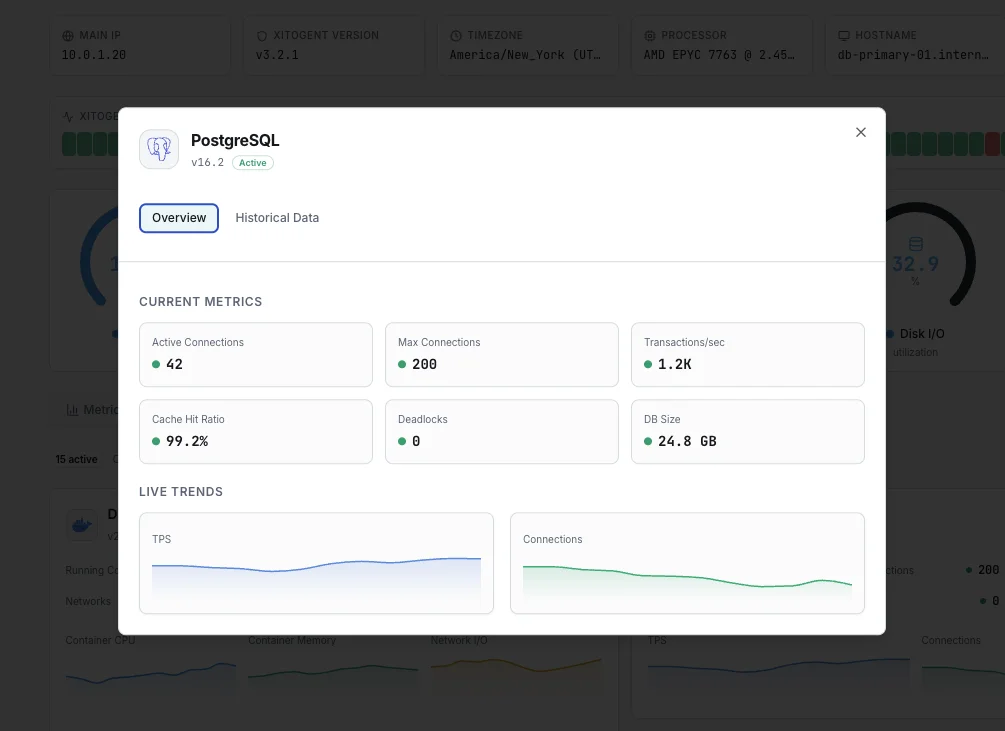
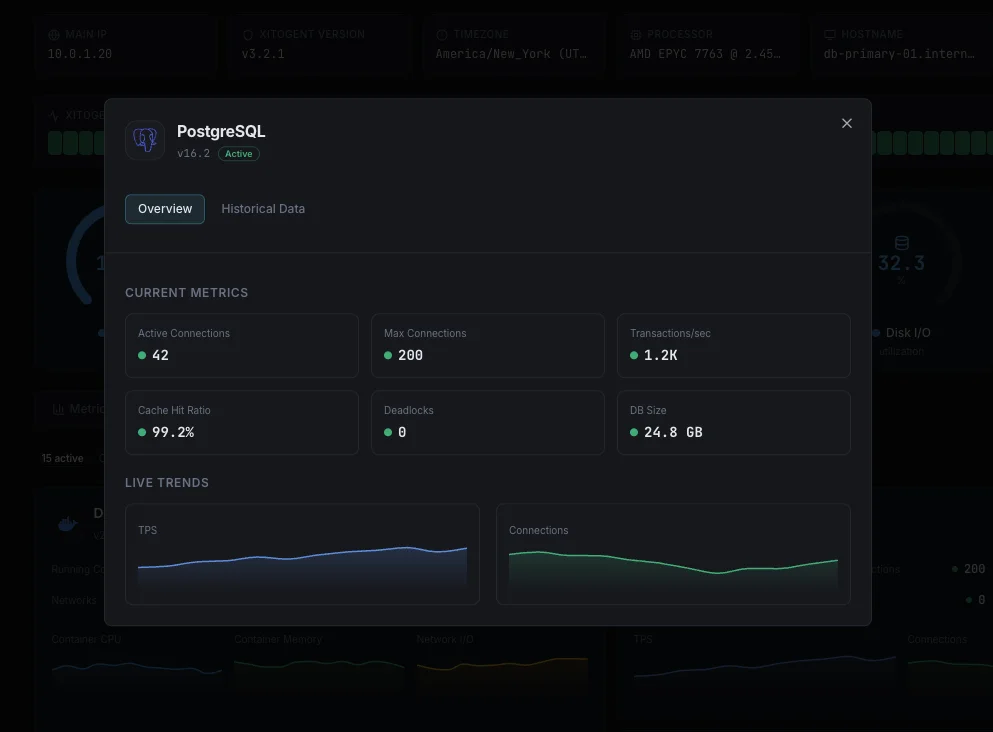
La surveillance de PostgreSQL détecte la dérive de réplication, l'autovacuum emballé, les tables gonflées et les sessions idle-in-transaction avant qu'elles ne se transforment en pannes ou en corruption de données. Pour toute charge de travail Postgres — RDS, Aurora, CloudNativePG, clusters Patroni auto-hébergés — la visibilité par base de données est la différence entre détecter une fuite de connexion en 60 secondes et l'apprendre par un ticket client. Xitoring détecte automatiquement votre Postgres, interroge les vues natives pg_stat_* avec le rôle pg_monitor, et achemine les alertes vers Slack, PagerDuty, Telegram ou votre astreinte existante.
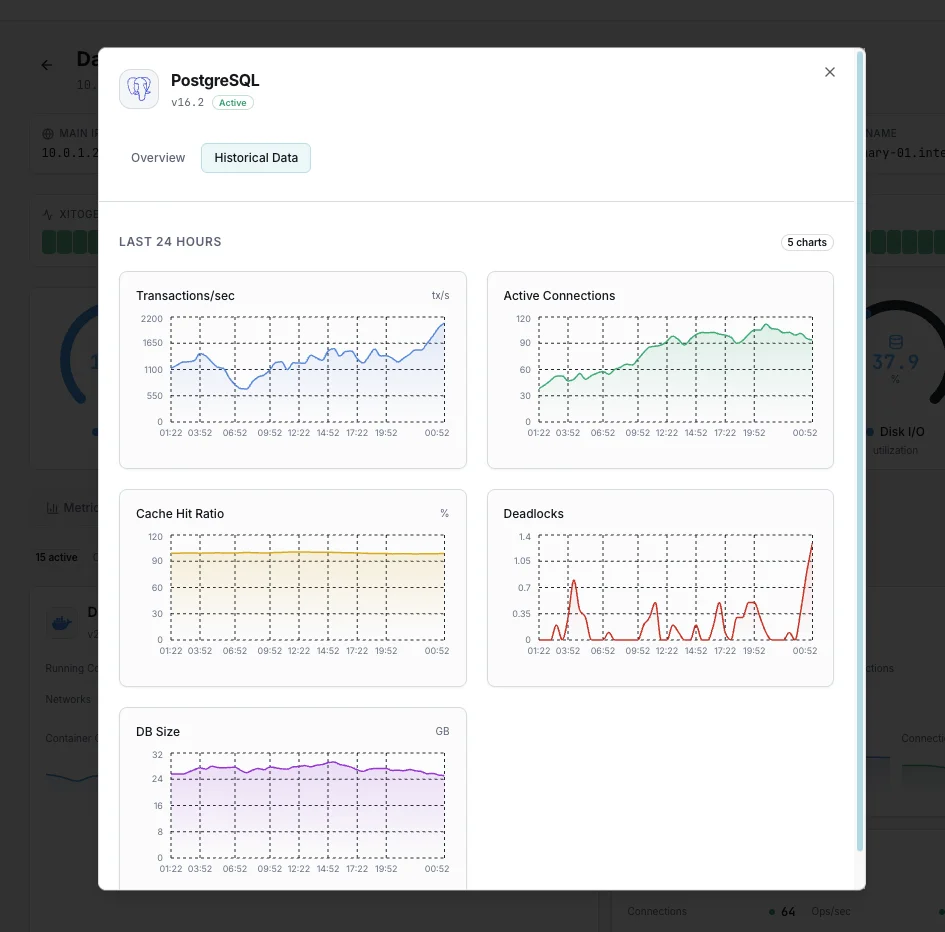
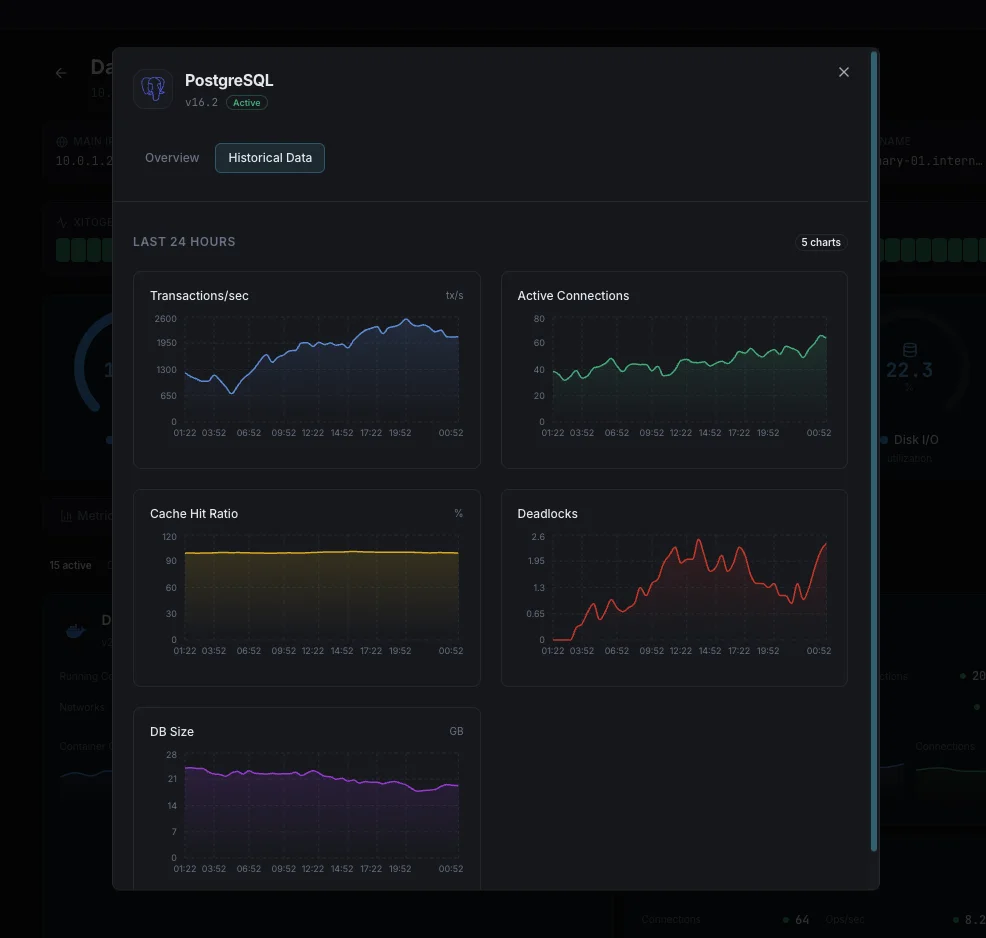
Ce que nous surveillons
Connexions actives
Nombre de connexions actuellement actives au serveur PostgreSQL.
Transactions par seconde
Taux de transactions commitées et annulées (rollback).
Opérations sur tuples
Taux de tuples insérés, mis à jour, supprimés et récupérés sur l'ensemble des bases de données.
Tuples morts
Nombre de dead tuples en attente de vacuum, indiquant un potentiel bloat des tables.
Ratio de hit du cache
Pourcentage de requêtes de données servies depuis les shared buffers sans accès disque.
Lag de réplication
Octets ou secondes de retard par rapport au primary en réplication streaming.
Taux de génération WAL
Taux de données Write-Ahead Log générées.
Attentes de verrous
Nombre de requêtes en attente d'acquérir des verrous sur les objets de la base de données.
Fichiers temporaires créés
Nombre et taille des fichiers temporaires créés pour le traitement des requêtes.
Taille de la base de données
Espace disque total utilisé par chaque base de données, y compris les index.
Inactif dans une transaction
Connexions inactives à l'intérieur d'une transaction ouverte, pouvant détenir des verrous.
Checkpoints
Fréquence et durée des opérations de checkpoint.
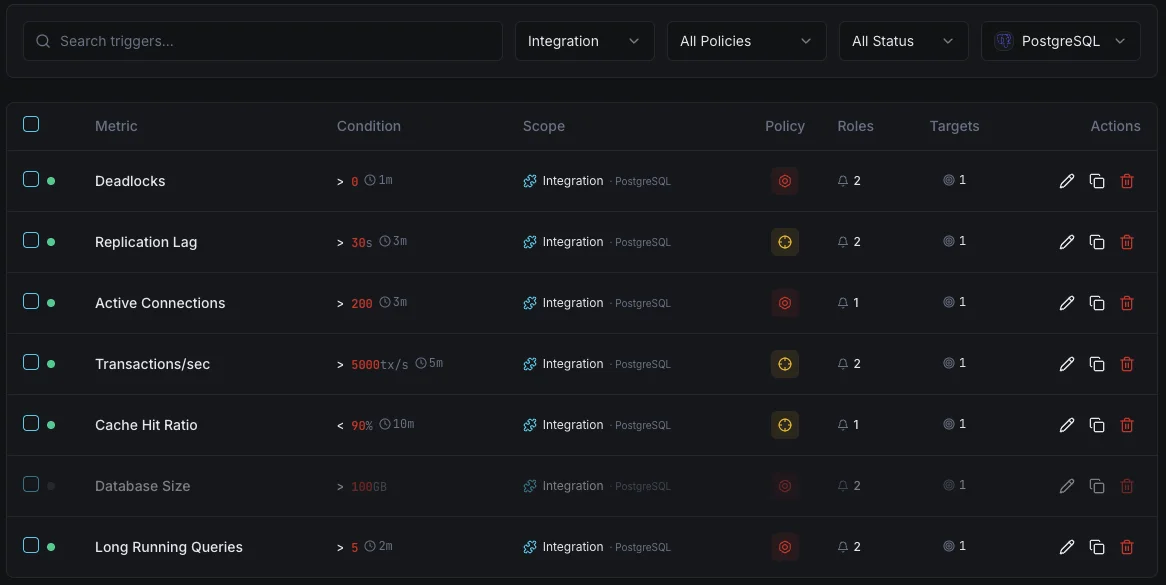
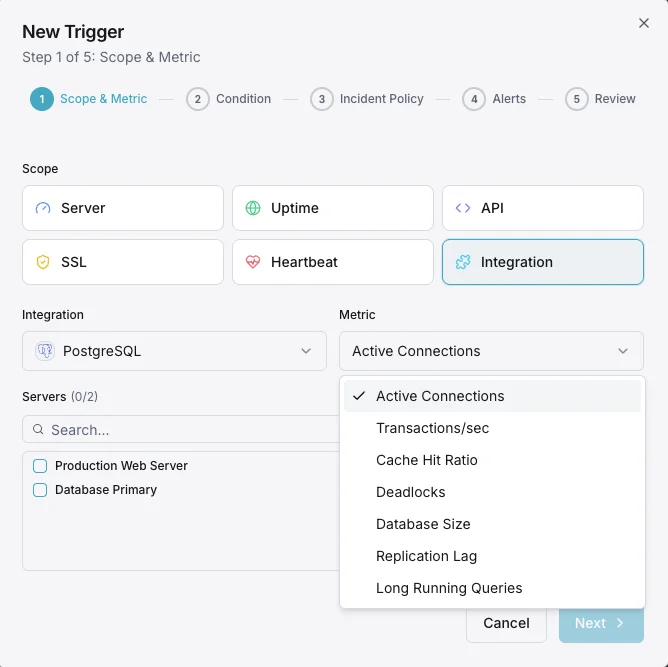
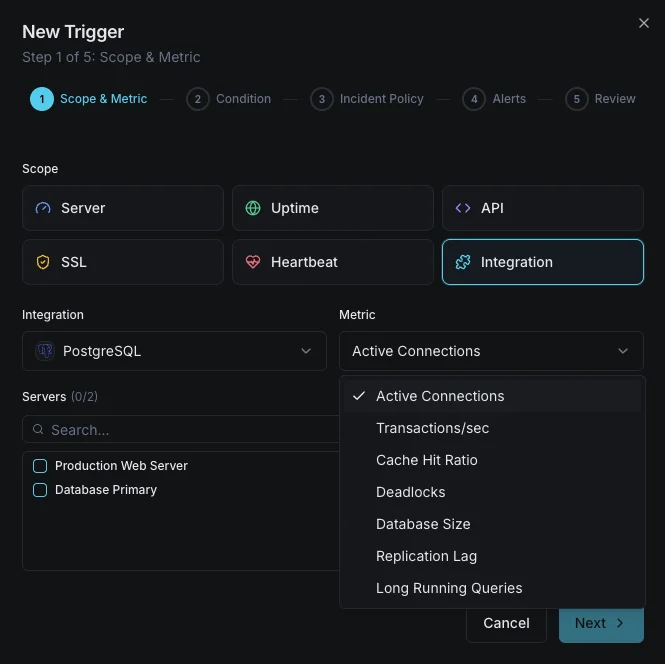
Configurables déclencheurs d'alerte
Configurez des déclencheurs personnalisés dans votre tableau de bord pour être averti dès que les indicateurs d{name}s dépassent les seuils que vous avez définis.
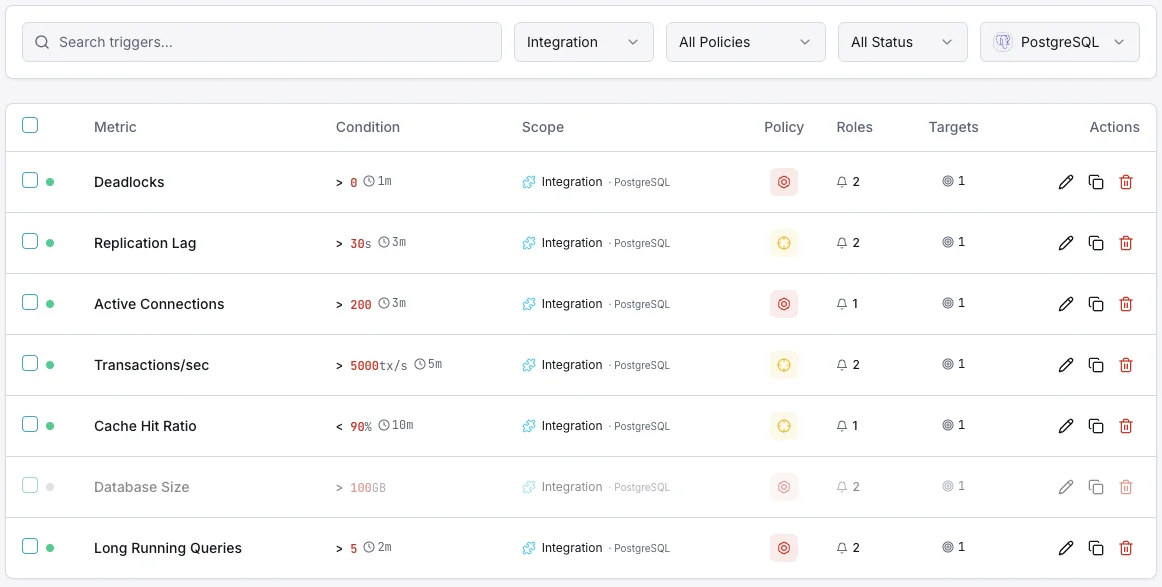
Connexions actives
crucialSe déclenche lorsque les connexions actives approchent max_connections, risquant le refus de nouvelles connexions et des erreurs applicatives.
Lag de réplication
crucialSe déclenche lorsque la réplication streaming prend du retard, risquant l'incohérence des données entre primary et replicas.
Tuples morts
avertissementAlerte lorsque le nombre de dead tuples dépasse le seuil, indiquant que vacuum prend du retard et que le bloat des tables augmente.
Ratio de hit du cache
avertissementSe déclenche lorsque le ratio de hit du cache tombe sous le seuil, indiquant une I/O disque excessive et une potentielle pression mémoire.
Attentes de verrous
avertissementSe déclenche lorsque des requêtes sont bloquées en attente de verrous, indiquant une contention qui dégrade les performances.
Chute du taux de transactions
crucialAlerte lorsque le débit des transactions chute significativement, indiquant un blocage potentiel ou un problème de performance.
Importance de la surveillance PostgreSQL
PostgreSQL gère des données critiques pour des entreprises du monde entier. Sans surveillance appropriée, le bloat des tables, la dérive de réplication et l'épuisement des connexions peuvent entraîner corruption de données, pannes et défaillances irrécupérables.
- Détectez tôt les requêtes longues et la contention de verrous
- Évitez le bloat des tables grâce au suivi des performances vacuum
- Surveillez la réplication streaming pour la cohérence des données
- Identifiez les fuites de connexion avant l'épuisement du pool
- Suivez la génération de WAL pour la planification de capacité de stockage
Pourquoi choisir Xitoring
Xitoring offre une surveillance PostgreSQL de qualité entreprise avec une configuration zéro-config. Notre agent léger détecte automatiquement vos instances PostgreSQL, commence à collecter des métriques en moins de 60 secondes et s'intègre à vos canaux de notification existants.
- Installation en une commande — pas de YAML complexe ni de fichiers de configuration
- 15+ nœuds de surveillance mondiaux pour des contrôles à faible latence
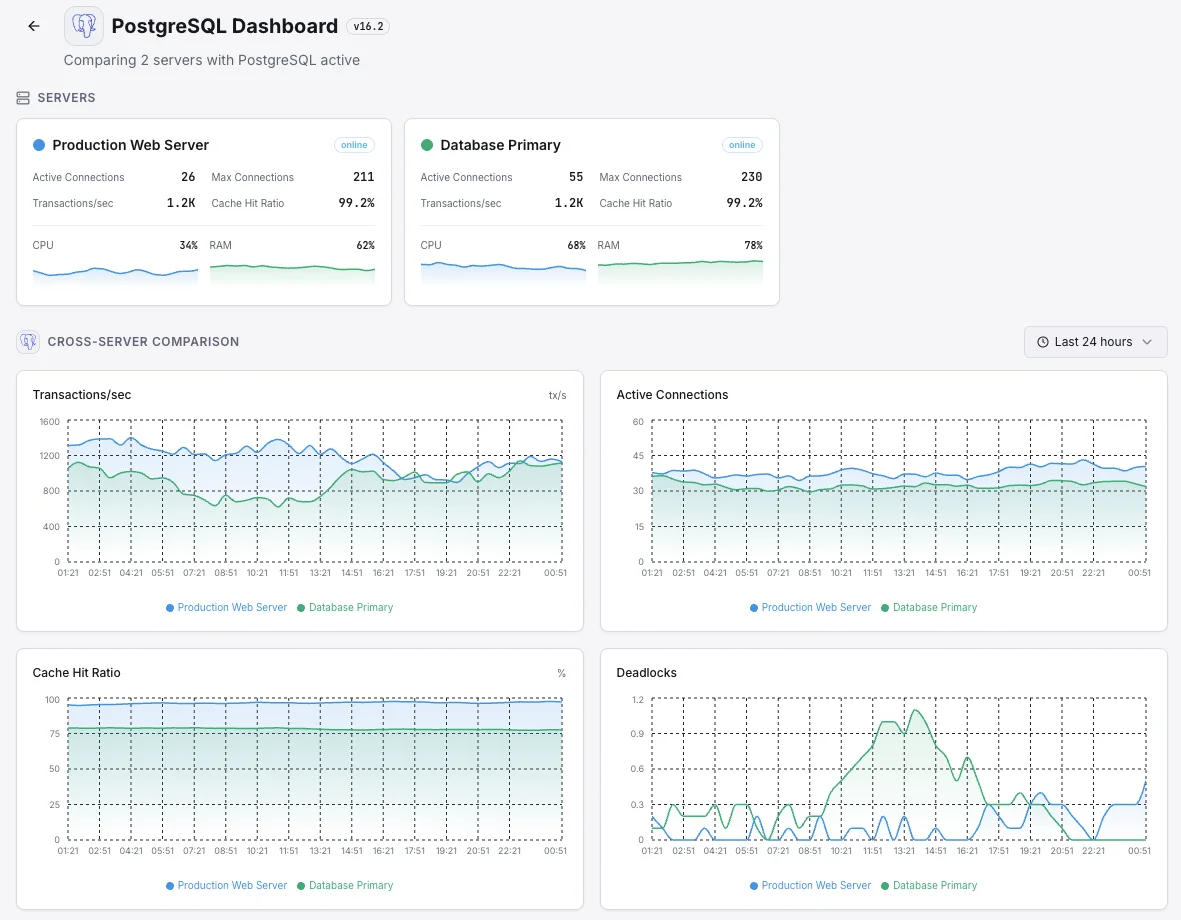
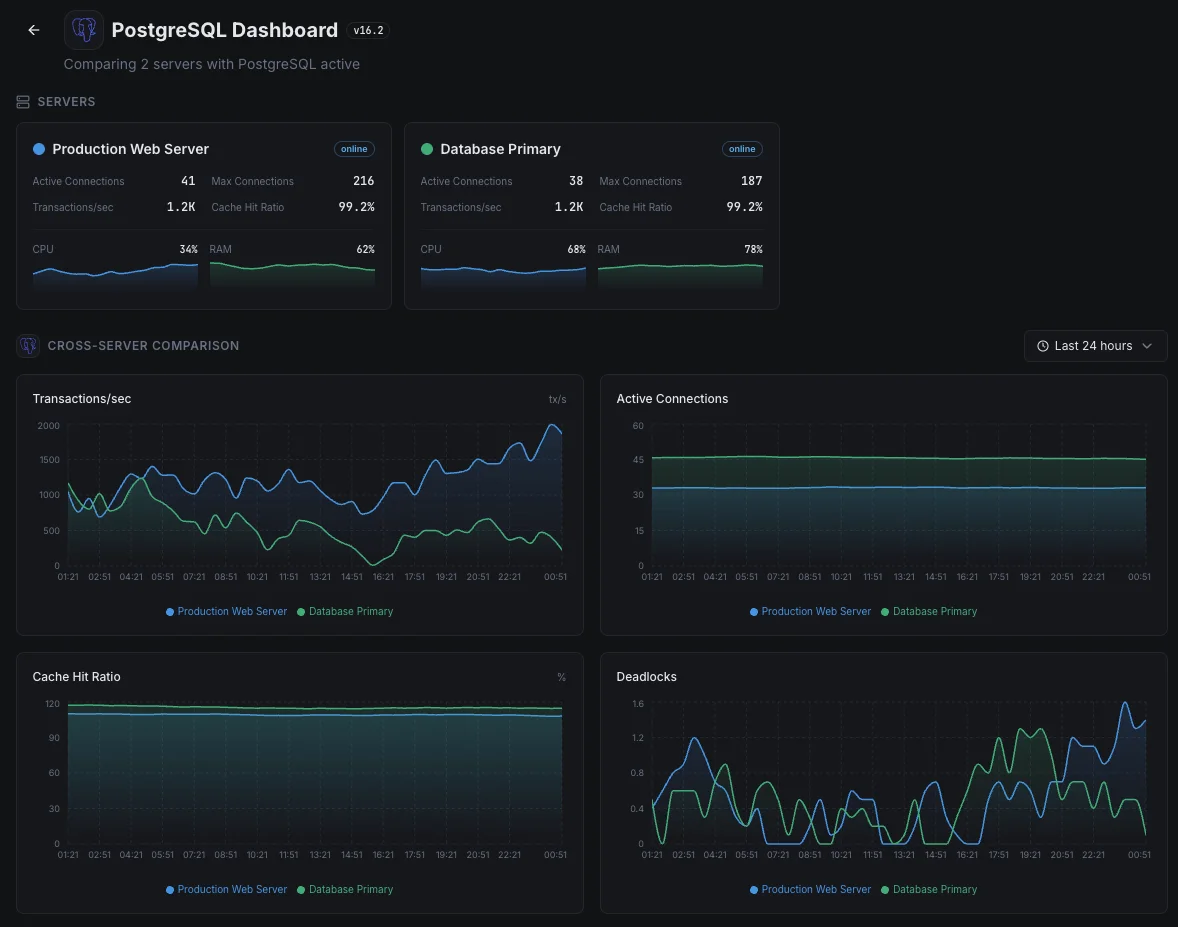
- Tableau de bord unifié pour serveurs, bases de données et uptime
- Alerting flexible via Slack, PagerDuty, Telegram et plus
- Conservation de l'historique pour la planification de capacité et les audits
Scénarios courants de surveillance PostgreSQL
Où PostgreSQL fonctionne généralement aujourd'hui — et ce qui pourrait mal tourner si personne ne surveille.
Base de données cloud gérée (AWS, Azure, Google)
Les fournisseurs de cloud gèrent les sauvegardes et les correctifs, mais ils ne vous disent pas quand vos propres requêtes sont lentes, que vos connexions s'épuisent, ou qu'une copie de sauvegarde prend discrètement du retard par rapport à la version en direct. Nous détectons les problèmes que le fournisseur vous laisse, afin qu'une panne ne prenne pas l'équipe au dépourvu.
Base de données auto-hébergée avec basculement automatique
Si la base de données principale tombe en panne, une copie de sauvegarde est censée prendre le relais en quelques secondes. Mais une sauvegarde qui prend discrètement du retard peut transformer ce transfert en une panne de 30 secondes — ou pire, en une perte de données. Nous surveillons chaque copie afin que vous sachiez qu'elle est vraiment prête à prendre le relais avant que vous n'en ayez besoin.
Base de données fonctionnant dans Kubernetes
Les bases de données dans Kubernetes sont déplacées, redémarrées et mises à jour automatiquement par la plateforme. La plupart du temps, c'est sûr — quand ce n'est pas le cas, vous le découvrez généralement par des utilisateurs frustrés. Nous mettons en évidence les signes avant-coureurs afin que l'équipe puisse intervenir avant qu'une mise à jour de routine ne devienne un incident.
Prérequis pour PostgreSQL
Assurez-vous d'avoir tout cela en place — la plupart des installations sont une affaire de 60 secondes une fois ces conditions réunies.
- PostgreSQL 12 ou plus récent (testé avec 12-16) tournant sur le serveur
- Un utilisateur avec le rôle pg_monitor et SELECT sur pg_stat_database
- Facultatif : extension pg_stat_statements chargée pour les métriques au niveau des requêtes
Commencez par procès-verbal
Installer Xitogent sur votre serveur
Si ce n'est pas déjà fait, installez l'agent de monitoring léger Xitogent sur votre serveur.
curl -s https://xitoring.com/install.sh | sudo bash -s -- --key=YOUR_API_KEYCréer un utilisateur de monitoring dans PostgreSQL
Créez un utilisateur en lecture seule dédié pour que Xitogent collecte les métriques :
CREATE USER xitoring WITH PASSWORD 'your_secure_password';
GRANT pg_monitor TO xitoring;
GRANT SELECT ON pg_stat_database TO xitoring;Activer l'intégration PostgreSQL
Utilisez le tableau de bord Xitoring ou la CLI pour activer l'intégration PostgreSQL avec les identifiants de monitoring.
sudo xitogent integrateConfigurer les seuils d'alerte (facultatif)
Définissez des seuils personnalisés pour des métriques comme le retard de réplication, les dead tuples ou le nombre de connexions afin d'être notifié dès que quelque chose mérite votre attention.
Vérifier que tout fonctionne
Exécutez cette commande sur le serveur pour confirmer que Xitogent a bien détecté l'intégration. De nouvelles métriques apparaîtront sur votre tableau de bord dans environ 30 secondes.
sudo xitogent statusVous envisagez des alternatives ?
Découvrez comment Xitoring se positionne face aux alternatives pour la surveillance de PostgreSQL — tarifs forfaitaires, intégrations plus poussées et un seul agent pour couvrir tout votre stack.


Souvent a posé des questions
De quelles autorisations l'utilisateur chargé de la surveillance a-t-il besoin ?
Cette intégration aura-t-elle un impact sur les performances de PostgreSQL ?
Puis-je surveiller la réplication PostgreSQL ?
Cela fonctionne-t-il avec PostgreSQL en mode géré (RDS, Cloud SQL) ?
Quelles versions de PostgreSQL sont prises en charge ?
À quelle fréquence les indicateurs sont-ils collectés ?
Comment surveiller l'épuisement du pool de connexions et les sessions idle-in-transaction ?
Cela fonctionne-t-il avec PostgreSQL managé (RDS, Cloud SQL, Azure) ?
Quelles versions de PostgreSQL sont prises en charge ?
Commencer à surveiller PostgreSQL aujourd'hui
Configuration en moins de 60 secondes. Aucune carte bancaire requise. Statistiques complètes dès le premier jour.
Commencer l'essai gratuit