Varnish Suivi
Surveillez en temps réel les taux de réussite du cache Varnish, l'état des serveurs backend, le stockage d'objets et le débit des requêtes, sans aucune configuration.
Pourquoi surveiller ? Varnish?
Varnish Cache est un puissant accélérateur HTTP utilisé pour accélérer considérablement les applications web. La surveillance de Varnish est essentielle pour garantir des taux de réussite de mise en cache élevés, détecter les défaillances du backend, suivre les évictions d'objets et maintenir des performances optimales pour la diffusion de votre contenu.
La surveillance de Varnish, expliquée
La surveillance de Varnish détecte les baisses de taux de cache hit, les défaillances de santé des backends et l'épuisement des thread pools avant qu'ils ne se traduisent par une latence visible par l'utilisateur ou des pannes. Comme Varnish se place généralement devant WordPress, Magento ou votre couche d'origine, un problème Varnish est généralement un problème à l'échelle du site — bien le surveiller signifie détecter la plupart des incidents de la couche cache dans leur première minute. Xitoring détecte automatiquement votre Varnish, lit depuis varnishstat, et achemine les alertes vers Slack, PagerDuty, Telegram ou votre astreinte existante.
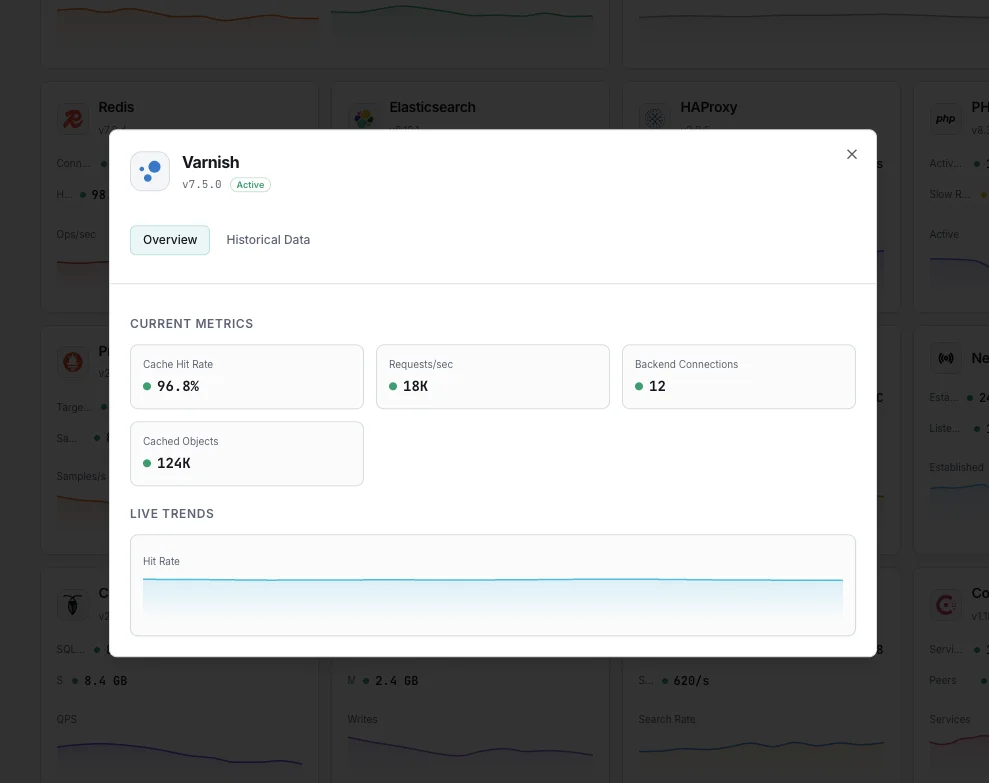
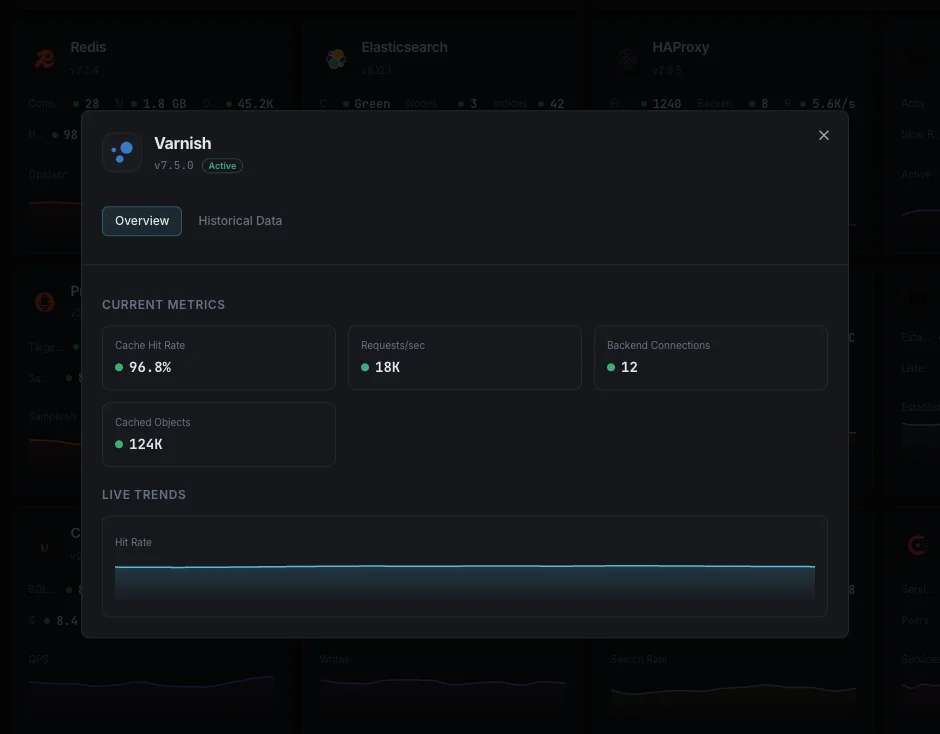
Ce que nous surveillons
Ratio de hit du cache
Pourcentage de requêtes servies depuis le cache.
Santé du backend
Statut de santé des serveurs d'origine.
Évictions d'objets
Taux d'objets évincés du cache.
Requêtes/sec
Débit total des requêtes.
Utilisation du pool de threads
Threads actifs vs disponibles.
Connexions backend
Connexions vers les serveurs d'origine.
Taille du cache
Utilisation actuelle du stockage des objets en cache.
Longueur de la liste de bans
Nombre de bans de cache actifs.
MAIN.n_object
Objets actuellement en cache. Suit par rapport à `n_objectcore`/`n_objecthead` pour un éclairage sur l'overhead d'objet utile au tuning du cache.
SMA.s0.g_bytes / g_space
Stockage utilisé vs disponible pour le backend de stockage par défaut. Lorsque `g_bytes / (g_bytes + g_space)` approche 100 %, Varnish commence à évincer.
MAIN.s_pipe / s_pass
Requêtes piped (tunnel TCP) vs passed (origine directe, sans mise en cache). Des taux `s_pass` élevés font souvent remonter des règles VCL `return(pass)` qui devraient être `return(hash)`.
Longueur de la liste de bans
Bans VCL actifs non encore évincés. Une liste de bans croissante ralentit les recherches de cache — elle devrait converger vers près de zéro à mesure que le thread ban-lurker évince les objets bannis.
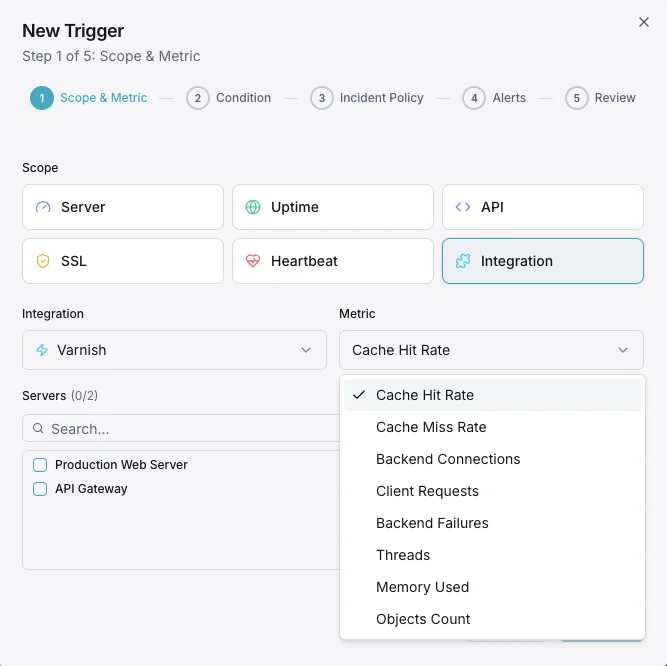
Configurables déclencheurs d'alerte
Configurez des déclencheurs personnalisés dans votre tableau de bord pour être averti dès que les indicateurs d{name}s dépassent les seuils que vous avez définis.
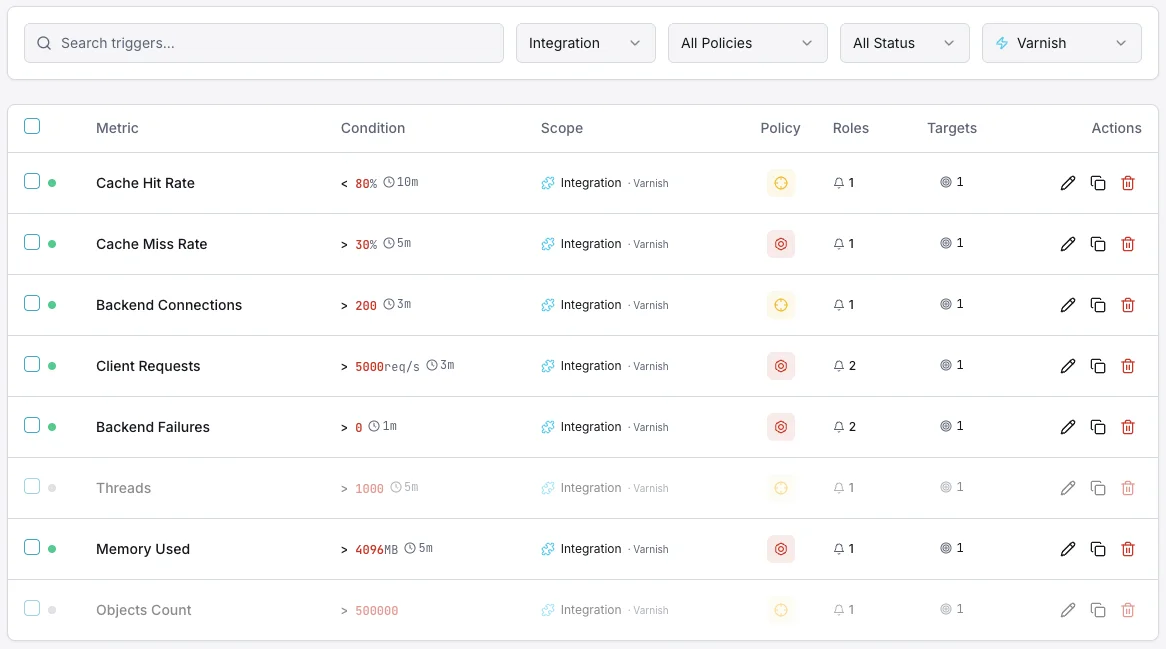
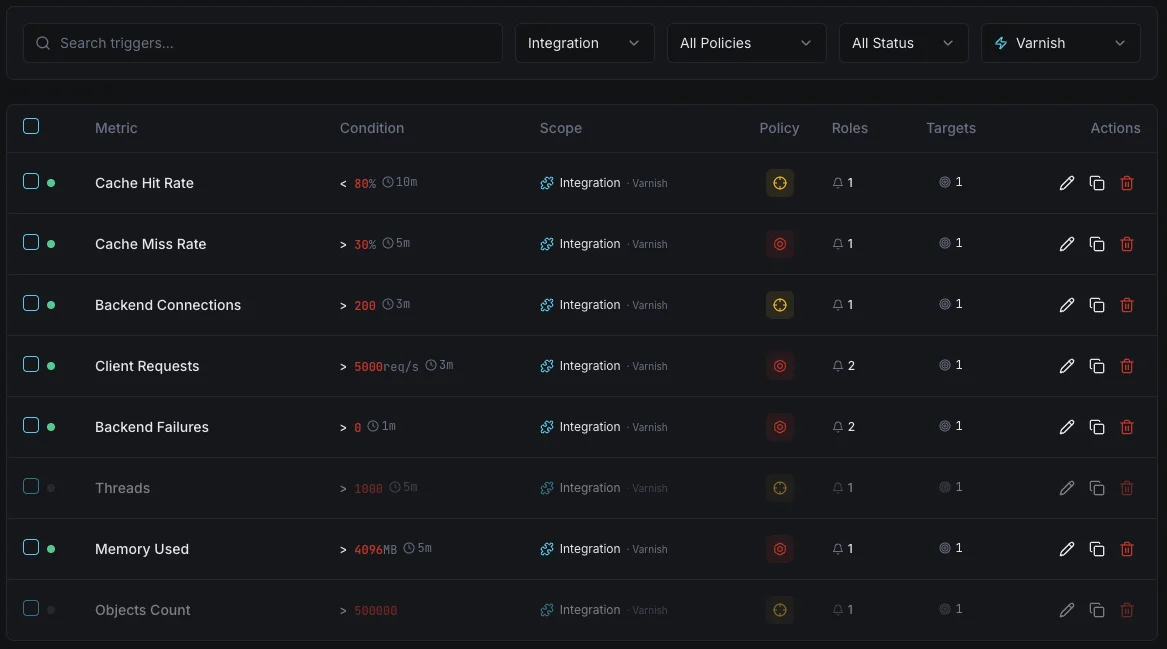
Ratio de hit du cache
avertissementSe déclenche lorsque le ratio de hit tombe sous le seuil.
Backend hors ligne
crucialAlerte lorsqu'un serveur backend échoue aux health checks.
Évictions d'objets
avertissementSe déclenche sur un taux d'éviction élevé indiquant une pression sur le cache.
Pool de threads
crucialSe déclenche lorsque le pool de threads est épuisé.
Taux de requêtes
avertissementAlerte sur un débit de requêtes inhabituel.
Importance de la surveillance Varnish
Varnish Cache peut servir le contenu 300 fois plus vite que les serveurs d'origine. Sans surveillance, les cache miss et les défaillances backend annulent ces avantages.
- Maintenez des ratios de hit du cache élevés pour une vitesse optimale
- Détectez immédiatement les défaillances des backends
- Suivez les évictions pour dimensionner correctement le stockage du cache
- Surveillez les pools de threads pour éviter les pertes de requêtes
Pourquoi choisir Xitoring
Surveillance Varnish de qualité entreprise avec configuration zéro-config.
- Installation en une commande
- 15+ nœuds de surveillance mondiaux
- Tableau de bord unifié
- Alerting multicanal
- Conservation des données historiques

Scénarios courants de surveillance Varnish
Où Varnish fonctionne généralement aujourd'hui — et ce qui pourrait mal tourner si personne ne surveille.
Accélérer WordPress et les sites de contenu
Varnish permet aux sites de contenu de se charger presque instantanément en mémorisant les pages terminées. Lorsque cet effet cesse de fonctionner, le site ralentit discrètement et les classements de recherche commencent à chuter. Nous détectons la baisse dès qu'elle apparaît afin que le trafic et le SEO ne soient pas discrètement affectés.
Boutiques en ligne au moment du paiement
Les boutiques en ligne doivent rester rapides au moment précis où les clients achètent — même en cas de pic de trafic. Nous surveillons les signaux qui indiquent si le magasin peut absorber un afflux, afin que les promotions et les ventes ne se transforment pas en pertes de revenus.
Mise en cache pour les API et les microservices
Lorsque Varnish met en cache les résultats d'une API interne, il empêche les applications sous-jacentes d'être submergées par des requêtes répétées. Nous surveillons le moment où il commence à peiner sous une charge de pointe afin que la capacité puisse être augmentée avant que les applications derrière lui ne commencent à échouer.
Prérequis pour Varnish
Assurez-vous d'avoir tout cela en place — la plupart des installations sont une affaire de 60 secondes une fois ces conditions réunies.
- Varnish Cache 6.x ou plus récent
- Binaire varnishstat disponible dans le PATH système
- Accès en lecture au log de mémoire partagée Varnish (/var/lib/varnish — accordé par défaut pour root)
Commencez par procès-verbal
Installer Xitogent sur votre hôte Varnish
Installez l'agent de monitoring léger Xitogent sur l'hôte qui exécute Varnish Cache. Xitogent tourne en root, il peut donc lire la mémoire partagée de Varnish directement, sans appartenance à un groupe supplémentaire.
curl -s https://xitoring.com/install.sh | sudo bash -s -- --key=YOUR_API_KEYVérifier la disponibilité de varnishstat
Confirmez que le binaire `varnishstat` est dans le PATH et renvoie des compteurs. Exécutez `varnishstat -1` sur l'hôte — vous devriez voir un instantané des métriques de cache, backends et sessions.
varnishstat -1Activer l'intégration Varnish
Exécutez `sudo xitogent integrate` et sélectionnez Varnish. Xitogent teste la connexion et détecte automatiquement votre instance Varnish et les backends configurés — le reste est configuré automatiquement.
sudo xitogent integrateConfigurer les seuils d'alerte (facultatif)
Définissez des seuils personnalisés pour le taux de cache hit, les événements Backend Down ou les évictions d'objets afin de détecter les régressions de cache et les problèmes de capacité avant que les utilisateurs ne voient des réponses non cachées.
Vérifier que tout fonctionne
Exécutez cette commande sur le serveur pour confirmer que Xitogent a bien détecté l'intégration. De nouvelles métriques apparaîtront sur votre tableau de bord dans environ 30 secondes.
sudo xitogent statusVous envisagez des alternatives ?
Découvrez comment Xitoring se positionne face aux alternatives pour la surveillance de Varnish — tarifs forfaitaires, intégrations plus poussées et un seul agent pour couvrir tout votre stack.


Souvent a posé des questions
Quelles versions de Varnish sont prises en charge ?
Est-ce que cela utilise varnishstat ?
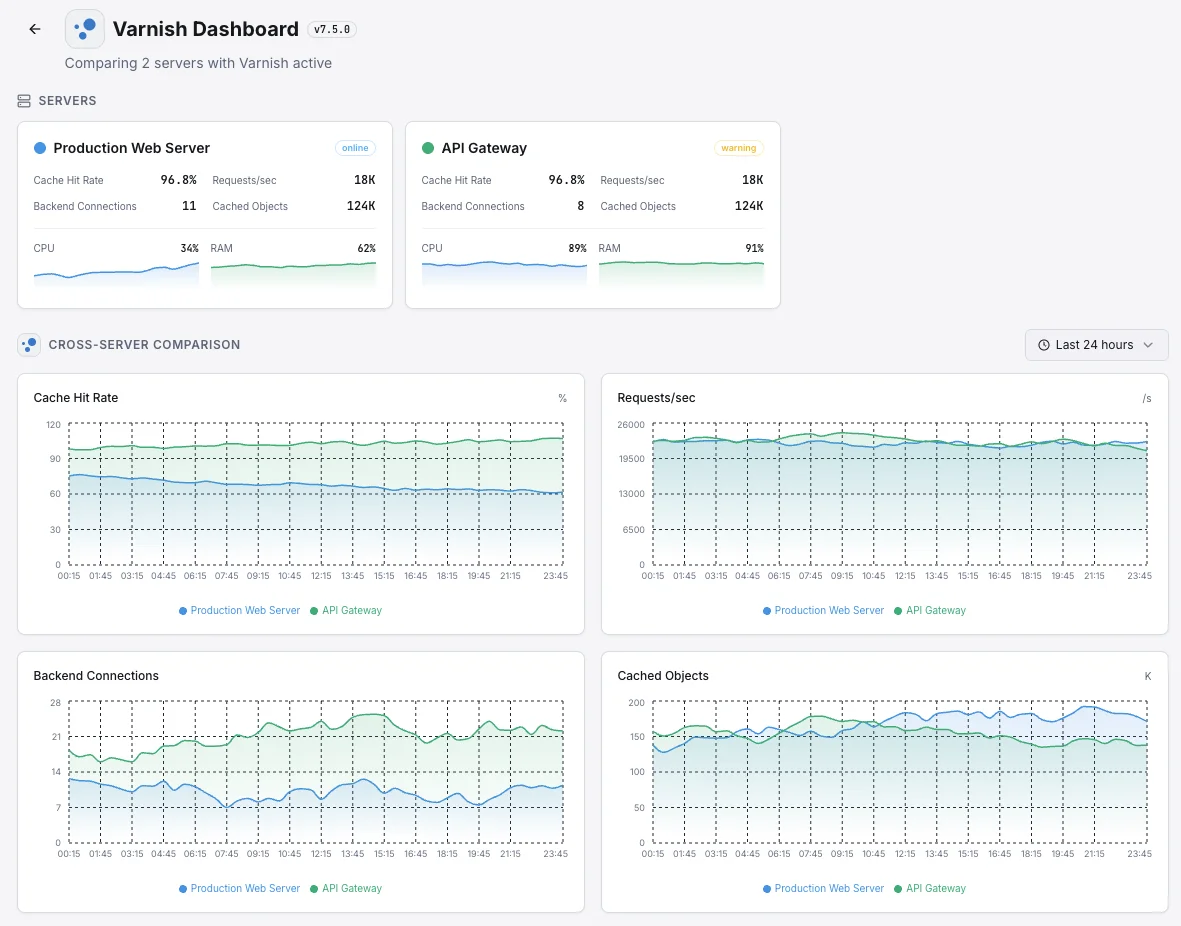
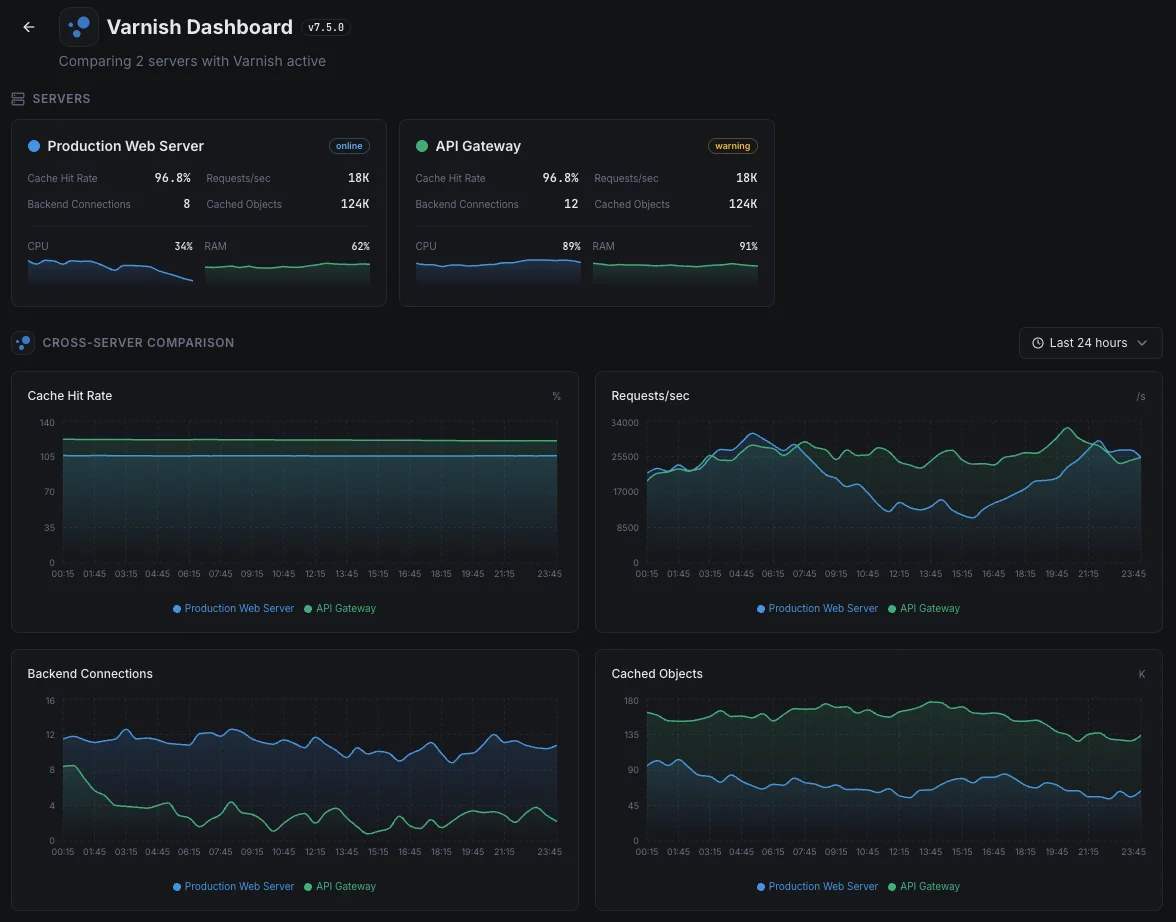
Puis-je surveiller plusieurs instances de Varnish ?
Combien coûte chaque serveur Varnish Cache ?
Combien de temps faut-il pour configurer la surveillance de Varnish Cache ?
Comment surveiller un serveur Varnish gratuitement ?
Quel type d'alertes est-ce que je reçois pour la surveillance de Varnish Cache ?
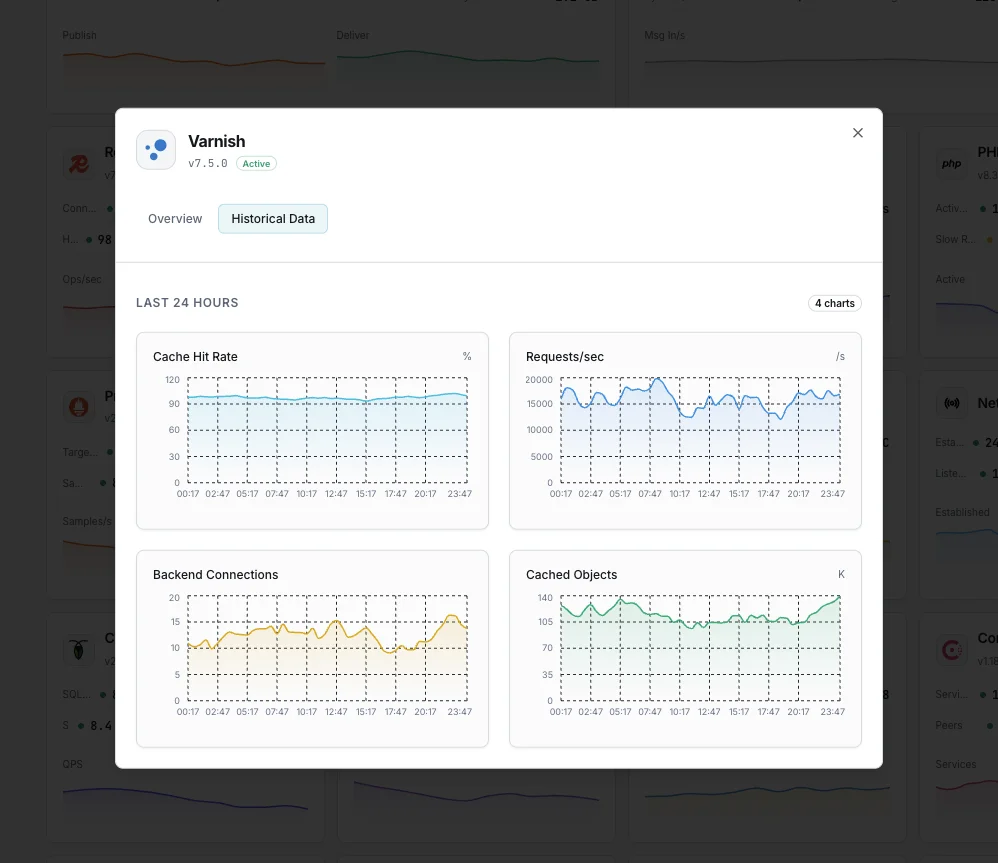
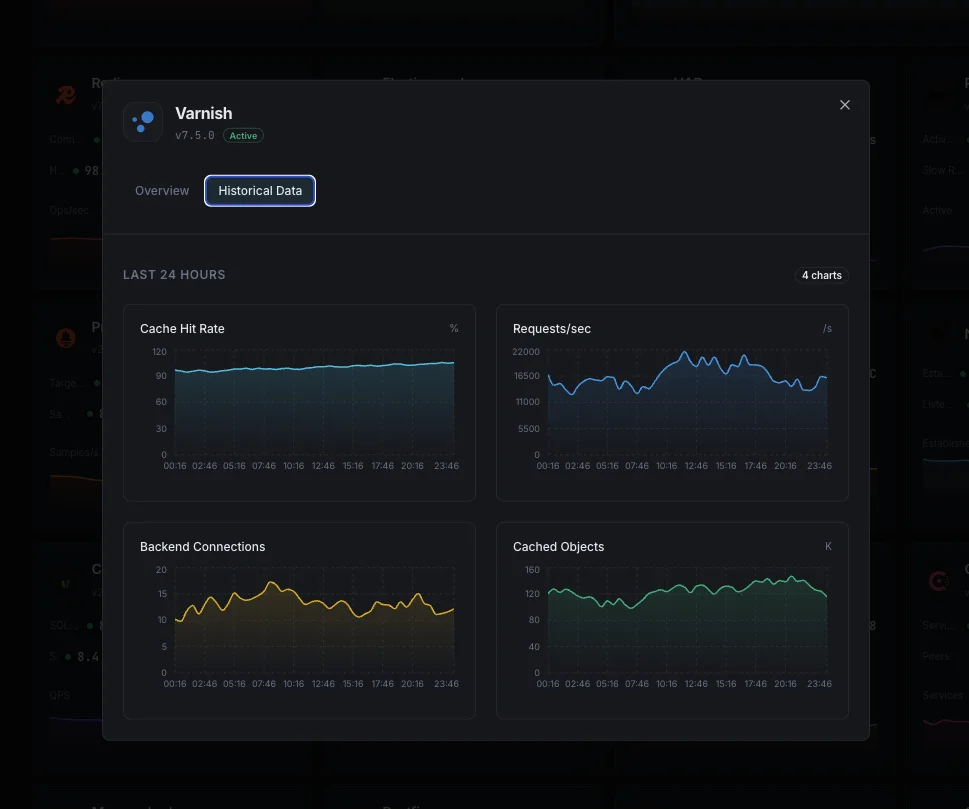
Quels graphiques proposez-vous pour la surveillance de Varnish Cache ?
Puis-je surveiller plusieurs instances Varnish sur un même serveur ?
Commencer à surveiller Varnish aujourd'hui
Configuration en moins de 60 secondes. Aucune carte bancaire requise. Statistiques complètes dès le premier jour.
Commencer l'essai gratuit