Nginx Überwachung
Überwachen Sie die Nginx-Leistung, aktive Verbindungen, den Anforderungsdurchsatz und den Zustand der Upstream-Server in Echtzeit – ganz ohne Konfiguration.
Warum überwachen Sie Nginx?
Nginx ist der weltweit beliebteste Reverse-Proxy- und Webserver, der täglich Milliarden von Anfragen im Internet verarbeitet. Die Überwachung von Nginx ist entscheidend, um schnelle Antwortzeiten zu gewährleisten, Ausfälle im Upstream zu erkennen und eine hohe Verfügbarkeit sicherzustellen. Die Nginx-Integration von Xitoring bietet über das stub_status-Modul einen umfassenden Einblick in den Verbindungsstatus, die Anfrageraten und die Leistungskennzahlen Ihres Servers.
Nginx-Monitoring, erklärt
Nginx-Monitoring erkennt verworfene Verbindungen, Upstream-Fehler und Worker-Pool-Erschöpfung, bevor sie zu einem Downstream-Ausfall kaskadieren. Da Nginx zwischen Nutzern und jeder anderen Schicht in Ihrem Stack sitzt, bedeutet gutes Monitoring von Nginx in der Regel, die meisten Produktions-Incidents am Einstiegspunkt zu erfassen – statt vom App-Server rückwärts zu debuggen. Xitoring bietet Ihnen 1-Minuten-Sichtbarkeit auf jede Metrik, die stub_status (und die Nginx Plus API) bereitstellt, plus Alerts, die an Slack, PagerDuty, Telegram oder Ihre bestehende On-Call-Rotation weitergeleitet werden.
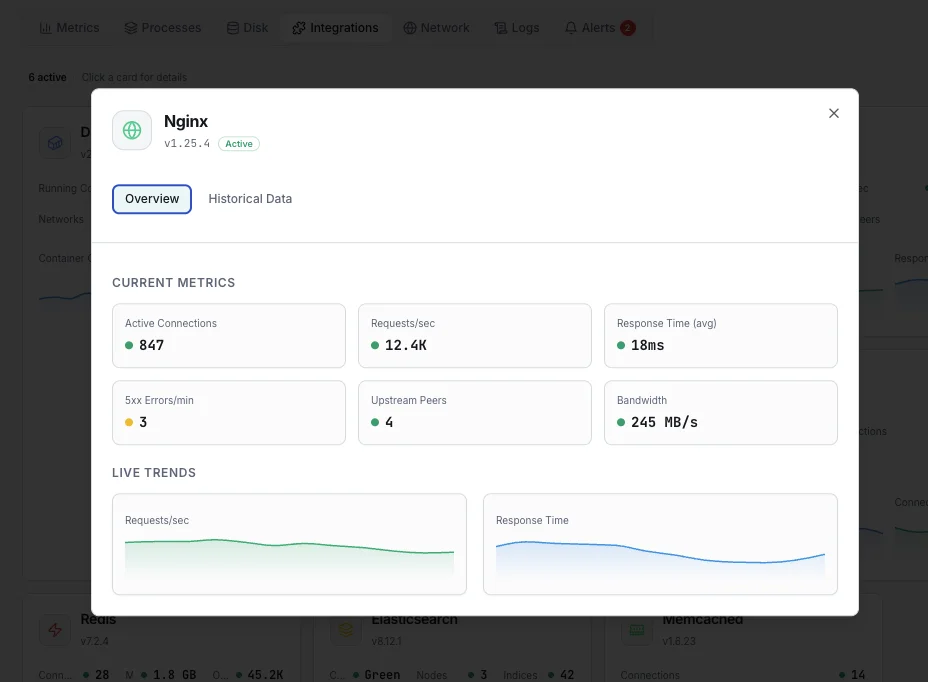
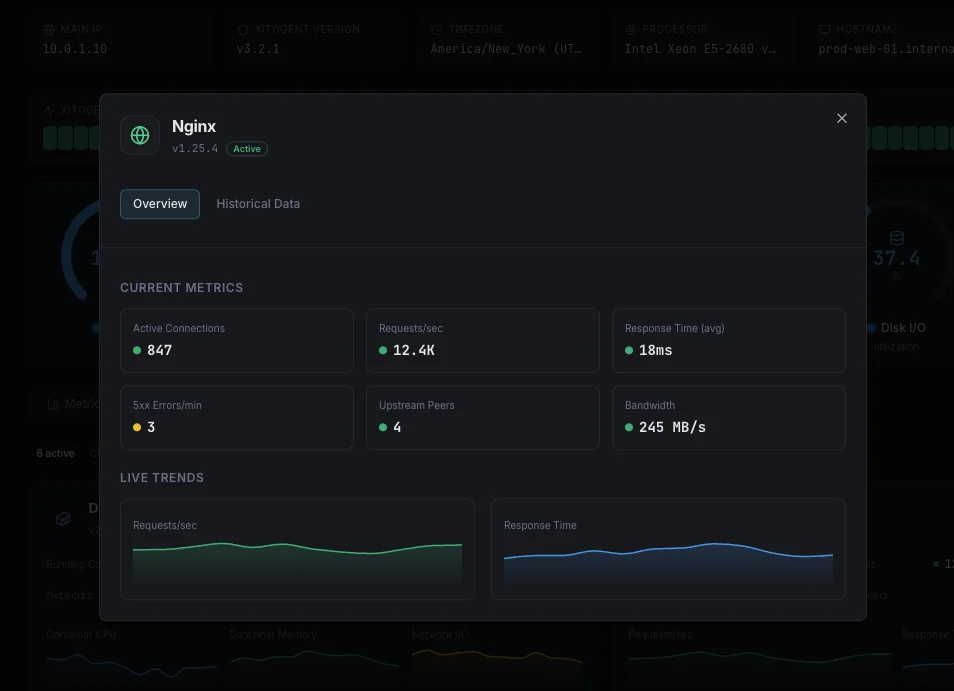
Was wir überwachen
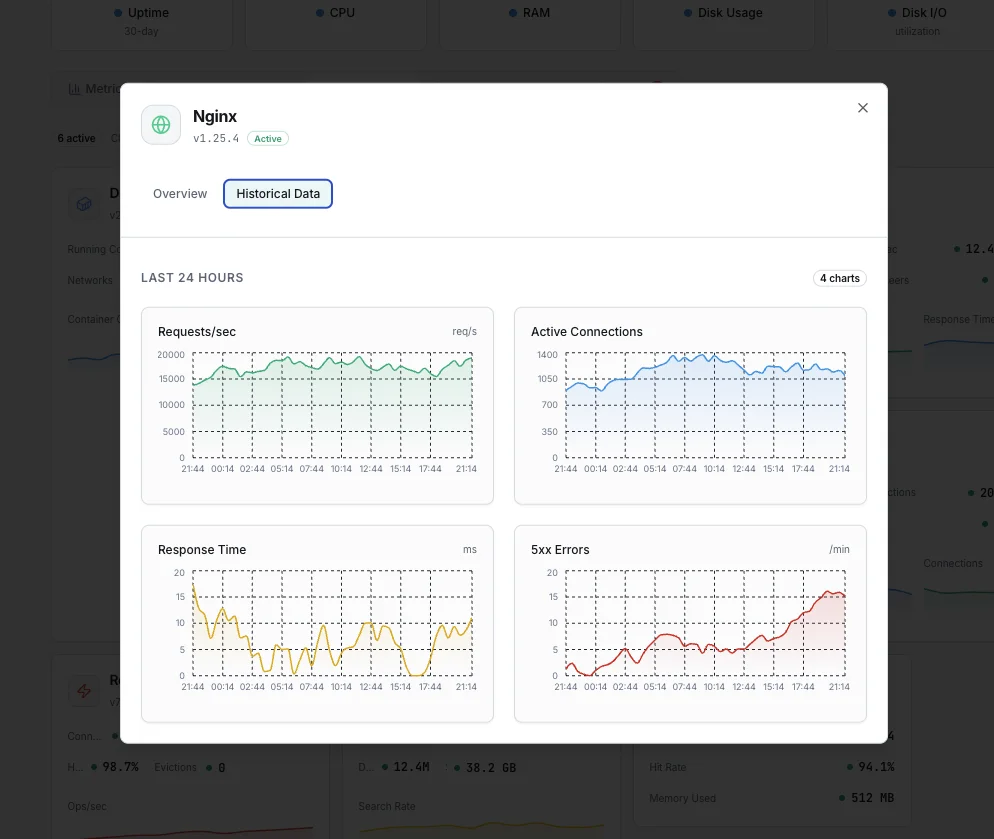
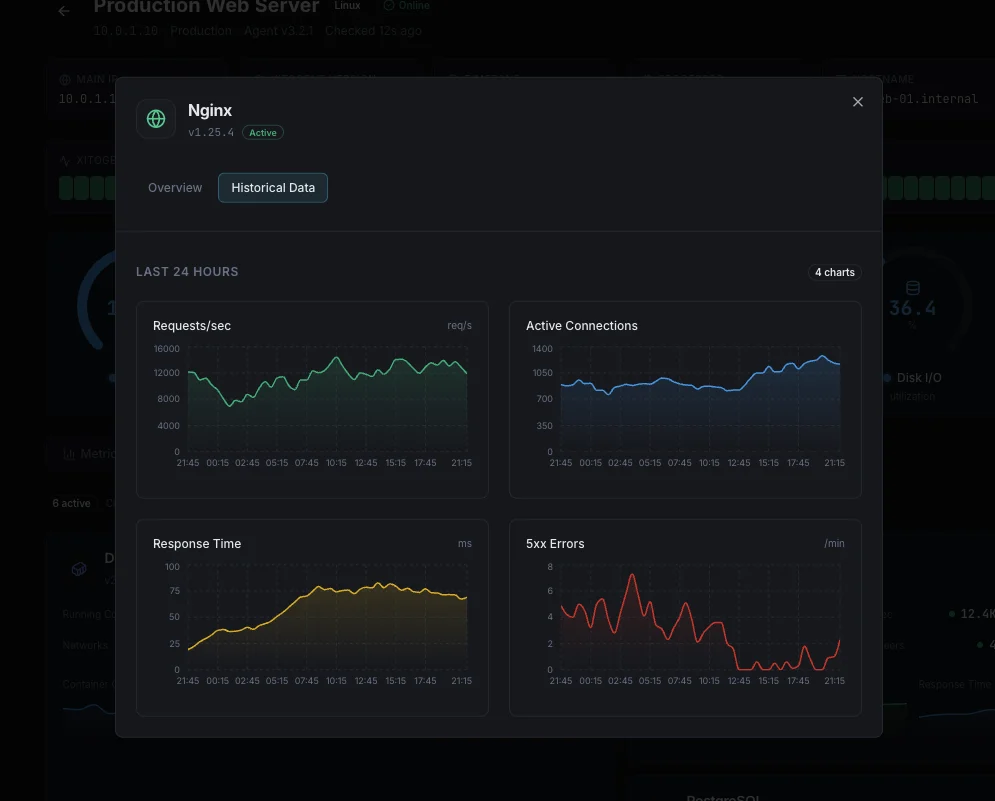
Aktive Verbindungen
Anzahl der derzeit aktiven Client-Verbindungen einschließlich wartender Verbindungen.
Angenommen
Gesamte Anzahl angenommener Client-Verbindungen seit Serverstart.
Bearbeitet
Gesamtzahl der bearbeiteten Verbindungen. In der Regel gleich Accepts, sofern keine Ressourcengrenzen erreicht werden.
Anfragen
Gesamte Anzahl der vom Server verarbeiteten Client-Anfragen.
Lesend
Anzahl der Verbindungen, bei denen Nginx den Request-Header liest.
Schreibend
Anzahl der Verbindungen, bei denen Nginx die Antwort an den Client zurückschreibt.
Wartend
Anzahl der Keep-Alive-Verbindungen, die auf die nächste Anfrage warten.
Anfragen pro Sekunde
Rate eingehender Anfragen, berechnet aus der Gesamtanzahl der Anfragen.
Verbindungen pro Sekunde
Rate der vom Server angenommenen neuen Verbindungen.
Reaktionszeit
Durchschnittliche Zeit zur Verarbeitung und Beantwortung von Client-Anfragen.
Geöffnete File Descriptors
Aktuelle Anzahl geöffneter Fds vs. das Limit pro Worker. Das Annähern an das Limit verursacht dasselbe Symptom verworfener Verbindungen wie zu niedrige `worker_connections`.
Worker-Prozess-Anzahl
Aktive Nginx-Worker-Prozesse. Worker-Fluktuation oder unerwartete Neustart-Counts zeigen OOM-Events und Segfaults, die in Request-Metriken unsichtbar sind.
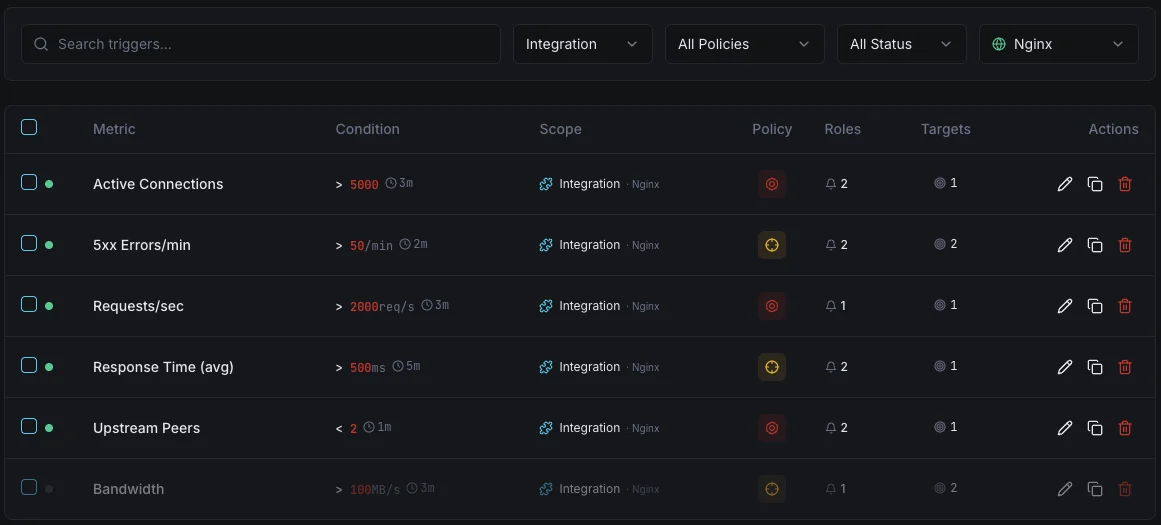
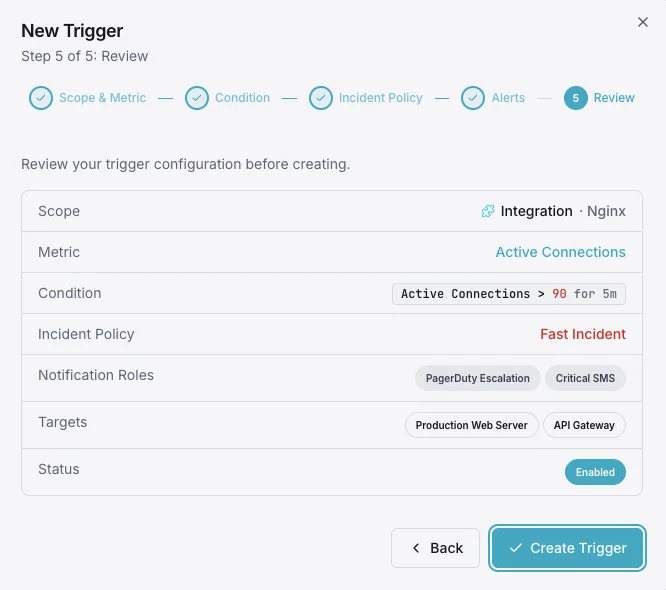
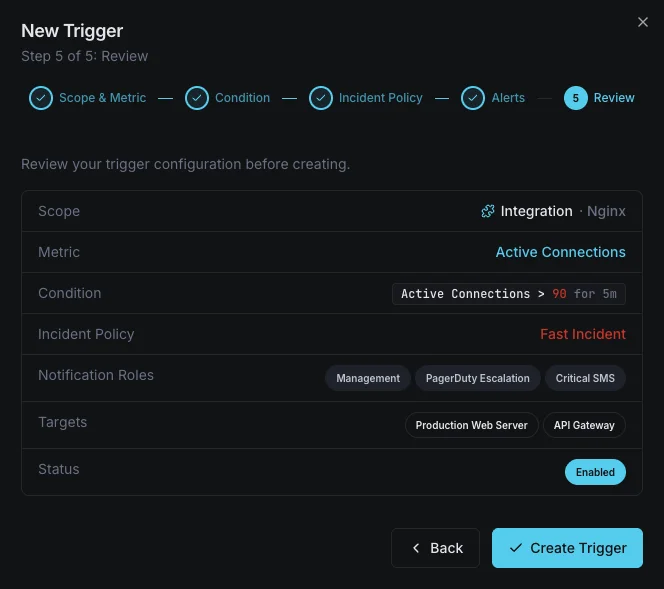
Konfigurierbare Alarmauslöser
Richten Sie benutzerdefinierte Trigger in Ihrem Dashboard ein, um benachrichtigt zu werden, sobald die Kennzahlen von „Nginx“ Ihre festgelegten Schwellenwerte überschreiten.
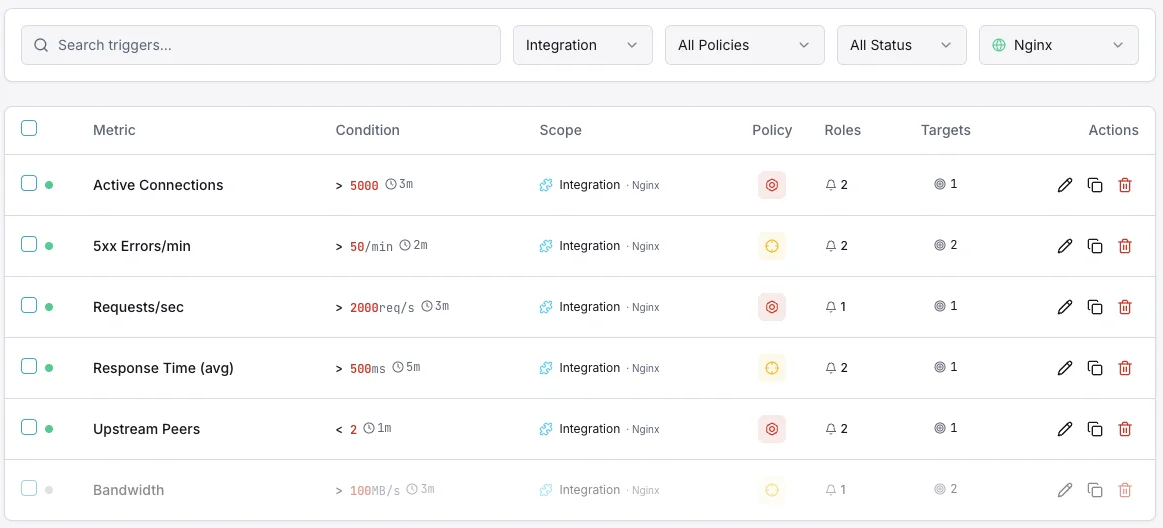
Aktive Verbindungen
WarnungWird ausgelöst, wenn die Anzahl aktiver Verbindungen Ihren Schwellenwert überschreitet — ein Hinweis darauf, dass der Server stark ausgelastet ist.
Wartende Verbindungen
WarnungWird ausgelöst, wenn wartende (Keep-Alive-) Verbindungen den Schwellenwert überschreiten — möglicherweise ein Hinweis auf langsame Clients oder Upstream-Verzögerungen.
Anfragen pro Sekunde
entscheidendWarnt, wenn die Anfragerate die normalen Basiswerte überschreitet — nützlich zur Erkennung von Traffic-Spitzen oder DDoS-Mustern.
Schreibende Verbindungen
WarnungWird ausgelöst, wenn zu viele Verbindungen im Writing-Zustand sind — ein Hinweis auf mögliche Antwort-Engpässe.
Verworfene Verbindungen
entscheidendWird ausgelöst, wenn die Differenz zwischen Accepts und Handled wächst — ein Hinweis auf Ressourcenerschöpfung.
Reaktionszeit
entscheidendWarnt, wenn die durchschnittliche Antwortzeit Ihr definiertes Limit überschreitet und auf Leistungseinbußen hinweist.
Bedeutung von Nginx-Überwachung
Nginx treibt weltweit über 35 % aller Webserver an und ist das Rückgrat moderner Microservices-Architekturen. Ohne geeignete Überwachung können Verbindungssättigung, Upstream-Ausfälle und Leistungseinbußen unbemerkt bleiben.
- Verbindungssättigung erkennen, bevor Nutzer Timeouts erleben
- Upstream-Serverausfälle und langsame Backends erkennen
- Kaskadierende Ausfälle in Reverse-Proxy-Konfigurationen verhindern
- SLA-Einhaltung durch Echtzeit-Leistungseinblick sicherstellen
- Lastverteilung mit Analysen zu Verbindungszuständen optimieren
Warum entscheiden Sie sich für Xitoring
Xitoring liefert Nginx-Überwachung auf Enterprise-Niveau mit Zero-Config-Setup. Unser schlanker Agent erkennt Ihre Nginx-Instanzen automatisch, beginnt in unter 60 Sekunden mit der Erfassung von Metriken und integriert sich in Ihre bestehenden Benachrichtigungskanäle.
- Installation mit einem einzigen Befehl – keine komplizierten YAML- oder Konfigurationsdateien
- Über 15 globale Überwachungsknoten für Überprüfungen mit geringer Latenz
- Zentrales Dashboard für Server, Dienste und Verfügbarkeit
- Flexible Benachrichtigungen über Slack, PagerDuty, Telegram und weitere Dienste
- Aufbewahrung historischer Daten für die Kapazitätsplanung und Audits
Häufige Nginx-Monitoring- Szenarien
Wo Nginx heute typischerweise läuft – und was schiefgehen könnte, wenn niemand hinsieht.
Webserver vor einer App
Nginx ist normalerweise das Erste, womit Ihre Besucher interagieren – und die dahinterliegende App ist normalerweise der Ort, an dem die eigentliche Arbeit stattfindet. Wenn die Website sich langsam anfühlt, ist es wichtig, ob die Langsamkeit in Nginx oder in der App liegt. Wir trennen die beiden, damit das richtige Team das richtige Problem behebt.
Einstiegspunkt für eine Kubernetes-App
In Kubernetes ist Nginx oft das Tor zu Ihrer gesamten App. Ein Fehltritt dort – ein fehlerhafter Konfigurations-Push, ein abgelaufenes Zertifikat, ein fehlgeschlagener Rollout – kann alles kurzzeitig offline nehmen. Wir erkennen die Warnzeichen frühzeitig, damit Routine-Deployments nicht zu kundenrelevanten Ausfällen werden.
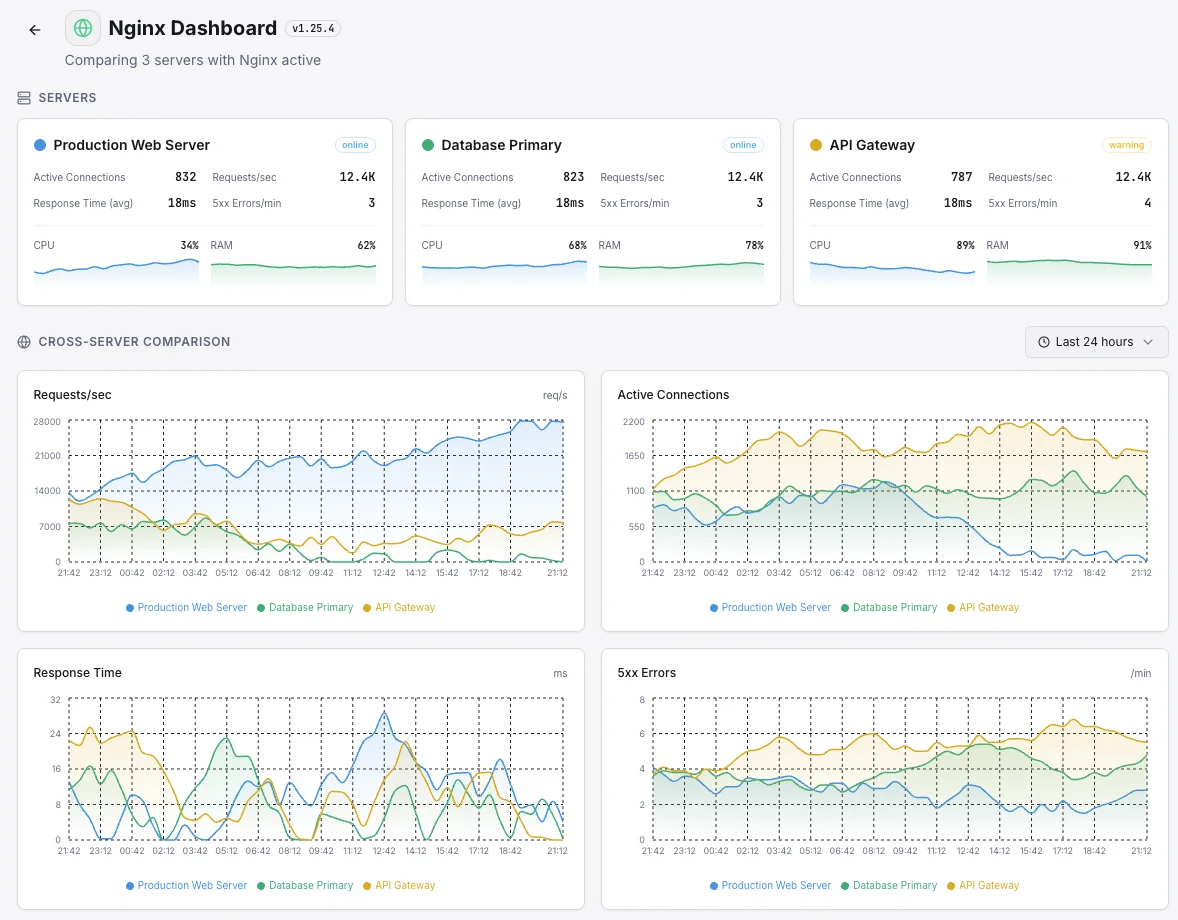
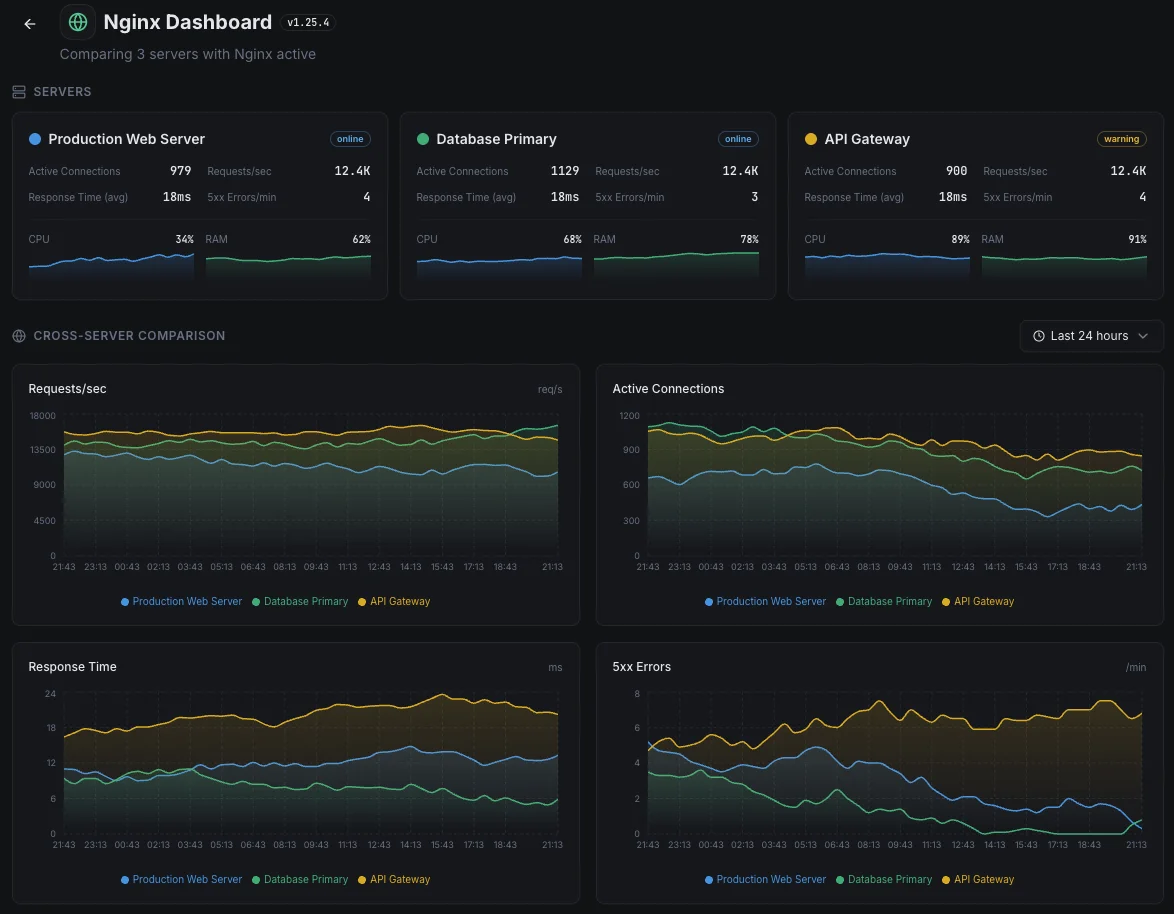
Verteilung des Traffics auf mehrere App-Server
Wenn Nginx den Traffic auf viele Server verteilt, kann ein überlasteter Server das Erlebnis für einen Teil der Benutzer unbemerkt beeinträchtigen. Wir erkennen den ausfallenden Server frühzeitig, damit er aus der Rotation genommen wird, bevor weitere Besucher betroffen sind.
Voraussetzungen für Nginx
Stellen Sie sicher, dass diese Punkte erfüllt sind — danach ist die Installation eine Sache von 60 Sekunden.
- Nginx mit einkompiliertem http_stub_status_module (Überprüfung mit
nginx -V 2>&1 | grep stub_status) - Ein /nginx-status-Location-Block aktiviert und von localhost aus erreichbar
- Lesezugriff auf die Nginx-Konfiguration und die Logs
Erste Schritte in Minuten
Xitogent auf Ihrem Server installieren
Falls noch nicht geschehen, installieren Sie den ressourcenschonenden Xitogent-Monitoring-Agenten auf Ihrem Server.
curl -s https://xitoring.com/install.sh | sudo bash -s -- --key=YOUR_API_KEYstub_status in Nginx aktivieren
Fügen Sie einen `/nginx-status`-Location-Block zu Ihrer Nginx-Konfiguration hinzu, in dem `stub_status;` aktiviert und der Zugriff auf localhost beschränkt ist. Laden Sie Nginx neu und prüfen Sie mit `curl http://127.0.0.1/nginx-status`.
# In your Nginx server block:
location /nginx-status {
    stub_status;
    access_log off;
    server_tokens on;
    allow 127.0.0.1;
    deny all;
}Nginx-Integration aktivieren
Aktivieren Sie die Nginx-Integration über das Xitoring-Dashboard oder die CLI. Xitogent erkennt Ihre Nginx-Instanz automatisch.
sudo xitogent integrateAlarmschwellen konfigurieren (optional)
Legen Sie eigene Schwellenwerte für Metriken wie aktive Verbindungen, Request-Rate oder Antwortzeit fest, um benachrichtigt zu werden, wenn etwas Aufmerksamkeit benötigt.
Funktion überprüfen
Führen Sie diesen Befehl auf dem Server aus, um zu bestätigen, dass Xitogent die Integration erkannt hat. Innerhalb von etwa 30 Sekunden werden frische Metriken in Ihr Dashboard gestreamt.
sudo xitogent statusErwägen Sie Alternativen?
Sehen Sie, wie sich Xitoring gegen die Alternativen für Nginx-Monitoring schlägt — Pauschalpreise, tiefere Integrationen und ein Agent, der Ihren gesamten Stack abdeckt.


Häufig gestellte Fragen
Ist für die Nginx-Integration „stub_status“ erforderlich?
Wird diese Integration die Leistung von Nginx beeinträchtigen?
Kann ich Nginx Plus mit dieser Integration überwachen?
Kann ich mehrere Nginx-Instanzen auf einem Server überwachen?
Welche Nginx-Versionen werden unterstützt?
Wie oft werden Kennzahlen erfasst?
Kann ich mehrere Nginx-Instanzen auf einem Server überwachen?
Welche Nginx-Versionen werden unterstützt?
Wie häufig werden Metriken erfasst?
Nginx überwachen heute
In weniger als 60 Sekunden eingerichtet. Keine Kreditkarte erforderlich. Umfassende Kennzahlen vom ersten Tag an.
Kostenlose Testversion starten