PostgreSQL Überwachung
Überwachen Sie PostgreSQL-Transaktionen, Verbindungen, Replikation und die Vacuum-Leistung in Echtzeit – ganz ohne Konfiguration.
Warum überwachen Sie PostgreSQL?
PostgreSQL ist die weltweit fortschrittlichste Open-Source-Relationaldatenbank, auf die man sich bei kritischen Workloads – von Finanzsystemen bis hin zu Geodatenanwendungen – verlassen kann. Die Überwachung von PostgreSQL ist unerlässlich, um lang laufende Abfragen zu erkennen, eine Überlastung der Verbindungen zu verhindern, den Zustand der Replikation zu verfolgen und Vacuum-Vorgänge zu optimieren. Die PostgreSQL-Integration von Xitoring bietet umfassende Datenbank-Observability.
PostgreSQL-Monitoring, erklärt
PostgreSQL-Monitoring fängt Replikationsdrift, ausufernde Autovacuum-Vorgänge, aufgeblähte Tabellen und Idle-in-Transaction-Sessions ab, bevor sie zu Ausfällen oder Datenkorruption werden. Für jede Postgres-Workload — RDS, Aurora, CloudNativePG, selbstgehostete Patroni-Cluster — ist die Pro-Datenbank-Sichtbarkeit der Unterschied zwischen dem Abfangen eines Connection-Leaks in 60 Sekunden und dem Erfahren davon aus einem Kundenticket. Xitoring entdeckt Ihr Postgres automatisch, fragt die nativen pg_stat_*-Views mit der pg_monitor-Rolle ab und routet Alarme zu Slack, PagerDuty, Telegram oder Ihrem bestehenden On-Call.
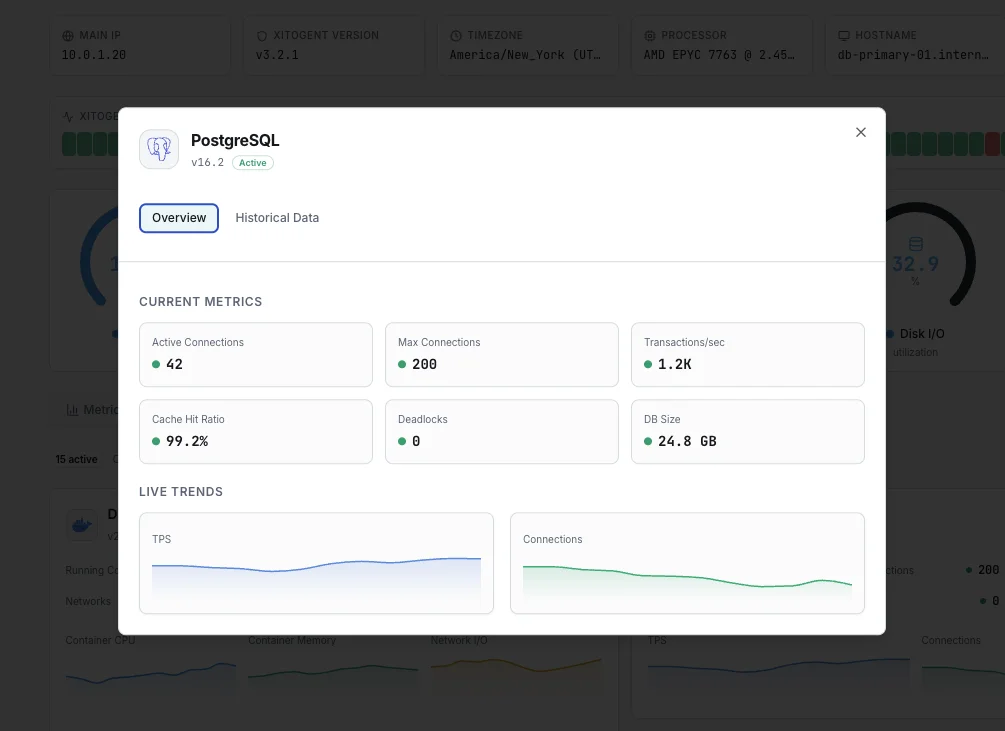
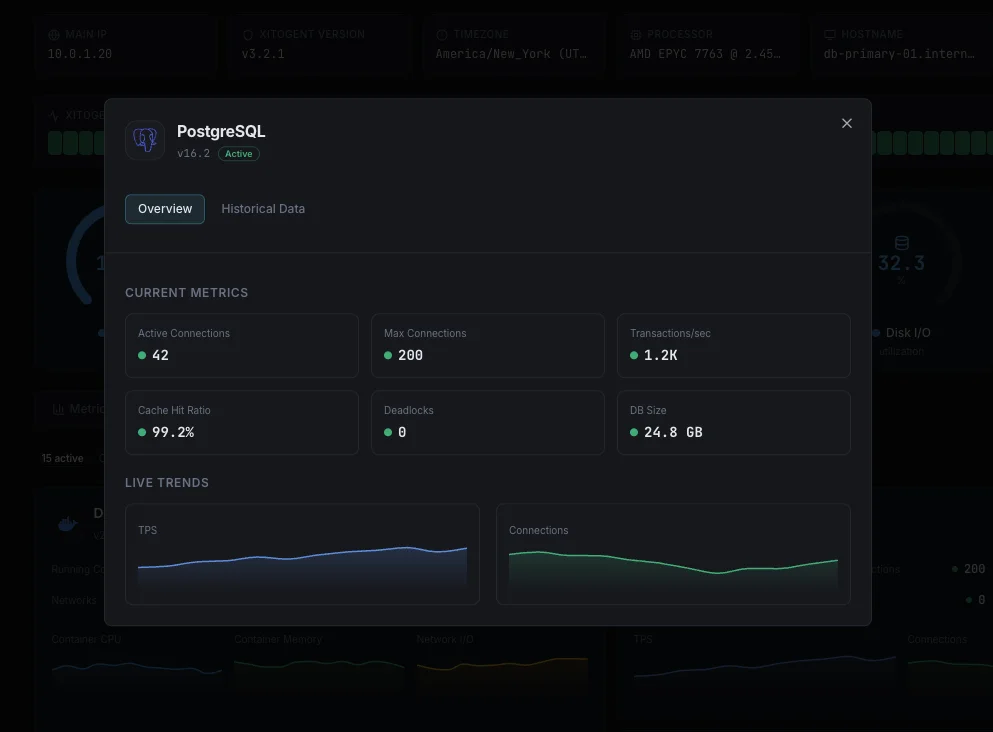
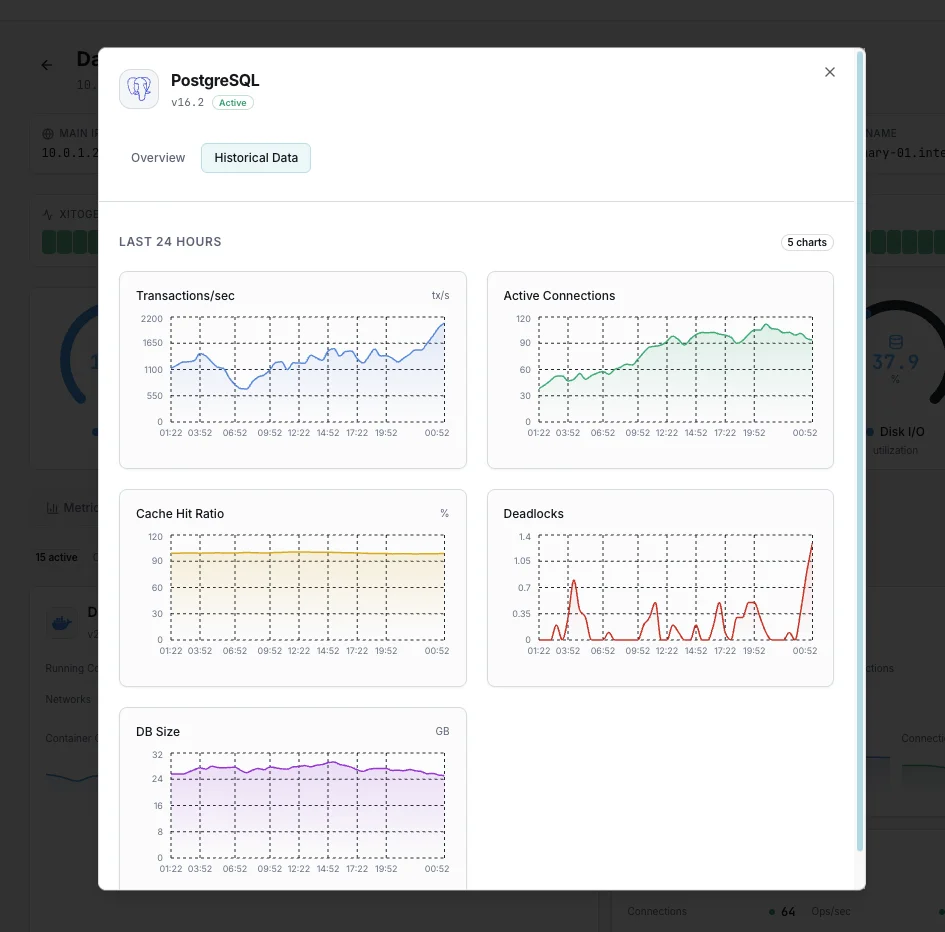
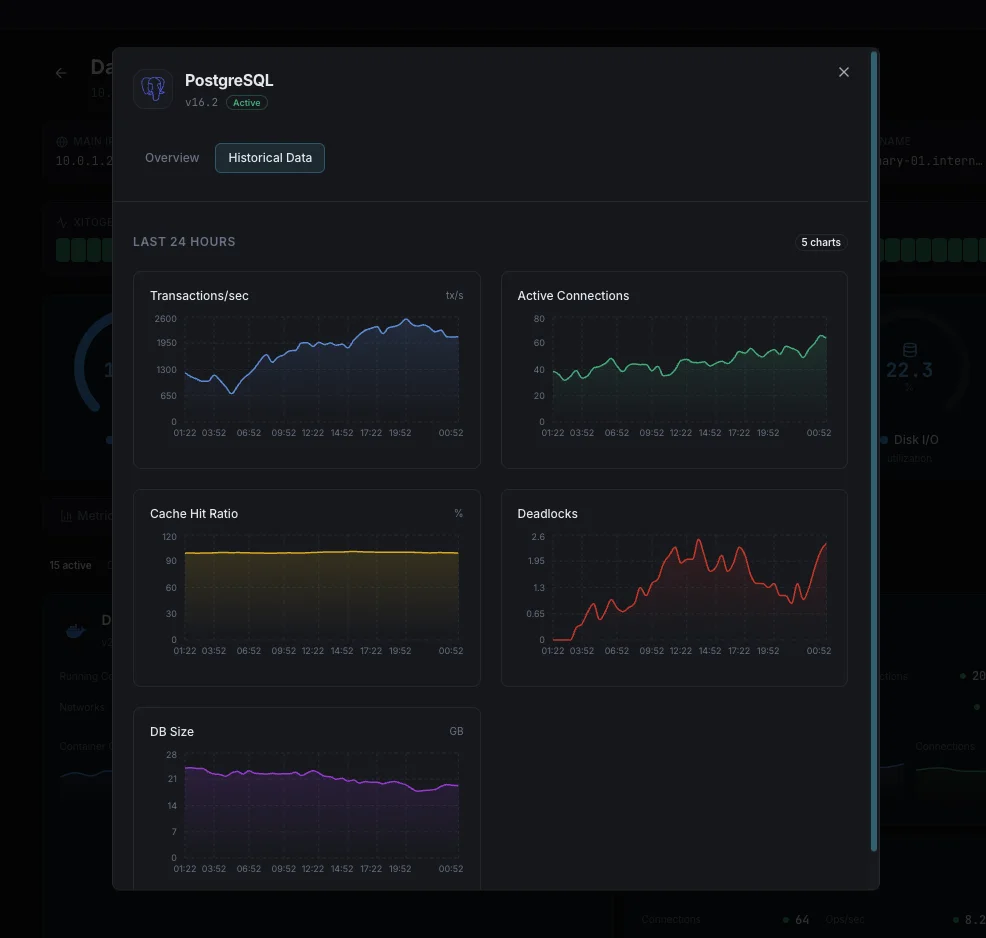
Was wir überwachen
Aktive Verbindungen
Anzahl der derzeit aktiven Verbindungen zum PostgreSQL-Server.
Transaktionen pro Sekunde
Rate der bestätigten und zurückgerollten Transaktionen.
Tupel-Operationen
Rate der eingefügten, aktualisierten, gelöschten und abgerufenen Tupel über alle Datenbanken hinweg.
Tote Tupel
Anzahl der toten Tupel, die auf das Vacuum warten — ein Hinweis auf möglichen Table-Bloat.
Cache-Trefferquote
Anteil der Datenanfragen, die ohne Disk-Zugriff aus den Shared Buffers bedient werden.
Replikationsverzögerung
Bytes oder Sekunden Rückstand gegenüber dem Primary in der Streaming-Replikation.
WAL-Erzeugungsrate
Rate der erzeugten Write-Ahead-Log-Daten.
Lock-Waits
Anzahl der Abfragen, die auf Locks für Datenbankobjekte warten.
Erstellte temporäre Dateien
Anzahl und Größe der für die Abfrageverarbeitung erzeugten temporären Dateien.
Datenbankgröße
Gesamter belegter Speicherplatz je Datenbank einschließlich Indizes.
Inaktiv in Transaktion
Verbindungen, die innerhalb einer offenen Transaktion inaktiv sind und möglicherweise Locks halten.
Checkpoints
Häufigkeit und Dauer von Checkpoint-Operationen.
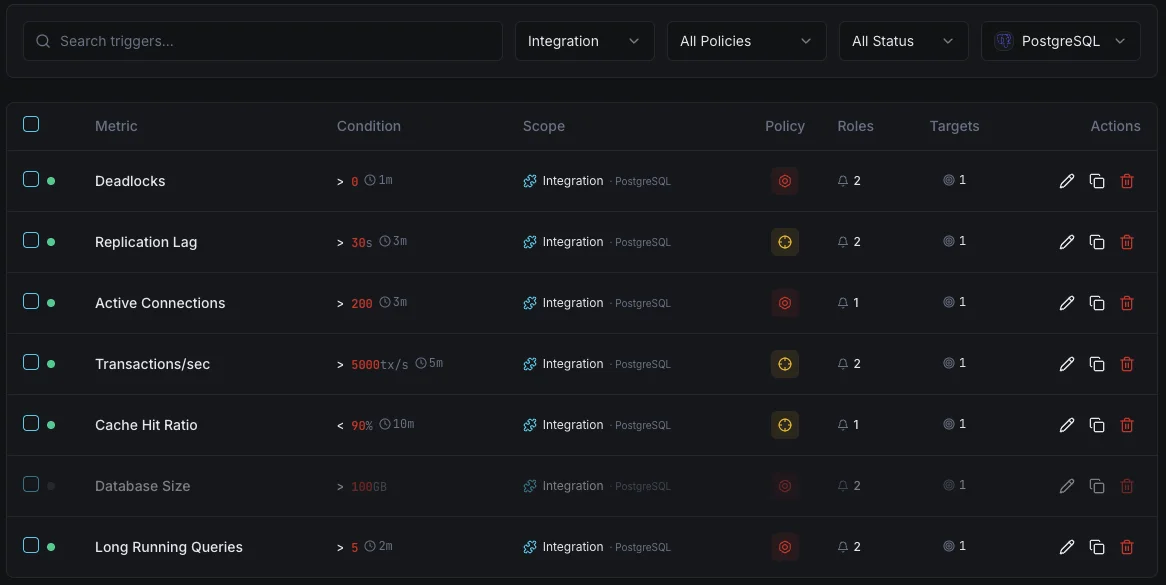
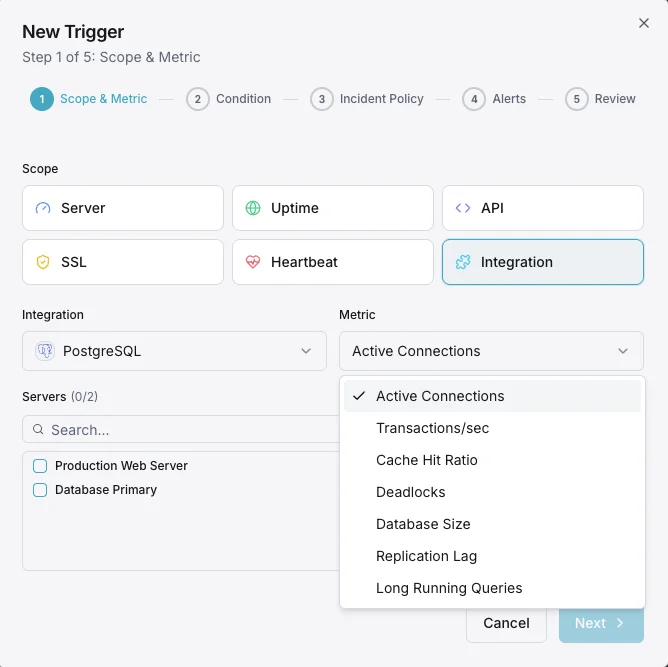
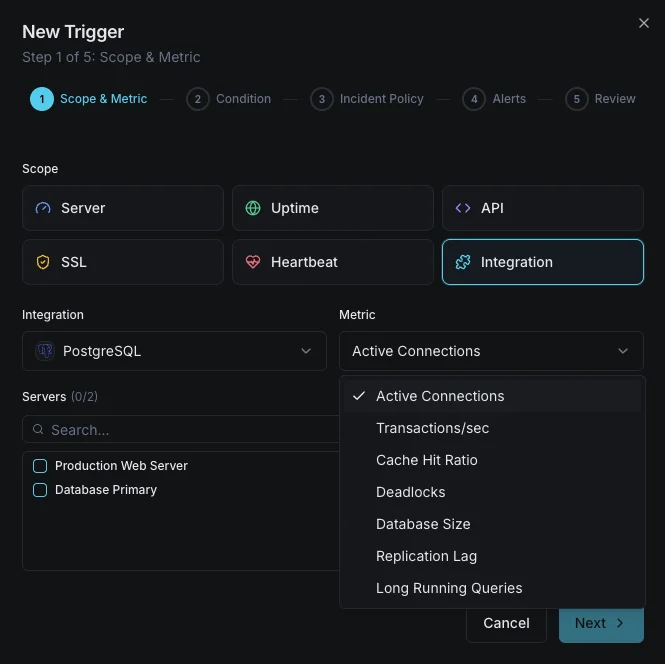
Konfigurierbare Alarmauslöser
Richten Sie benutzerdefinierte Trigger in Ihrem Dashboard ein, um benachrichtigt zu werden, sobald die Kennzahlen von „PostgreSQL“ Ihre festgelegten Schwellenwerte überschreiten.
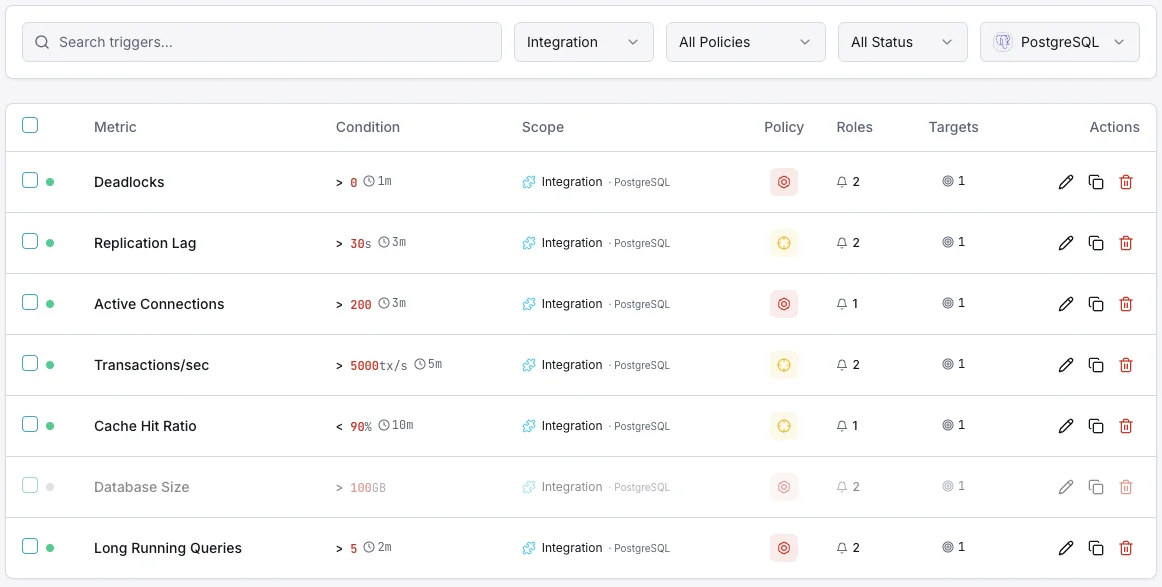
Aktive Verbindungen
entscheidendWird ausgelöst, wenn sich aktive Verbindungen max_connections nähern, wodurch neue Verbindungen abgelehnt werden und Anwendungsfehler drohen.
Replikationsverzögerung
entscheidendWird ausgelöst, wenn die Streaming-Replikation zurückfällt und Dateninkonsistenzen zwischen Primary und Replicas drohen.
Tote Tupel
WarnungWarnt, wenn die Anzahl toter Tupel den Schwellenwert überschreitet — ein Hinweis darauf, dass das Vacuum hinterherhinkt und der Table-Bloat wächst.
Cache-Trefferquote
WarnungWird ausgelöst, wenn die Cache-Trefferquote unter den Schwellenwert fällt und auf erhöhte Disk-I/O und möglichen Speicherdruck hinweist.
Lock-Waits
WarnungWird ausgelöst, wenn Abfragen wegen Locks blockiert sind — ein Hinweis auf leistungsmindernde Konkurrenz.
Einbruch der Transaktionsrate
entscheidendWarnt, wenn der Transaktionsdurchsatz deutlich einbricht — ein Hinweis auf einen möglichen Datenbankhang oder ein Leistungsproblem.
Bedeutung von PostgreSQL-Überwachung
PostgreSQL verarbeitet weltweit geschäftskritische Daten für Unternehmen. Ohne geeignete Überwachung können Table-Bloat, Replikations-Drift und Verbindungserschöpfung zu Datenkorruption, Ausfällen und nicht wiederherstellbaren Fehlern führen.
- Lang laufende Abfragen und Lock-Konkurrenz frühzeitig erkennen
- Table-Bloat durch Verfolgung der Vacuum-Leistung verhindern
- Streaming-Replikation zur Sicherung der Datenkonsistenz überwachen
- Verbindungslecks erkennen, bevor der Pool erschöpft ist
- WAL-Erzeugung verfolgen, um die Speicherkapazität zu planen
Warum entscheiden Sie sich für Xitoring
Xitoring liefert PostgreSQL-Überwachung auf Enterprise-Niveau mit Zero-Config-Setup. Unser schlanker Agent erkennt Ihre PostgreSQL-Instanzen automatisch, beginnt in unter 60 Sekunden mit der Erfassung von Metriken und integriert sich in Ihre bestehenden Benachrichtigungskanäle.
- Installation mit einem einzigen Befehl – keine komplizierten YAML- oder Konfigurationsdateien
- Über 15 globale Überwachungsknoten für Überprüfungen mit geringer Latenz
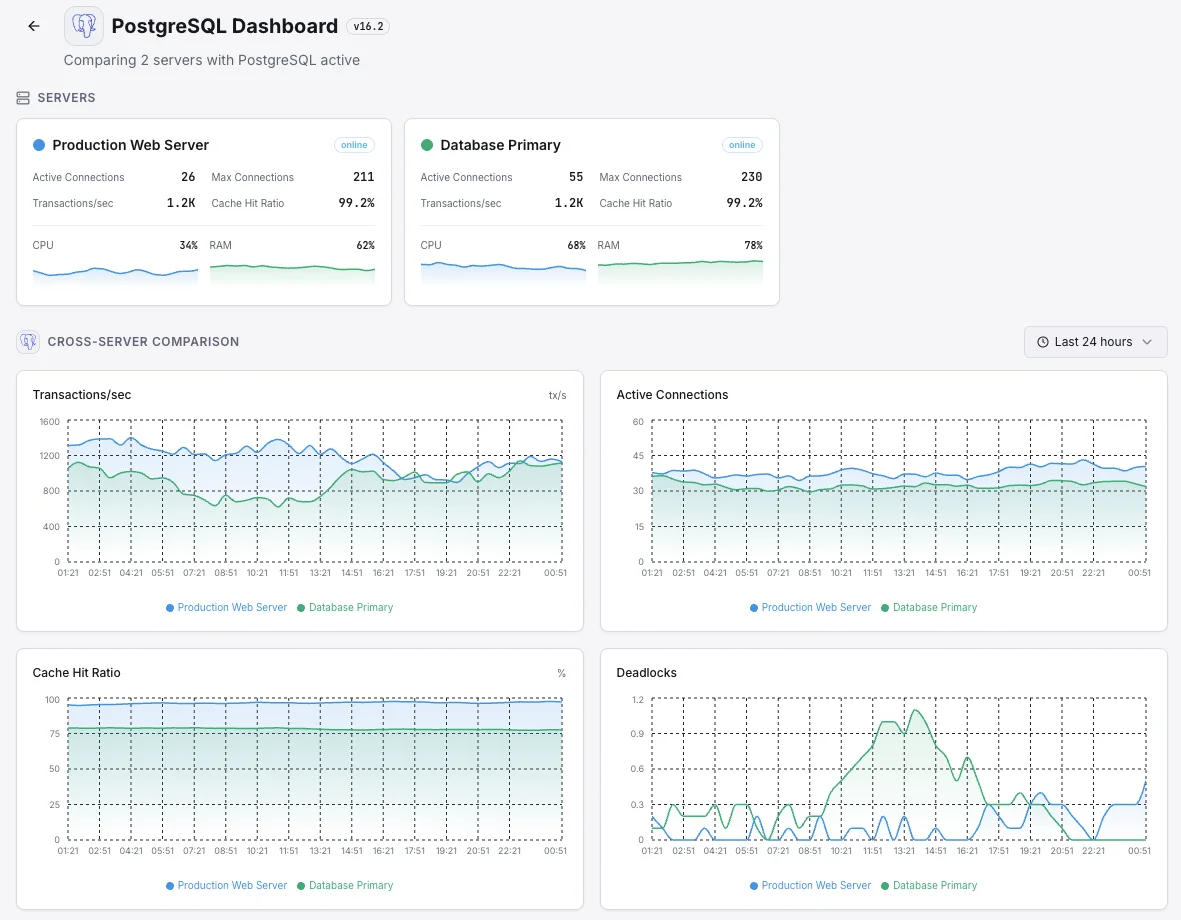
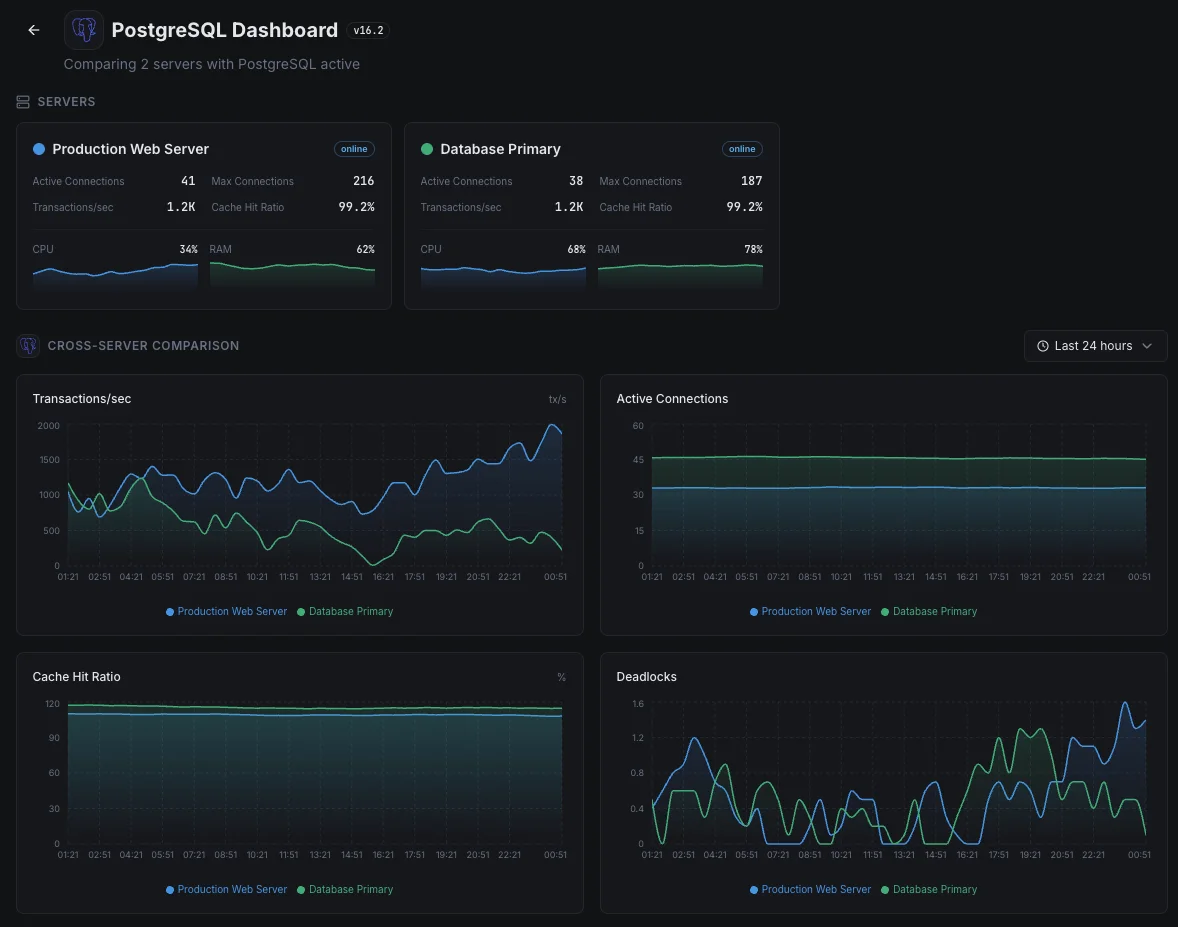
- Einheitliches Dashboard für Server, Datenbanken und Uptime
- Flexible Benachrichtigungen über Slack, PagerDuty, Telegram und weitere Dienste
- Aufbewahrung historischer Daten für die Kapazitätsplanung und Audits
Häufige PostgreSQL-Monitoring- Szenarien
Wo PostgreSQL heute typischerweise läuft – und was schiefgehen könnte, wenn niemand hinsieht.
Verwaltete Cloud-Datenbank (AWS, Azure, Google)
Cloud-Anbieter kümmern sich um Backups und Patches, aber sie sagen Ihnen nicht, wann Ihre eigenen Abfragen langsam sind, Ihre Verbindungen ausgehen oder eine Backup-Kopie stillschweigend hinter der Live-Kopie zurückbleibt. Wir erkennen die Probleme, die der Anbieter Ihnen überlässt, damit ein Ausfall das Team nicht unvorbereitet trifft.
Selbst gehostete Datenbank mit automatischem Failover
Wenn die Hauptdatenbank ausfällt, soll eine Sicherungskopie in Sekundenschnelle übernehmen. Aber ein Backup, das stillschweigend zurückbleibt, kann diese Übergabe in einen 30-sekündigen Ausfall – oder schlimmer noch, Datenverlust – verwandeln. Wir überwachen jede Kopie, damit Sie wissen, dass sie wirklich bereit ist zu übernehmen, bevor Sie sie jemals benötigen.
Datenbank, die in Kubernetes läuft
Datenbanken in Kubernetes werden von der Plattform automatisch verschoben, neu gestartet und aktualisiert. Meistens ist das sicher – wenn nicht, erfahren Sie es normalerweise von frustrierten Benutzern. Wir zeigen die frühen Warnzeichen auf, damit das Team eingreifen kann, bevor ein Routine-Update zu einem Vorfall wird.
Voraussetzungen für PostgreSQL
Stellen Sie sicher, dass diese Punkte erfüllt sind — danach ist die Installation eine Sache von 60 Sekunden.
- PostgreSQL 12 oder neuer (getestet mit 12-16) läuft auf dem Server
- Ein Benutzer mit der Rolle pg_monitor und SELECT auf pg_stat_database
- Optional: pg_stat_statements-Erweiterung geladen für Query-Level-Metriken
Erste Schritte in Minuten
Xitogent auf Ihrem Server installieren
Falls noch nicht geschehen, installieren Sie den ressourcenschonenden Xitogent-Monitoring-Agenten auf Ihrem Server.
curl -s https://xitoring.com/install.sh | sudo bash -s -- --key=YOUR_API_KEYMonitoring-Benutzer in PostgreSQL anlegen
Legen Sie einen dedizierten, schreibgeschützten Benutzer an, damit Xitogent Metriken erfassen kann:
CREATE USER xitoring WITH PASSWORD 'your_secure_password';
GRANT pg_monitor TO xitoring;
GRANT SELECT ON pg_stat_database TO xitoring;PostgreSQL-Integration aktivieren
Aktivieren Sie die PostgreSQL-Integration über das Xitoring-Dashboard oder die CLI mit den Monitoring-Anmeldedaten.
sudo xitogent integrateAlarmschwellen konfigurieren (optional)
Legen Sie eigene Schwellenwerte für Metriken wie Replikations-Lag, Dead Tuples oder Verbindungsanzahl fest, um benachrichtigt zu werden, wenn etwas Aufmerksamkeit benötigt.
Funktion überprüfen
Führen Sie diesen Befehl auf dem Server aus, um zu bestätigen, dass Xitogent die Integration erkannt hat. Innerhalb von etwa 30 Sekunden werden frische Metriken in Ihr Dashboard gestreamt.
sudo xitogent statusErwägen Sie Alternativen?
Sehen Sie, wie sich Xitoring gegen die Alternativen für PostgreSQL-Monitoring schlägt — Pauschalpreise, tiefere Integrationen und ein Agent, der Ihren gesamten Stack abdeckt.


Häufig gestellte Fragen
Welche Berechtigungen benötigt der Überwachungsbenutzer?
Wird diese Integration die Leistung von PostgreSQL beeinträchtigen?
Kann ich die PostgreSQL-Replikation überwachen?
Funktioniert das auch mit verwaltetem PostgreSQL (RDS, Cloud SQL)?
Welche PostgreSQL-Versionen werden unterstützt?
Wie oft werden Kennzahlen erfasst?
Wie überwache ich Connection-Pool-Erschöpfung und Idle-in-Transaction-Sessions?
Funktioniert das mit managed PostgreSQL (RDS, Cloud SQL, Azure)?
Welche PostgreSQL-Versionen werden unterstützt?
PostgreSQL überwachen heute
In weniger als 60 Sekunden eingerichtet. Keine Kreditkarte erforderlich. Umfassende Kennzahlen vom ersten Tag an.
Kostenlose Testversion starten