Elasticsearch Monitorização
Monitorize o estado do cluster do Elasticsearch, as taxas de indexação, a utilização da memória da JVM e a latência de pesquisa em tempo real, sem necessidade de configuração.
Por que monitorizar Elasticsearch?
O Elasticsearch suporta funções de pesquisa, registo e análise para milhares de organizações em todo o mundo. A monitorização do Elasticsearch é fundamental para manter o bom funcionamento do cluster, otimizar o rendimento da indexação, acompanhar a latência das pesquisas e evitar o esgotamento da memória da JVM. A integração do Elasticsearch com o Xitoring oferece uma visibilidade aprofundada de todos os aspetos do seu cluster.
Monitorização do Elasticsearch, explicada
A monitorização do Elasticsearch deteta degradação do cluster (estado yellow / red), shards não atribuídos, pressão de heap JVM, picos de pausa de GC e rejeições de thread pool antes que provoquem outages de pesquisa, falhas de ingestão ou perda de dados. Para pipelines de logs ELK, workloads de pesquisa vetorial e qualquer cluster de produção, a visibilidade por nó é o que separa uma recuperação automática de 30 segundos de um outage em todo o cluster. O Xitoring deteta automaticamente o seu Elasticsearch, consulta as APIs nativas com um utilizador cluster:monitor e encaminha alertas para Slack, PagerDuty, Telegram ou o seu on-call existente.
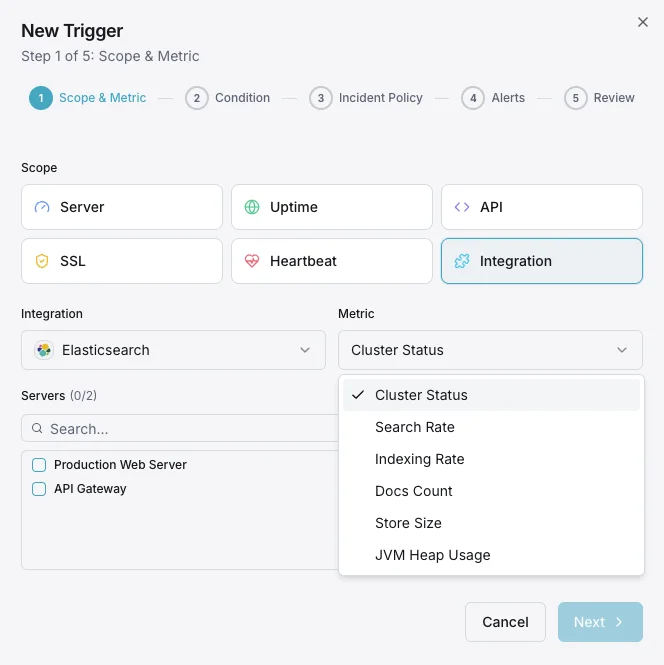
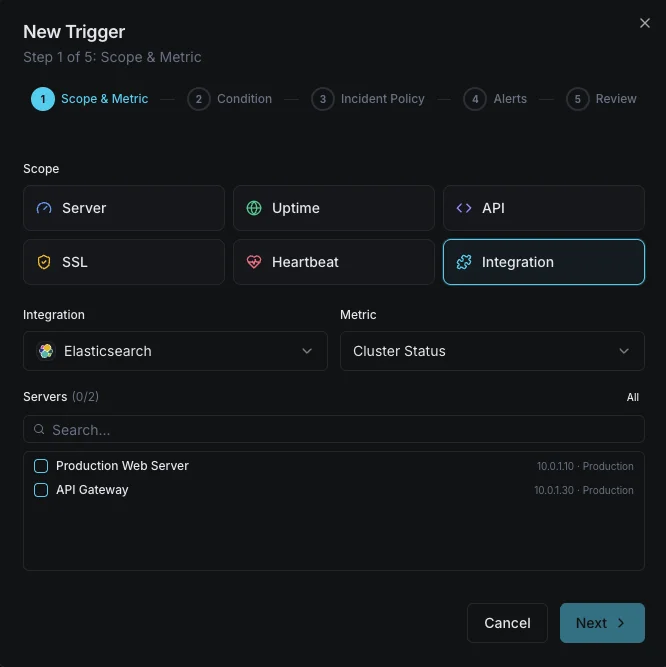
O que monitorizamos
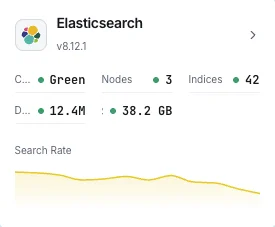
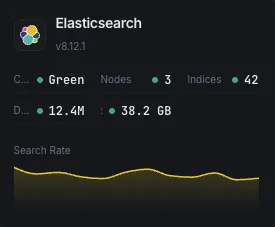
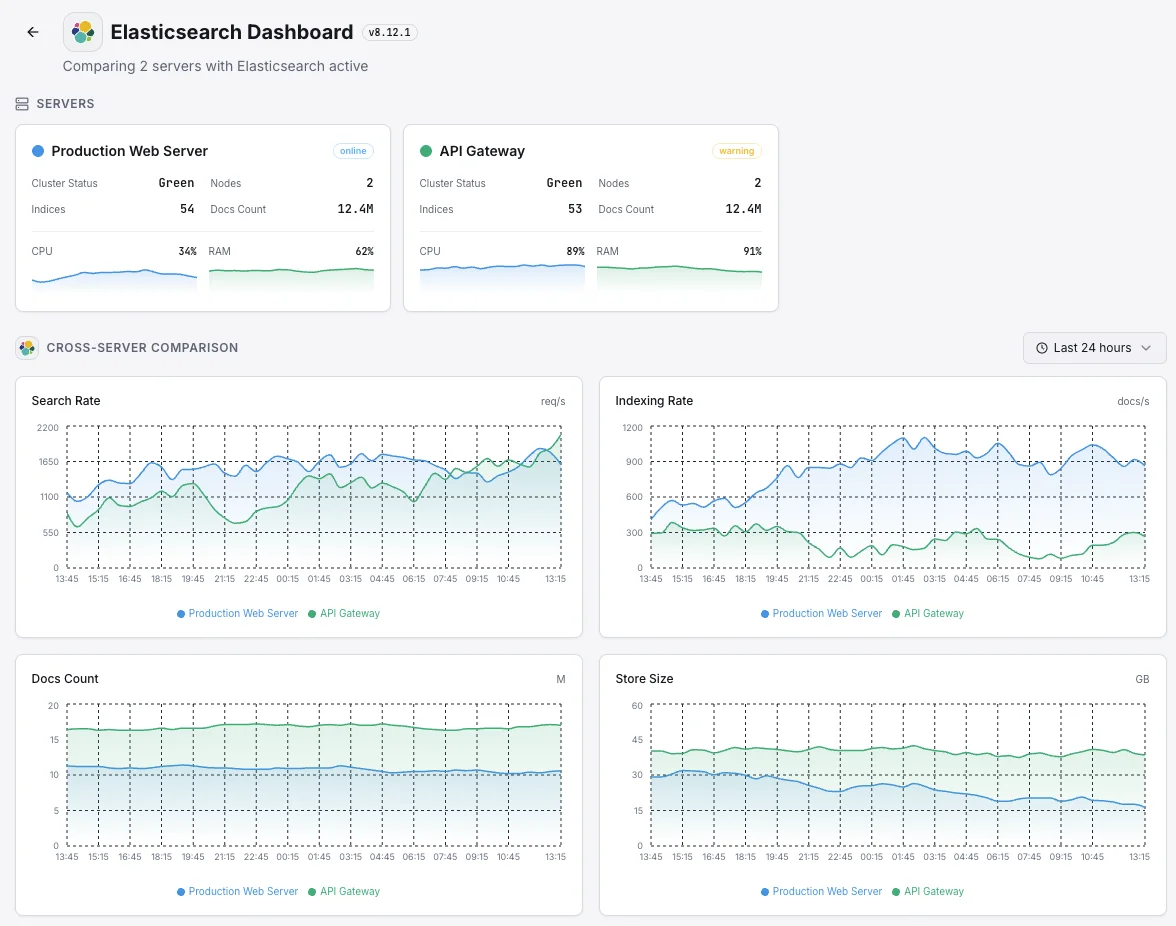
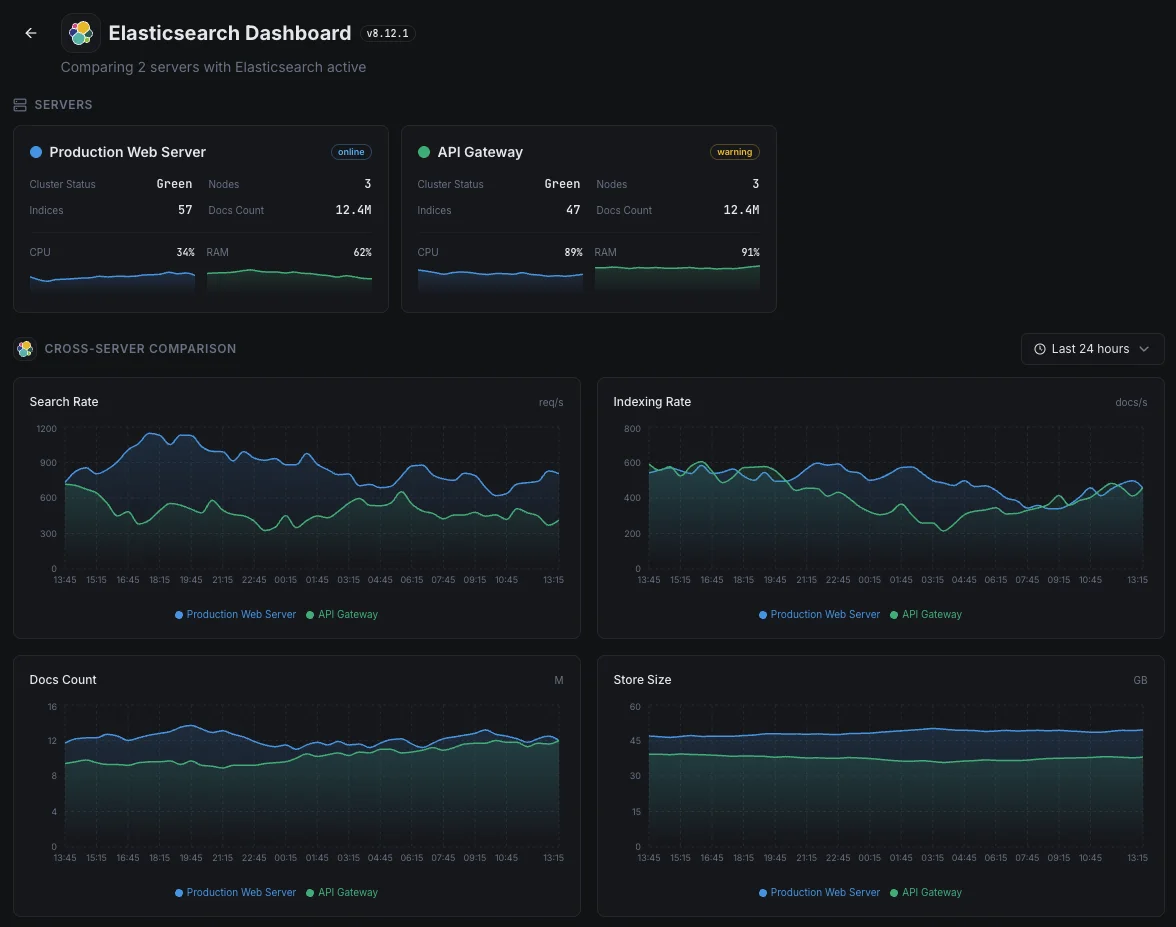
Saúde do cluster
Estado global do cluster (verde/amarelo/vermelho) e número de shards ativos.
Utilização de heap JVM
Heap usado, committed e máximo em todos os nós com estatísticas de GC.
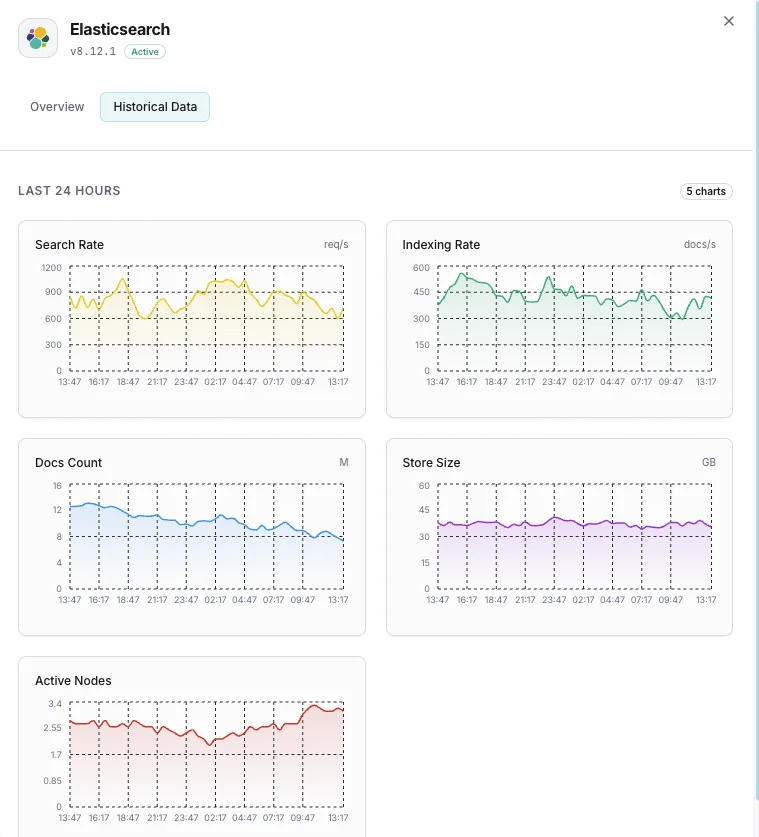
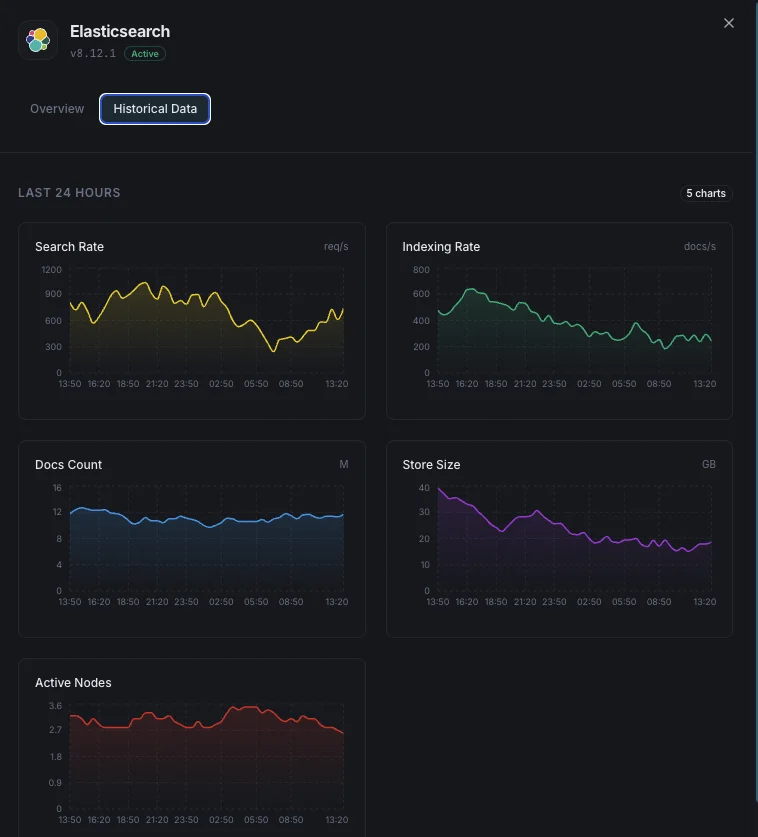
Taxa de indexação
Documentos indexados por segundo no cluster.
Taxa de pesquisa
Consultas de pesquisa por segundo e latência média de pesquisa.
Número de shards
Shards ativos, em relocação, em inicialização e não atribuídos.
Tarefas pendentes
Tarefas pendentes ao nível do cluster que podem indicar estrangulamentos.
Utilização de CPU
Utilização de CPU por nó e load averages ao nível do SO.
Utilização de disco
Armazenamento usado por nó e espaço em disco disponível.
Pool de threads
Tarefas ativas, em fila e rejeitadas em cada pool de threads.
Circuit breakers
Estimativas de memória e contagens de trip para os breakers request/fielddata/in-flight.
Número de segmentos
Número de segmentos Lucene e atividade de merge.
Cache fielddata
Tamanho da cache fielddata e contagem de evictions.
Configurável condições de alerta
Configure alertas personalizados no seu painel para ser notificado assim que as métricas dElasticsearch ultrapassarem os limites que definiu.
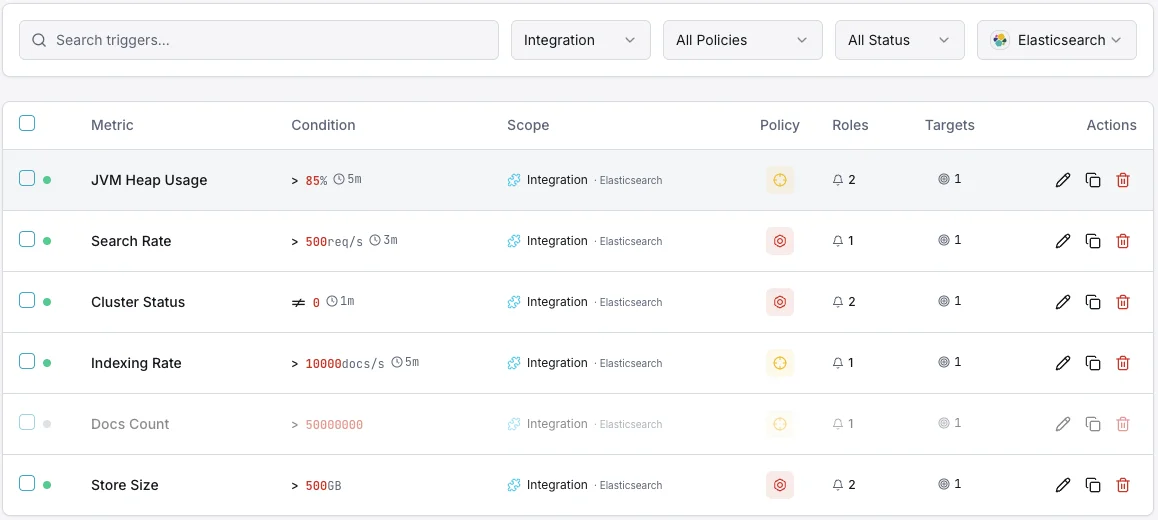
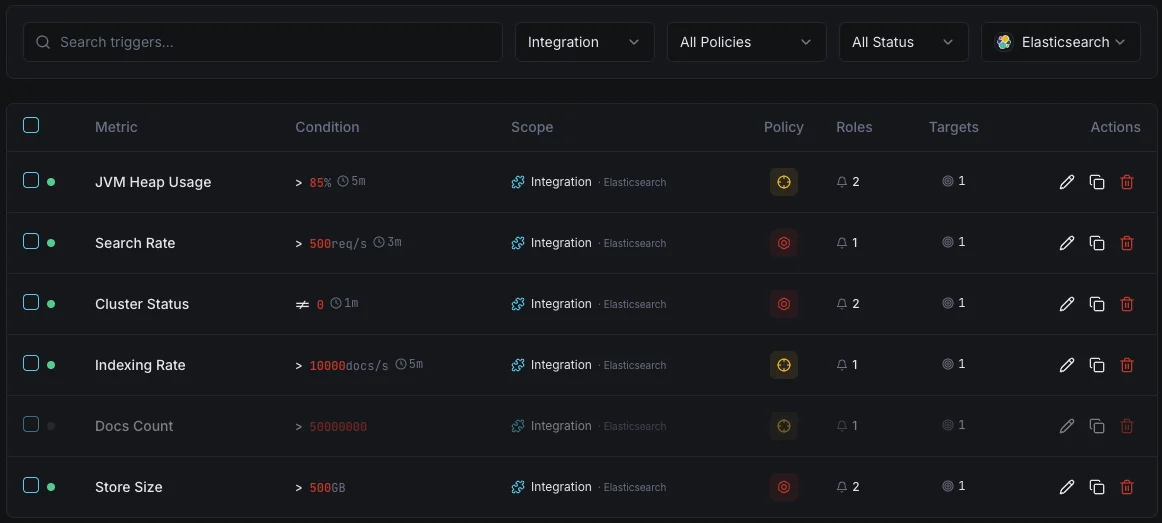
Saúde do cluster
críticoDispara quando o estado do cluster degrada para amarelo ou vermelho, indicando problemas de alocação de shards.
Utilização de heap JVM
críticoDispara quando a utilização de heap JVM excede o limite, arriscando erros out-of-memory e instabilidade de nós.
Taxa de indexação
avisoAlerta quando o throughput de indexação cai abaixo da baseline, indicando problemas no pipeline de ingestão.
Latência de pesquisa
avisoDispara quando a latência média de pesquisa excede o limite, degradando a qualidade da pesquisa para os utilizadores.
Shards não atribuídos
críticoDispara quando os shards permanecem não atribuídos, deixando dados sub-replicados e em risco.
Rejeições do pool de threads
avisoAlerta quando as filas do pool de threads transbordam e começam a rejeitar pedidos.
Importância da monitorização do Elasticsearch
O Elasticsearch sustenta a funcionalidade de pesquisa, a agregação de logs e a analítica em tempo real. Sem monitorização, a degradação do cluster, a pressão de JVM e os shards não atribuídos podem evoluir para interrupções de pesquisa e perda de dados.
- Detete a degradação da saúde do cluster antes que afete a disponibilidade da pesquisa
- Monitorize o heap JVM para evitar crashes out-of-memory
- Acompanhe o throughput de indexação para garantir pipelines de ingestão saudáveis
- Identifique shards não atribuídos que deixam os dados sub-replicados
- Otimize a latência de pesquisa para aplicações voltadas ao utilizador
Porquê escolher Xitoring
O Xitoring oferece monitorização Elasticsearch de nível empresarial com configuração zero-config. O nosso agente leve deteta automaticamente os seus nós Elasticsearch, começa a recolher métricas em menos de 60 segundos e integra-se com os seus canais de notificação existentes.
- Instalação num único comando — sem YAML complexo nem ficheiros de configuração
- Mais de 15 nós de monitorização globais para verificações de baixa latência
- Dashboard unificado para servidores, clusters de pesquisa e uptime
- Alertas flexíveis via Slack, PagerDuty, Telegram e outros
- Retenção de dados históricos para planeamento de capacidade e auditorias
Cenários comuns de monitorização do Elasticsearch
Onde o Elasticsearch normalmente é executado hoje — e o que poderia correr mal se ninguém estivesse a monitorizar.
Registos e dados de observabilidade
Quando aplicações e servidores transmitem os seus registos para o Elasticsearch, qualquer atraso ou rejeição significa que partes da imagem estão em falta — exatamente quando um incidente as torna mais necessárias. Detetamos o gargalo enquanto é pequeno, para que o histórico de diagnóstico da equipa permaneça completo.
Pesquisa para websites, aplicações e funcionalidades de IA
Quando a pesquisa alimenta um website, uma aplicação ou uma funcionalidade de IA, uma consulta lenta prejudica diretamente a experiência do utilizador e as conversões. Monitorizamos os tempos de resposta e a capacidade para que uma desaceleração da pesquisa possa ser corrigida antes que se torne um problema de receita ou de produto.
Pesquisa gerida na AWS ou noutra cloud
Os fornecedores de cloud executam o serviço por si, mas não lhe dizem quando a sua própria carga de trabalho o está a sobrecarregar ou as suas consultas estão a começar a abrandar. Fechamos essa lacuna de visibilidade para que o custo e o desempenho permaneçam sob o seu controlo.
Pré-requisitos para Elasticsearch
Certifique-se de que tem tudo isto pronto — depois disso, a maioria das instalações leva 60 segundos.
- Elasticsearch 7.x ou 8.x acessível na sua porta REST (predefinida 9200)
- Um utilizador de monitorização com privilégios cluster:monitor se a segurança estiver ativada
- Configuração TLS/CA disponível para o Xitogent se for necessário HTTPS
Comece a minutos
Instalar o Xitogent no seu servidor
Se ainda não o fez, instale o leve agente de monitorização Xitogent no seu servidor.
curl -s https://xitoring.com/install.sh | sudo bash -s -- --key=YOUR_API_KEYVerificar a acessibilidade da API do Elasticsearch
O Xitogent usa a API REST do Elasticsearch para recolher métricas. Verifique se o cluster é acessível:
curl -s http://localhost:9200/_cluster/health | python3 -m json.toolAtivar a integração do Elasticsearch
Use o painel do Xitoring ou a CLI para ativar a integração do Elasticsearch.
sudo xitogent integrateConfigurar limiares de alerta (opcional)
Defina limiares personalizados para saúde do cluster, heap da JVM ou taxa de indexação para ser notificado quando algo merecer atenção.
Confirme que está a funcionar
Execute este comando no servidor para confirmar que o Xitogent detetou a integração. Em cerca de 30 segundos começam a chegar novas métricas ao seu painel.
sudo xitogent statusEstá a considerar alternativas?
Veja como o Xitoring se compara às alternativas para a monitorização de Elasticsearch — preços fixos, integrações mais profundas e um único agente que cobre toda a sua stack.


Frequentemente perguntas feitas
A integração requer autenticação?
Esta integração afetará o desempenho do Elasticsearch?
Posso monitorizar clusters com vários nós?
Posso monitorizar o OpenSearch?
Quais são as versões do Elasticsearch compatíveis?
Com que frequência são recolhidos os indicadores?
O que é uma thread pool de search e como monitorizo rejeições?
Monitorização Elasticsearch vs OpenSearch — o que muda?
Que versões do Elasticsearch são suportadas?
Comece a monitorizar Elasticsearch hoje
Configure em menos de 60 segundos. Não é necessário cartão de crédito. Estatísticas completas desde o primeiro dia.
Iniciar período de avaliação gratuitaContinue a explorar