MSSQL Monitorização
Monitorize o desempenho das consultas do Microsoft SQL Server, as estatísticas de espera, a cache de buffer e o estado do registo de transações em tempo real, sem necessidade de configuração.
Por que monitorizar MSSQL?
O Microsoft SQL Server está na base de aplicações empresariais, armazéns de dados e plataformas de inteligência empresarial em todo o mundo. A monitorização do MSSQL é essencial para otimizar os planos de execução de consultas, acompanhar as estatísticas de espera, gerir a eficiência da cache de buffer e detetar impasses. A integração do MSSQL da Xitoring oferece uma visibilidade abrangente das suas instâncias do SQL Server.
Monitorização do SQL Server, explicada
A monitorização do SQL Server deteta cadeias de blocking, tempestades de deadlocks, derivas em Always On AG, pressão de memória e regressões de planos no Query Store antes que provoquem lentidão visível aos utilizadores ou eventos de failover em HA. Para Dynamics 365, SharePoint, ERP e qualquer carga SQL empresarial, a visibilidade de wait-stats por base de dados e do Query Store é o que separa uma correção de tuning limpa de uma caça de várias dias à causa raiz. O Xitoring deteta automaticamente o seu SQL Server, lê DMVs nativas com a permissão VIEW SERVER STATE e encaminha alertas para Slack, PagerDuty, Telegram ou o seu sistema on-call existente.
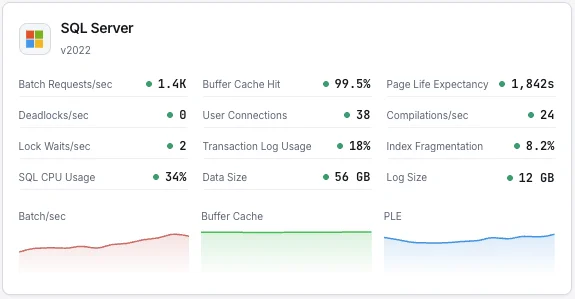
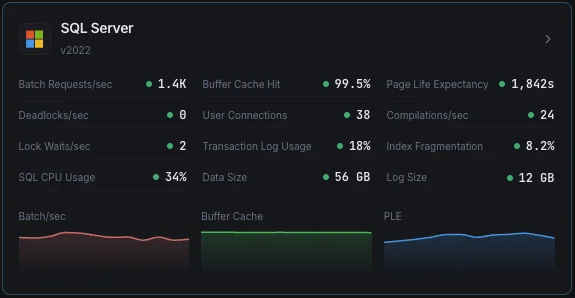
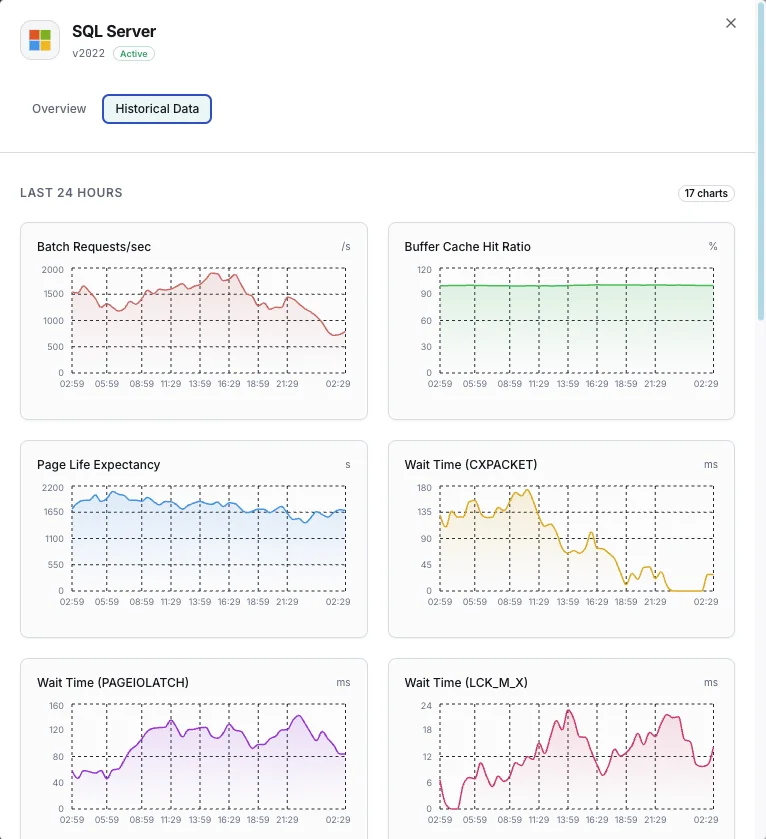
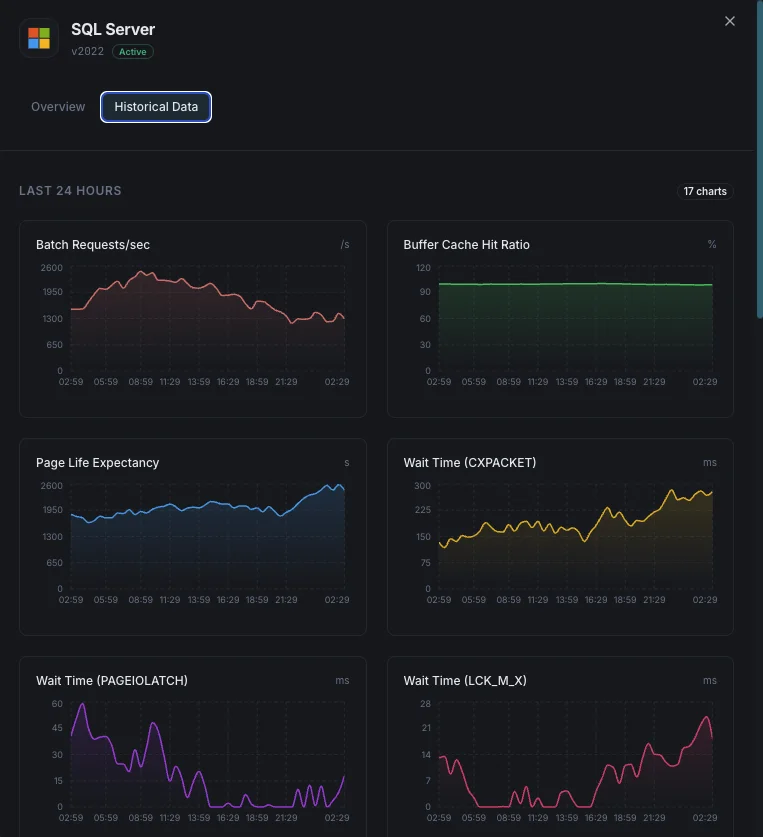
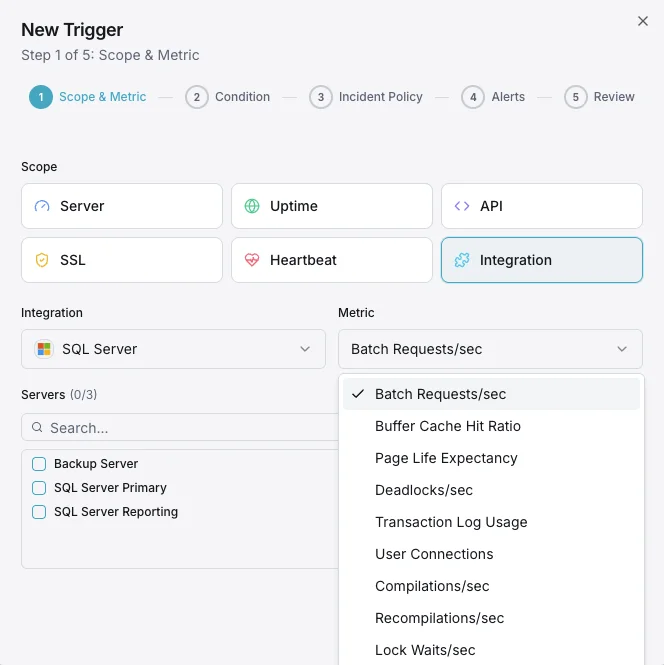
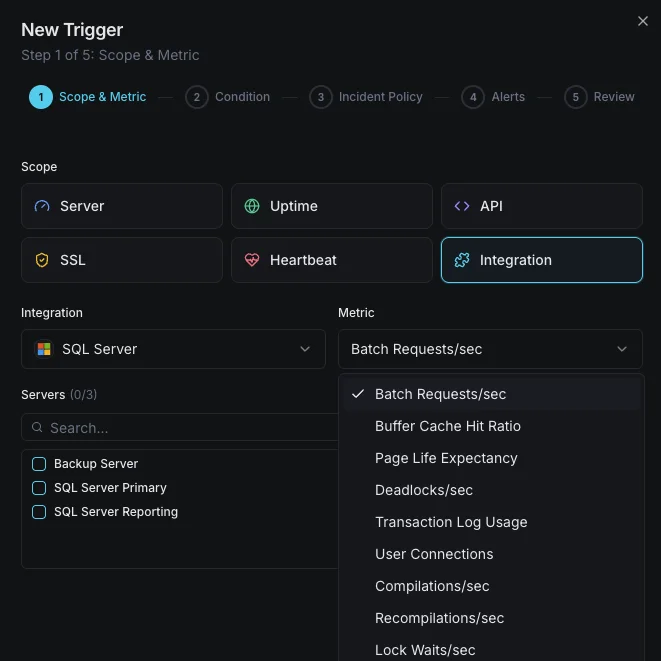
O que monitorizamos
Batch Requests/s
Número de batch requests SQL recebidos por segundo.
Rácio de hit do buffer cache
Percentagem de leituras de página satisfeitas a partir do buffer pool vs leituras físicas em disco.
Page Life Expectancy
Tempo médio (segundos) que uma página permanece no buffer pool — valores baixos indicam pressão de memória.
Estatísticas de espera
Principais tipos de wait e durações que indicam estrangulamentos de recursos.
Deadlocks/s
Número de pedidos de lock que resultaram em deadlocks.
Utilização do transaction log
Percentagem de espaço de transaction log utilizado por base de dados.
Ligações de utilizador
Número de ligações de utilizador ativas para a instância SQL Server.
Compilações/s
Número de compilações e recompilações SQL por segundo.
Lock Waits/s
Número de pedidos de lock que exigiram espera ao chamador.
Fragmentação de índices
Nível de fragmentação dos índices entre bases de dados.
Utilização de CPU
Utilização de CPU do processo SQL Server vs CPU total do sistema.
Tamanho da base de dados
Tamanhos dos ficheiros de dados e log para cada base de dados.
Configurável condições de alerta
Configure alertas personalizados no seu painel para ser notificado assim que as métricas dMSSQL ultrapassarem os limites que definiu.
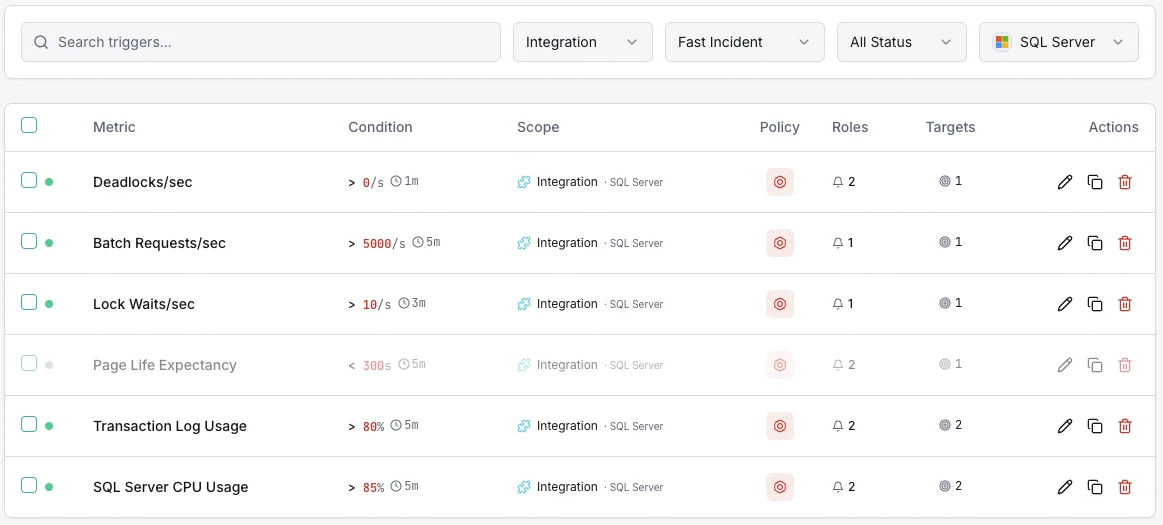
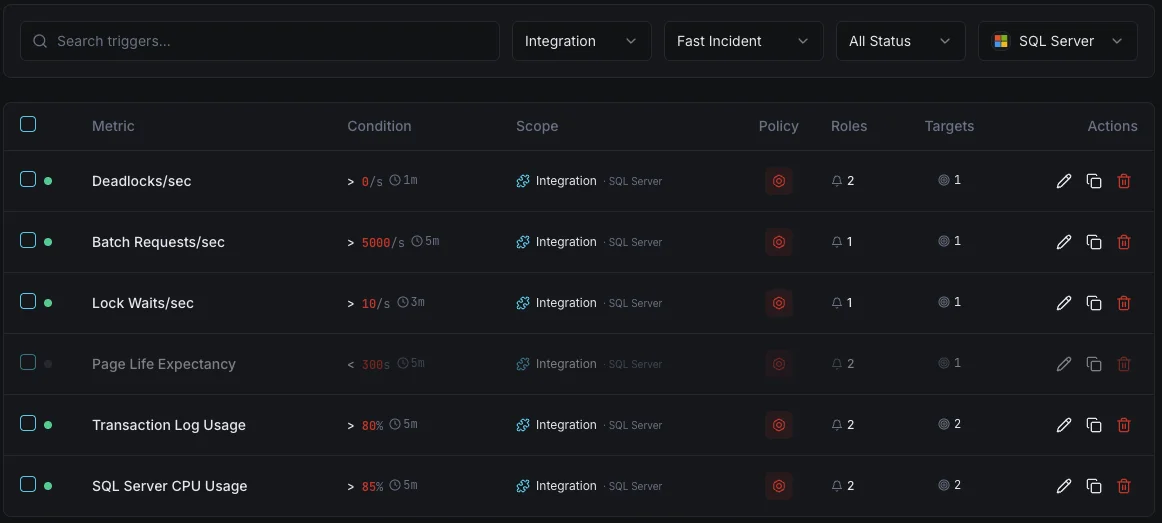
Rácio de hit do buffer cache
críticoDispara quando o rácio de hit do cache cai abaixo do limite, indicando memória insuficiente para a carga de trabalho.
Page Life Expectancy
avisoDispara quando o PLE cai abaixo do limite, indicando que as páginas são removidas da memória demasiado rapidamente.
Impasses
críticoAlerta quando a taxa de deadlocks excede o limite, indicando contenção de locks nas consultas da aplicação.
Utilização do transaction log
críticoDispara quando a utilização do transaction log excede o limite, arriscando falhas de escrita.
Ligações de utilizador
avisoDispara quando o número de ligações se aproxima dos limites, arriscando erros connection refused.
Estatísticas de espera
avisoAlerta quando wait types específicos sobem rapidamente, indicando estrangulamentos de recursos (CPU, E/S, memória, locks).
Importância da monitorização do MSSQL
O SQL Server executa cargas de trabalho empresariais de missão crítica — desde sistemas ERP e bases de dados financeiras até plataformas de e-commerce. Sem monitorização, pressão sobre buffers, deadlocks e bloat do transaction log podem causar interrupções e corrupção de dados.
- Detete a pressão de memória através de métricas de buffer cache e PLE
- Monitorize as estatísticas de wait para identificar a causa raiz das lentidões
- Acompanhe os deadlocks para corrigir problemas de locking ao nível da aplicação
- Garanta espaço no transaction log para operações de escrita ininterruptas
- Otimize a utilização de índices para manter o desempenho das consultas ao longo do tempo
Porquê escolher Xitoring
O Xitoring oferece monitorização SQL Server de nível empresarial com configuração zero-config. O nosso agente leve deteta automaticamente as suas instâncias MSSQL, começa a recolher métricas em menos de 60 segundos e integra-se com os seus canais de notificação existentes.
- Suporte nativo para Windows Server com instalador simples
- Mais de 15 nós de monitorização globais para verificações de baixa latência
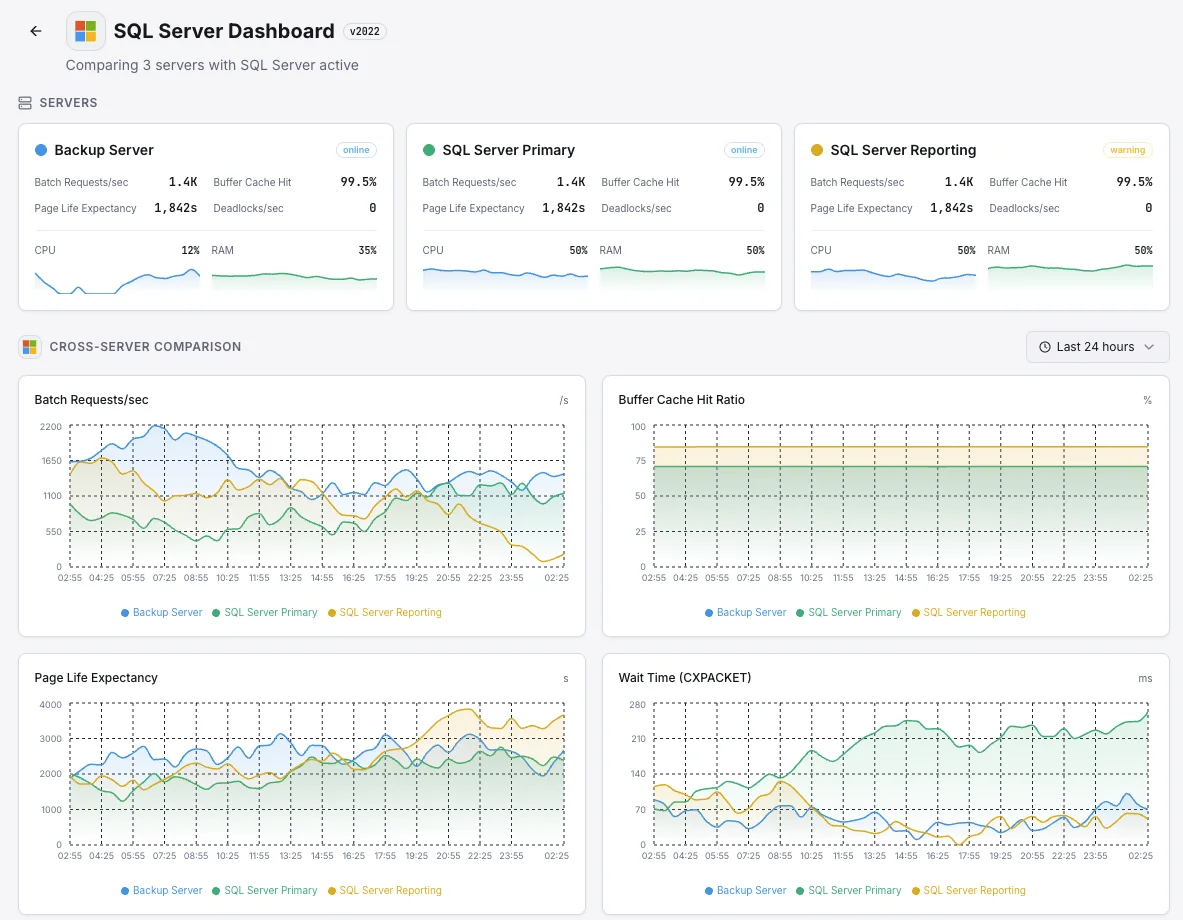
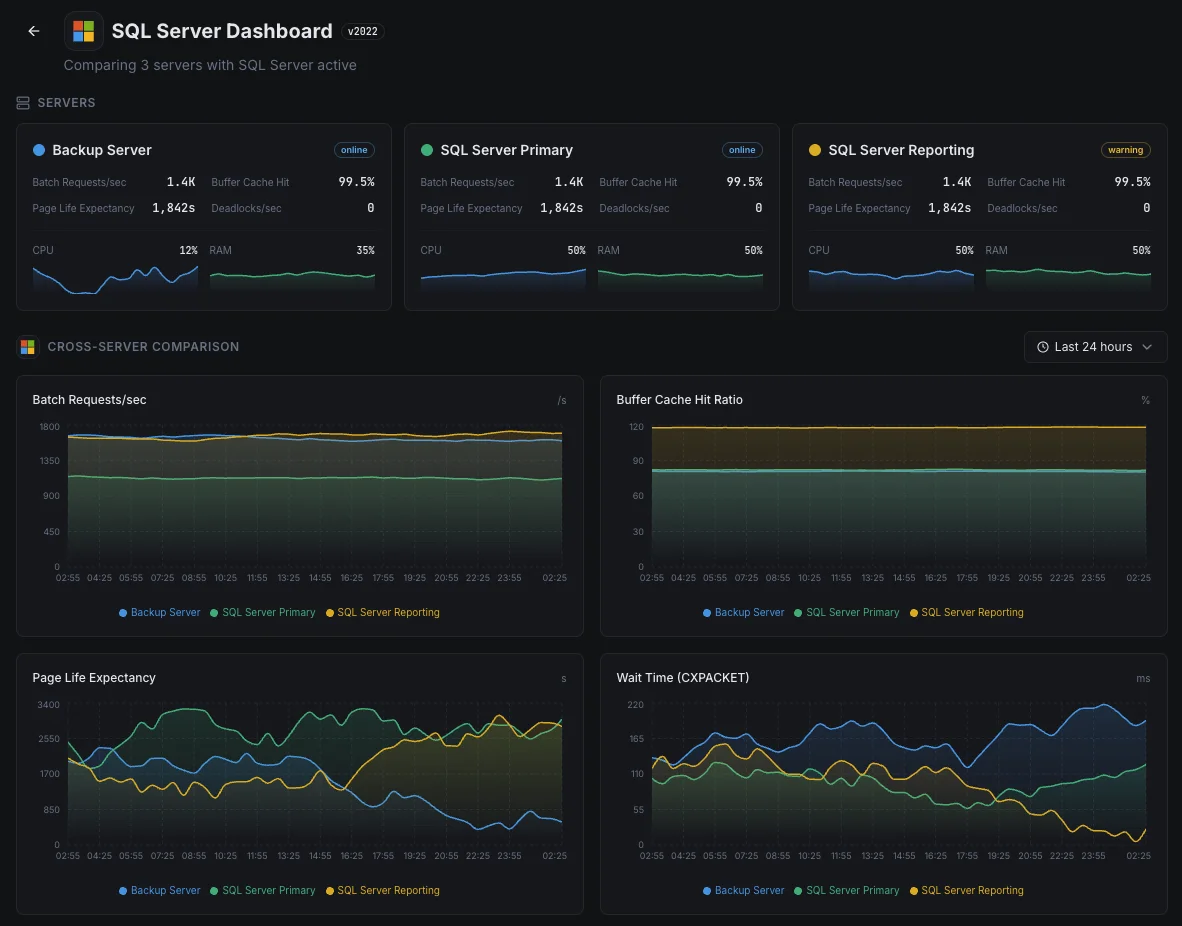
- Dashboard unificado para servidores, bases de dados e uptime
- Alertas flexíveis via Slack, PagerDuty, Telegram e outros
- Retenção de dados históricos para planeamento de capacidade e auditorias
Cenários comuns de monitorização do SQL Server
Onde o SQL Server normalmente é executado hoje — e o que pode correr mal se ninguém estiver a monitorizar.
Aplicações de negócios e sistemas ERP
Quando o SQL Server executa aplicações de negócios críticas — finanças, RH, vendas — uma base de dados lenta torna-se uma empresa lenta. Nós monitorizamos os sinais que mostram quando a base de dados está a começar a ter dificuldades para que a equipa possa corrigi-lo antes que os funcionários comecem a ligar para o suporte de TI.
Bases de dados de backup para recuperação de desastres
As empresas executam cópias extra das suas bases de dados — muitas vezes noutra região — para que uma única falha não tire o negócio do ar. Quando essas cópias ficam atrasadas, a recuperação perderia mais dados do que o esperado. Nós monitorizamos cada cópia para que o plano de recuperação de desastres ainda funcione no dia em que realmente precisar dele.
SQL Server na cloud ou em Linux
Quer o SQL Server seja executado no Azure, em Linux, ou algures no meio, a visibilidade que obtém apenas da plataforma raramente é suficiente. Nós detetamos abrandamentos de consultas e outros problemas internos para que tanto o custo quanto o desempenho permaneçam sob o seu controlo.
Pré-requisitos para MSSQL
Certifique-se de que tem tudo isto pronto — depois disso, a maioria das instalações leva 60 segundos.
- Microsoft SQL Server 2012 ou mais recente (2022+ para a métrica size_on_disk_bytes)
- Um login SQL com as permissões CONNECT ANY DATABASE, VIEW SERVER STATE, VIEW ANY DEFINITION e SELECT
- TCP/IP ativado na instância, com a porta acessível a partir do Xitogent
Comece a minutos
Instalar o Xitogent no seu servidor Windows
Descarregue e instale o agente Xitogent no seu Windows Server que aloja o SQL Server.
# Download from https://xitoring.com/xitogent
# Run the installer as AdministratorConfigurar o acesso ao SQL Server
Crie um login dedicado para monitorização com privilégios mínimos:
CREATE LOGIN xitoring WITH PASSWORD = 'your_password';
CREATE USER xitoring FOR LOGIN xitoring;
GRANT CONNECT ANY DATABASE TO xitoring;
GRANT VIEW SERVER STATE TO xitoring;
GRANT VIEW ANY DEFINITION TO xitoring;
GRANT SELECT TO xitoring;Ativar a integração do MSSQL
Use o painel do Xitoring ou a CLI para ativar a integração do MSSQL.
xitogent integrateConfigurar limiares de alerta (opcional)
Defina limiares personalizados para rácio de hit do buffer cache, page life expectancy ou número de deadlocks para ser notificado quando algo merecer atenção.
Confirme que está a funcionar
Execute este comando no servidor para confirmar que o Xitogent detetou a integração. Em cerca de 30 segundos começam a chegar novas métricas ao seu painel.
sudo xitogent statusEstá a considerar alternativas?
Veja como o Xitoring se compara às alternativas para a monitorização de MSSQL — preços fixos, integrações mais profundas e um único agente que cobre toda a sua stack.


Frequentemente perguntas feitas
A integração é compatível com o SQL Server no Linux?
Esta integração afetará o desempenho do SQL Server?
Posso monitorizar várias instâncias?
Posso monitorizar o Azure SQL Database?
Quais são as versões do SQL Server suportadas?
Com que frequência são recolhidos os indicadores?
Como deteto deadlocks no SQL Server?
Como monitorizo a saúde dos backups do SQL Server?
Que versões do SQL Server são suportadas?
Comece a monitorizar MSSQL hoje
Configure em menos de 60 segundos. Não é necessário cartão de crédito. Estatísticas completas desde o primeiro dia.
Iniciar período de avaliação gratuitaContinue a explorar