Elasticsearch Monitoraggio
Monitora in tempo reale lo stato di salute del cluster Elasticsearch, i tassi di indicizzazione, l'utilizzo dell'heap della JVM e la latenza delle ricerche senza alcuna configurazione.
Perché monitorare Elasticsearch?
Elasticsearch è alla base delle funzionalità di ricerca, registrazione e analisi di migliaia di organizzazioni in tutto il mondo. Il monitoraggio di Elasticsearch è fondamentale per garantire lo stato di salute del cluster, ottimizzare la velocità di indicizzazione, monitorare la latenza delle ricerche e prevenire l'esaurimento dell'heap della JVM. L'integrazione di Elasticsearch offerta da Xitoring garantisce una visibilità approfondita su ogni aspetto del cluster.
Monitoring di Elasticsearch, spiegato
Il monitoring di Elasticsearch intercetta il degrado del cluster (stato yellow / red), gli shard unassigned, la pressione sull’heap JVM, i picchi di pausa GC e i reject dei thread pool prima che causino outage di search, fallimenti di ingest o perdita di dati. Per pipeline di log ELK, workload di vector search e qualsiasi cluster di produzione, la visibilità per nodo è ciò che separa un auto-recovery di 30 secondi da un outage a livello di cluster. Xitoring rileva automaticamente il suo Elasticsearch, interroga le API native con un utente cluster:monitor e instrada gli alert verso Slack, PagerDuty, Telegram o il suo on-call esistente.
Ciò che monitoriamo
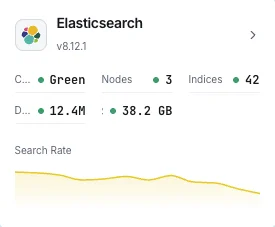
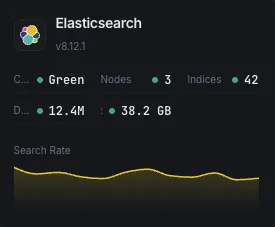
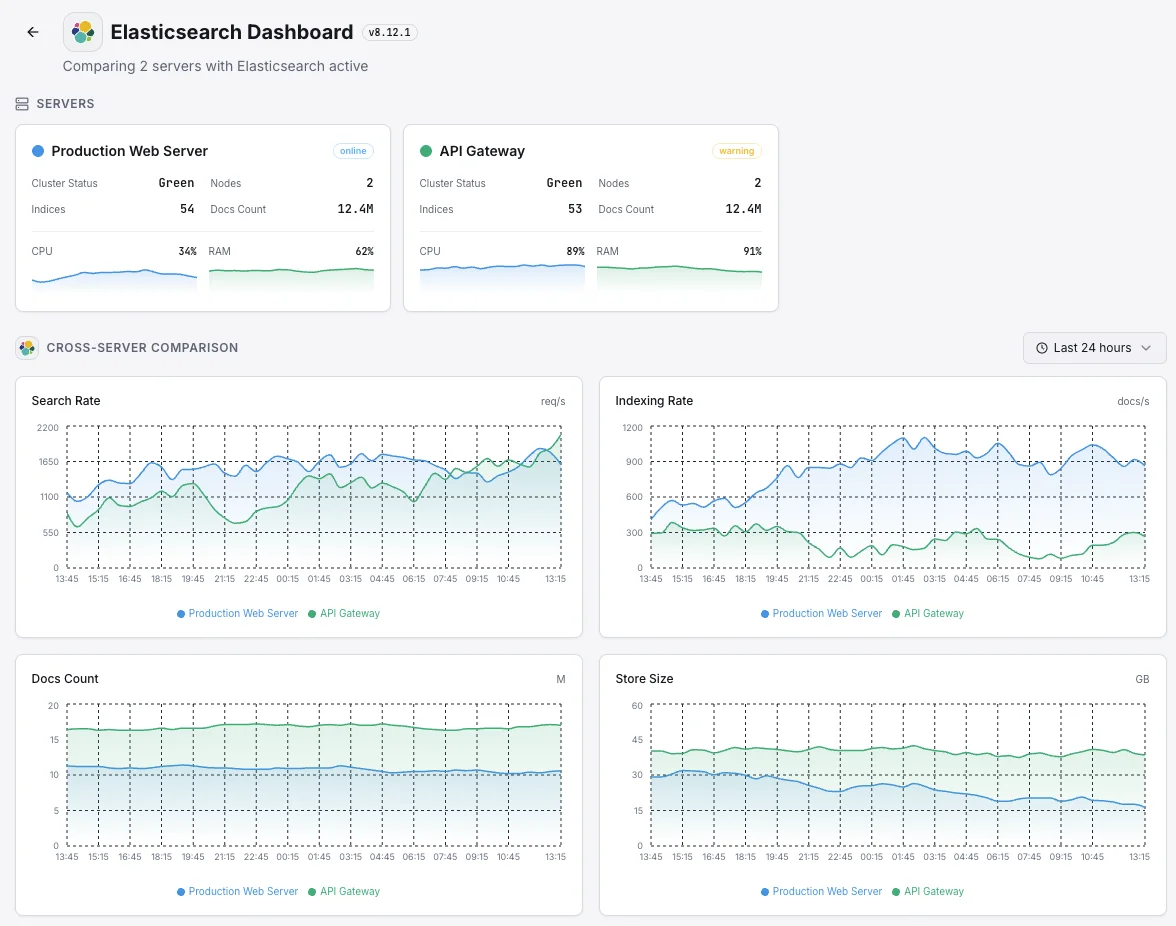
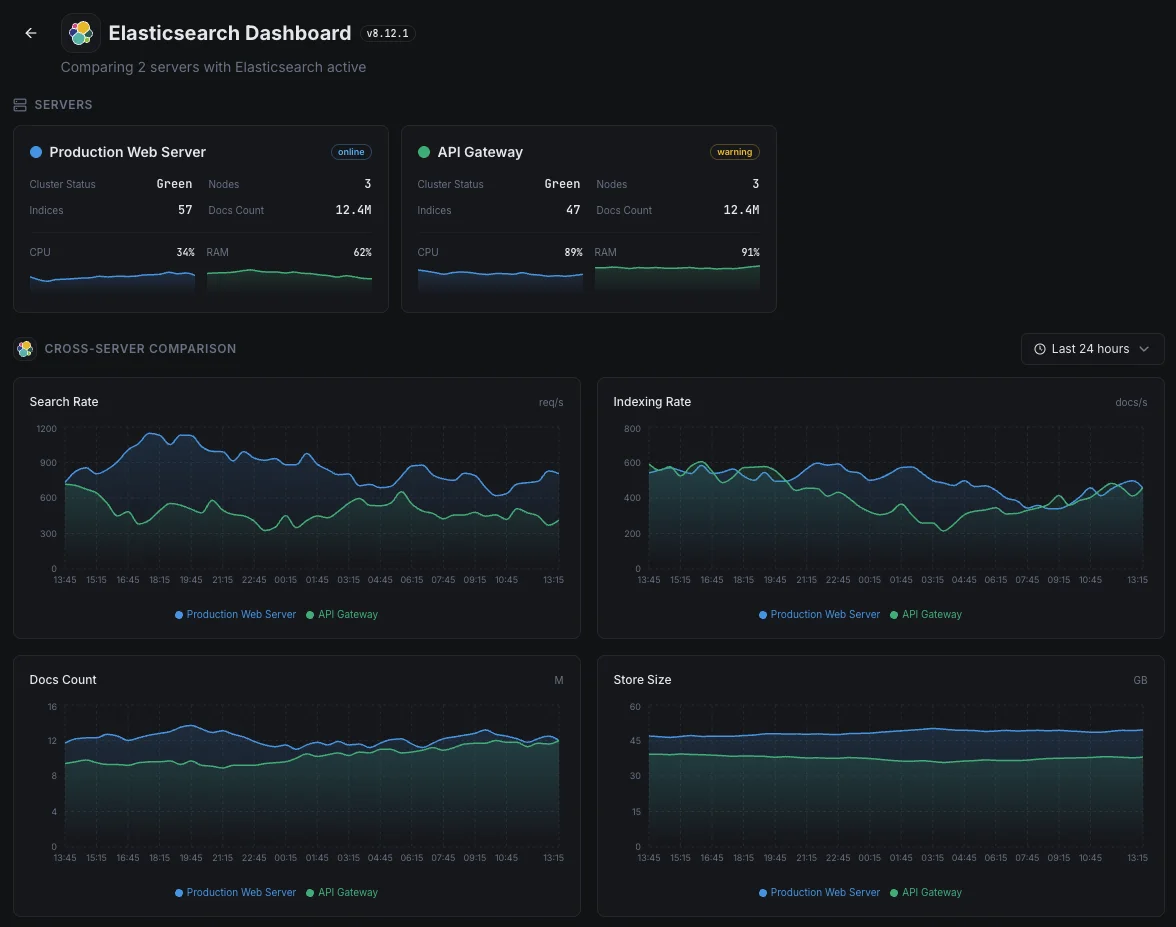
Salute del cluster
Stato complessivo del cluster (verde/giallo/rosso) e conteggio degli shard attivi.
Utilizzo dell'heap JVM
Heap utilizzato, committed e massimo su tutti i nodi con statistiche GC.
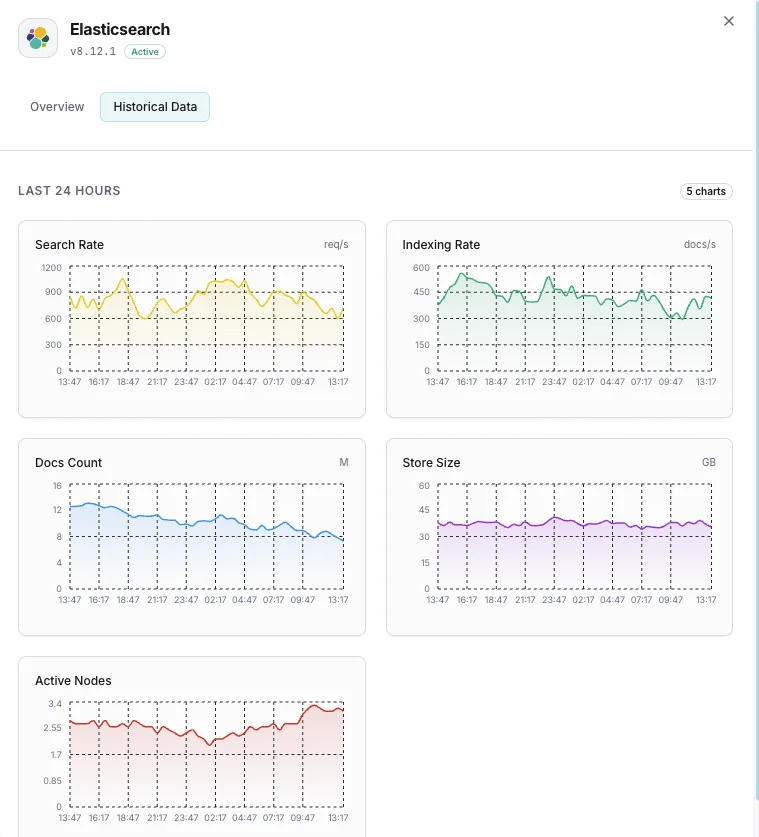
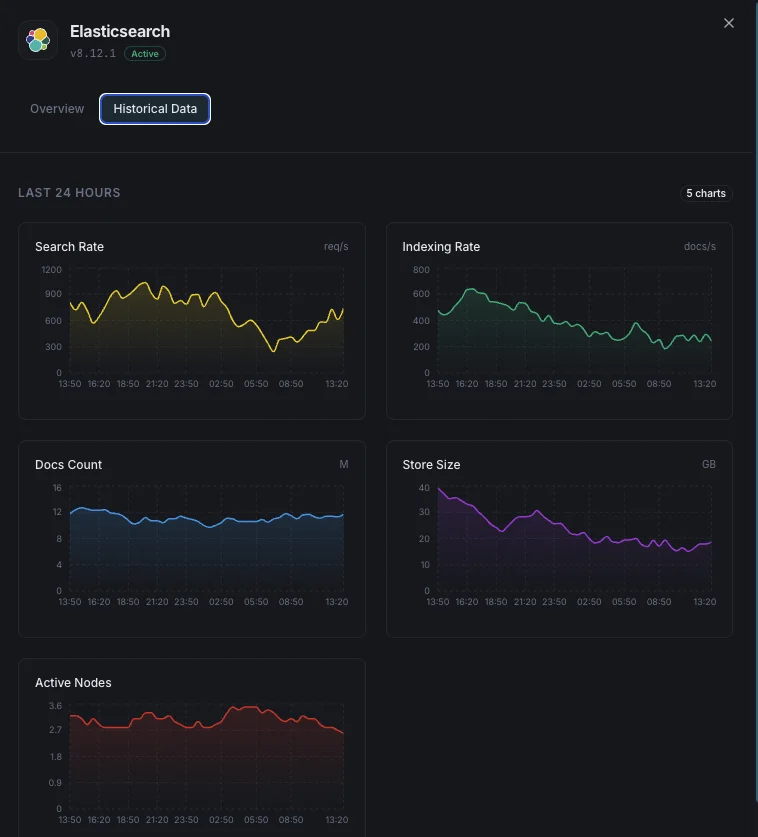
Tasso di indicizzazione
Documenti indicizzati al secondo nell'intero cluster.
Tasso di ricerca
Query di ricerca al secondo e latenza media di ricerca.
Numero di shard
Shard attivi, in relocazione, in inizializzazione e non assegnati.
Task in attesa
Task pendenti a livello di cluster che possono indicare colli di bottiglia.
Utilizzo CPU
Utilizzo CPU per nodo e load average a livello OS.
Utilizzo disco
Storage utilizzato per nodo e spazio disponibile.
Thread pool
Task attivi, in coda e rifiutati in ogni thread pool.
Circuit breaker
Stime di memoria e conteggi di trip per i breaker request/fielddata/in-flight.
Numero di segmenti
Numero di segmenti Lucene e attività di merge.
Cache fielddata
Dimensione della cache fielddata e numero di eviction.
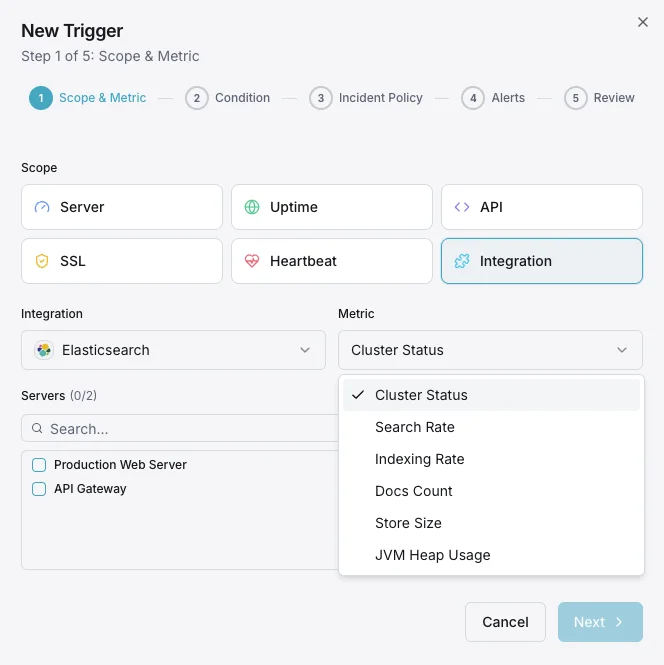
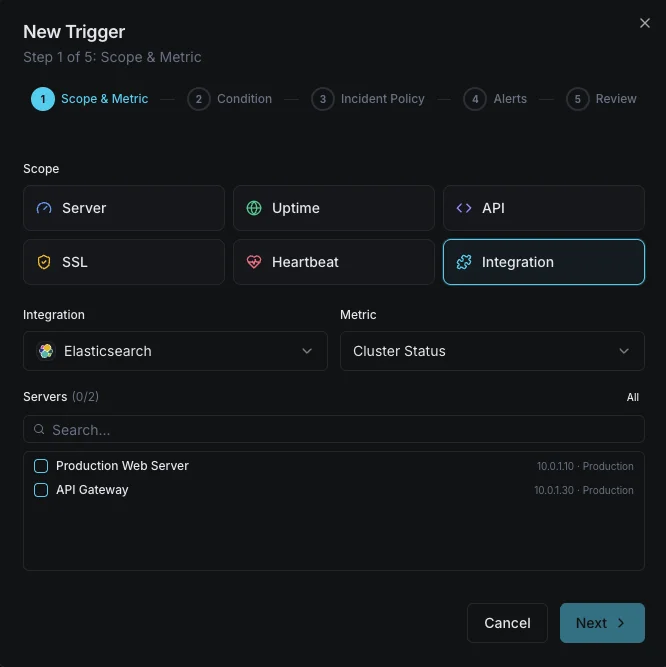
Configurabile condizioni di attivazione
Imposta dei trigger personalizzati nella tua dashboard per ricevere una notifica non appena le metriche dell{name}e superano le soglie da te definite.
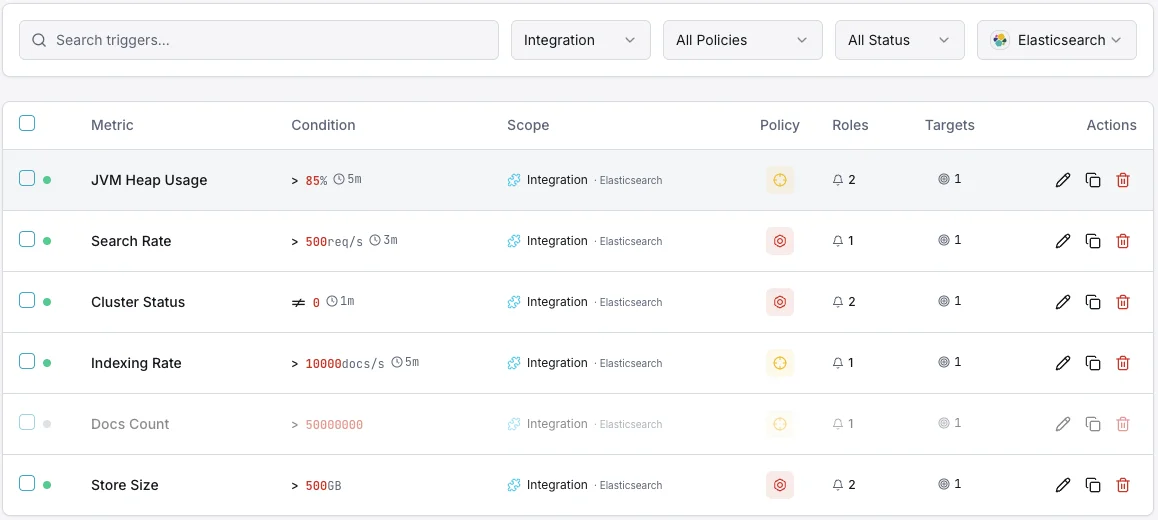
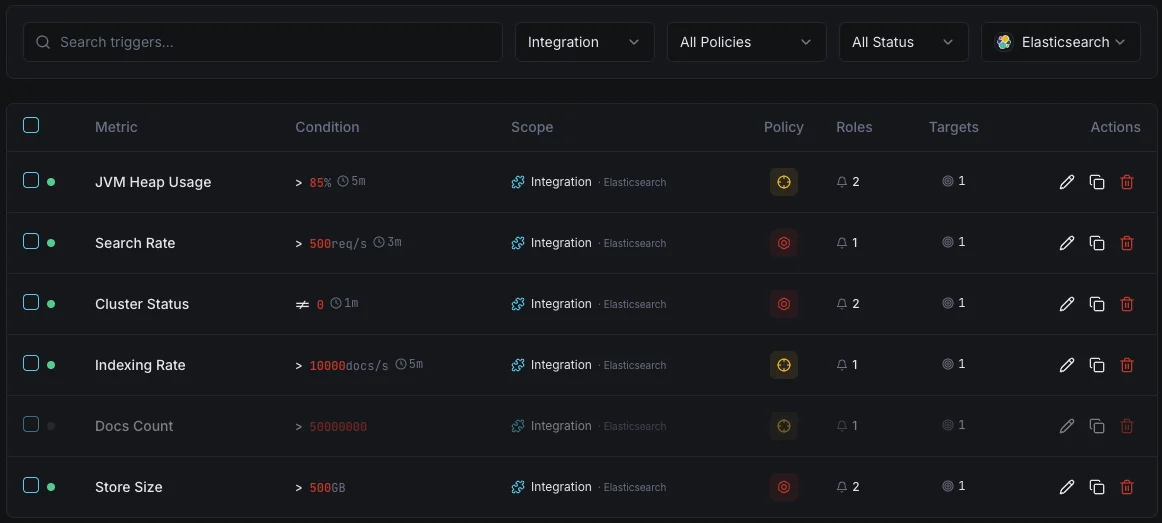
Salute del cluster
criticoSi attiva quando lo stato del cluster degrada a giallo o rosso, indicando problemi di allocazione degli shard.
Utilizzo dell'heap JVM
criticoSi attiva quando l'utilizzo dell'heap JVM supera la soglia, con rischio di errori out-of-memory e instabilità dei nodi.
Tasso di indicizzazione
avvisoAvvisa quando il throughput di indicizzazione scende sotto la baseline, indicando problemi nella pipeline di ingestione.
Latenza di ricerca
avvisoSi attiva quando la latenza media di ricerca supera la soglia, degradando la qualità delle ricerche per gli utenti.
Shard non assegnati
criticoSi attiva quando degli shard restano non assegnati, lasciando dati sottoreplicati e a rischio.
Rifiuti del thread pool
avvisoAvvisa quando le code dei thread pool traboccano e iniziano a rifiutare le richieste.
Importanza del monitoraggio Elasticsearch
Elasticsearch è alla base della funzionalità di ricerca, dell'aggregazione dei log e dell'analisi in tempo reale. Senza monitoraggio, il degrado del cluster, la pressione JVM e gli shard non assegnati possono sfociare in interruzioni della ricerca e perdita di dati.
- Rileva il degrado della salute del cluster prima che impatti sulla disponibilità della ricerca
- Monitora l'heap JVM per prevenire crash out-of-memory
- Tieni traccia del throughput di indicizzazione per garantire pipeline di ingestione integre
- Identifica gli shard non assegnati che lasciano i dati sottoreplicati
- Ottimizza la latenza di ricerca per le applicazioni rivolte agli utenti
Perché scegliere Xitoring
Xitoring offre un monitoraggio Elasticsearch di livello enterprise con configurazione zero-config. Il nostro agente leggero rileva automaticamente i tuoi nodi Elasticsearch, inizia a raccogliere metriche in meno di 60 secondi e si integra con i tuoi canali di notifica esistenti.
- Installazione con un solo comando — niente YAML o file di configurazione complessi
- Oltre 15 nodi di monitoraggio globali per controlli a bassa latenza
- Dashboard unificata per server, cluster di ricerca e uptime
- Alerting flessibile tramite Slack, PagerDuty, Telegram e altri
- Conservazione dei dati storici per pianificazione della capacità e audit
Scenari comuni di monitoring per Elasticsearch
Dove viene solitamente utilizzato Elasticsearch al giorno d'oggi — e cosa potrebbe andare storto se nessuno lo tenesse d'occhio.
Log e dati di osservabilità
Quando le app e i server inviano i propri log in streaming a Elasticsearch, eventuali ritardi o rifiuti comportano la perdita di parti di informazioni, proprio nel momento in cui, in caso di incidente, sarebbero più necessarie. Individuiamo il collo di bottiglia quando è ancora di entità limitata, in modo che la cronologia diagnostica del team rimanga completa.
Cerca siti web, app e funzionalità di intelligenza artificiale
Quando la funzione di ricerca è alla base di un sito web, di un'app o di una funzionalità di intelligenza artificiale, una query lenta incide negativamente sull'esperienza utente e sulle conversioni. Monitoriamo i tempi di risposta e la capacità di sistema, in modo da poter risolvere eventuali rallentamenti della ricerca prima che si trasformino in un problema per il fatturato o per il prodotto.
Ricerca gestita su AWS o su un altro cloud
I fornitori di servizi cloud gestiscono il servizio per conto tuo, ma non ti avvisano quando il tuo carico di lavoro lo sovraccarica o quando le tue query iniziano a rallentare. Noi colmiamo questa lacuna di visibilità, consentendoti di mantenere il controllo sia sui costi che sulle prestazioni.
Prerequisiti per Elasticsearch
Assicurati di avere tutto questo in posizione — la maggior parte delle installazioni dura 60 secondi una volta soddisfatte le condizioni.
- Elasticsearch 7.x o 8.x raggiungibile sulla porta REST (predefinita 9200)
- Un utente di monitoraggio con privilegi cluster:monitor se la sicurezza è abilitata
- Configurazione TLS/CA disponibile per Xitogent se è richiesto HTTPS
Inizia con verbali
Installa Xitogent sul tuo server
Se non l'hai già fatto, installa il leggero agente di monitoraggio Xitogent sul tuo server.
curl -s https://xitoring.com/install.sh | sudo bash -s -- --key=YOUR_API_KEYVerifica la raggiungibilità dell'API Elasticsearch
Xitogent usa l'API REST di Elasticsearch per raccogliere metriche. Verifica che il cluster sia raggiungibile:
curl -s http://localhost:9200/_cluster/health | python3 -m json.toolAbilita l'integrazione Elasticsearch
Usa la dashboard di Xitoring o la CLI per abilitare l'integrazione Elasticsearch.
sudo xitogent integrateConfigura le soglie di allerta (opzionale)
Imposta soglie personalizzate per cluster health, JVM heap o indexing rate per essere avvisato quando qualcosa richiede attenzione.
Verifica che funzioni
Esegui questo comando sul server per confermare che Xitogent ha rilevato l'integrazione. In circa 30 secondi nuove metriche cominceranno a comparire sulla tua dashboard.
sudo xitogent statusStai valutando alternative?
Scopri come Xitoring si confronta con le alternative per il monitoraggio di Elasticsearch — prezzi fissi, integrazioni più approfondite e un unico agente che copre l'intero stack.


Spesso domande poste
L'integrazione richiede l'autenticazione?
Questa integrazione influirà sulle prestazioni di Elasticsearch?
È possibile monitorare i cluster con più nodi?
Posso monitorare OpenSearch?
Quali versioni di Elasticsearch sono supportate?
Con quale frequenza vengono raccolti i dati?
Cos’è un search thread pool e come ne monitoro i reject?
Monitoring Elasticsearch vs OpenSearch — quali differenze?
Quali versioni di Elasticsearch sono supportate?
Inizia a monitorare Elasticsearch oggi
Configurazione in meno di 60 secondi. Non è richiesta alcuna carta di credito. Statistiche complete fin dal primo giorno.
Inizia la prova gratuitaContinua a esplorare