MariaDB Monitoraggio
Monitora in tempo reale le prestazioni delle query MariaDB, il buffer pool di InnoDB, lo stato della replica e le metriche di connessione senza alcuna configurazione.
Perché monitorare MariaDB?
MariaDB è un fork di MySQL sviluppato dalla comunità, utilizzato da milioni di utenti per applicazioni web, data warehousing e carichi di lavoro aziendali. Il monitoraggio di MariaDB è fondamentale per ottimizzare la velocità di elaborazione delle query, monitorare l'efficienza del buffer pool di InnoDB, rilevare eventuali ritardi nella replica e gestire i pool di connessioni. L'integrazione di MariaDB offerta da Xitoring garantisce una visibilità approfondita sulle prestazioni del database.
Monitoraggio di MariaDB, in breve
Il monitoraggio di MariaDB intercetta instabilità del cluster Galera, drift di replica, query lente e saturazione delle connessioni prima che provochino split-brain, tempeste di failover sulle repliche o rallentamenti a livello di intero account di hosting. Per host WordPress su cPanel, cluster HA Galera e qualsiasi carico MariaDB, la visibilità per database più lo stato wsrep_* specifico di Galera è ciò che separa un failover pulito di 30 secondi da un'interruzione di più ore. Xitoring rileva automaticamente il suo MariaDB, legge le viste di stato native più lo stato Galera, e instrada gli avvisi verso Slack, PagerDuty, Telegram o il suo on-call esistente.
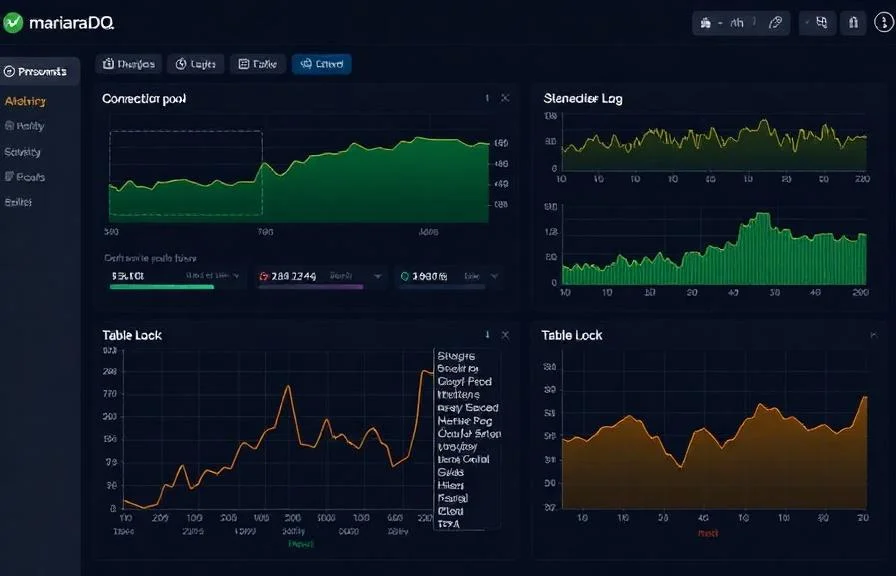
Ciò che monitoriamo
Query al secondo
Tasso di istruzioni SELECT, INSERT, UPDATE e DELETE.
Query lente
Numero di query che superano la soglia long_query_time configurata.
Tasso di hit del buffer pool InnoDB
Percentuale di letture di pagine servite dal buffer pool rispetto al disco.
Operazioni sulle righe InnoDB
Tasso di letture, inserimenti, aggiornamenti ed eliminazioni di righe in InnoDB.
Connessioni
Thread attivi, thread connessi e utilizzo di max_connections.
Stati dei thread
Distribuzione degli stati dei thread (running, sleeping, locked, ecc.).
Lag della replica
Seconds_Behind_Master e stato dei thread I/O/SQL slave.
Lock di tabella
Attese di lock di tabella e acquisizioni immediate.
Tabelle temporanee
Tasso di tabelle temporanee create su disco rispetto a in memoria.
Binary log
Dimensione del binary log e conteggio degli eventi per il monitoraggio della replica.
Connessioni abortite
Tentativi di connessione falliti e connessioni client abortite.
Operazioni del handler
Tassi di lettura/scrittura del handler che indicano l'attività del motore di storage.
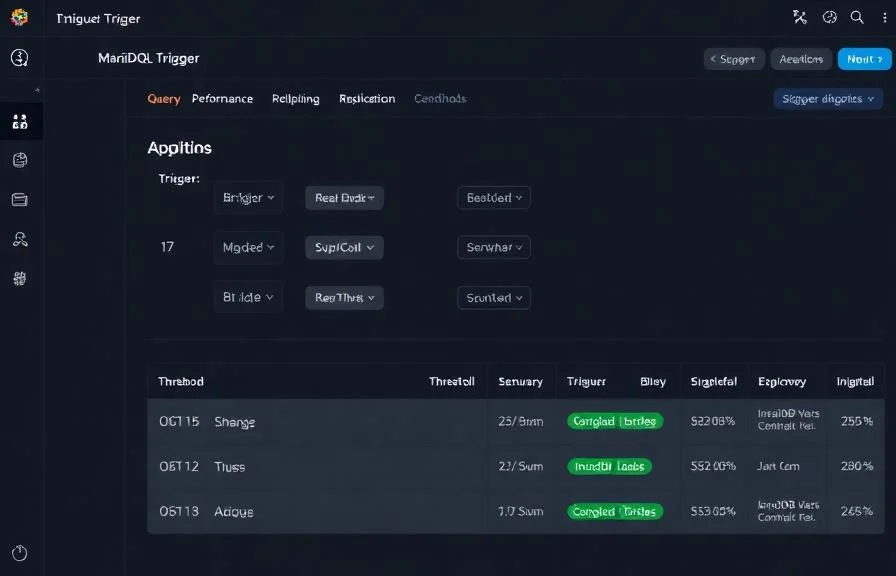
Configurabile condizioni di attivazione
Imposta dei trigger personalizzati nella tua dashboard per ricevere una notifica non appena le metriche dell{name}e superano le soglie da te definite.

Lag della replica
criticoSi attiva quando lo slave resta indietro rispetto al master, rischiando incoerenza dei dati e letture stale.
Query lente
avvisoSi attiva quando il tasso di query lente supera la soglia, indicando query non ottimizzate o indici mancanti.
Tasso di hit del buffer pool
avvisoAvvisa quando il rapporto di hit del buffer pool InnoDB scende, aumentando l'I/O disco.
Utilizzo connessioni
criticoSi attiva quando le connessioni attive si avvicinano a max_connections, rischiando errori connection refused.
Attese di lock di tabella
avvisoSi attiva quando la contesa di lock di tabella aumenta, degradando le prestazioni delle query concorrenti.
Connessioni abortite
criticoAvvisa quando i fallimenti di connessione aumentano, indicando problemi di autenticazione o di rete.
Importanza del monitoraggio MariaDB
MariaDB gestisce dati critici per applicazioni web, piattaforme e-commerce e sistemi enterprise. Senza monitoraggio, query lente, drift di replica ed esaurimento delle connessioni possono degradare silenziosamente l'esperienza utente e rischiare la perdita di dati.
- Rileva query lente prima che impattino sui tempi di risposta dell'applicazione
- Monitora l'efficienza del buffer pool InnoDB per ottimizzare l'allocazione della memoria
- Tieni traccia della salute della replica per garantire la coerenza delle read replica
- Identifica l'esaurimento del pool di connessioni dai server applicativi
- Previeni la contesa di lock di tabella in ambienti ad alta concorrenza


Perché scegliere Xitoring
Xitoring offre un monitoraggio MariaDB di livello enterprise con configurazione zero-config. Il nostro agente leggero rileva automaticamente le tue istanze MariaDB, inizia a raccogliere metriche in meno di 60 secondi e si integra con i tuoi canali di notifica esistenti.
- Installazione con un solo comando — niente YAML o file di configurazione complessi
- Oltre 15 nodi di monitoraggio globali per controlli a bassa latenza
- Dashboard unificata per server, database e uptime
- Alerting flessibile tramite Slack, PagerDuty, Telegram e altri
- Conservazione dei dati storici per pianificazione della capacità e audit


Scenari comuni di monitoraggio di MariaDB
Dove MariaDB viene tipicamente eseguito oggi — e cosa potrebbe andare storto se nessuno lo monitora.
WordPress e altri siti web su server di hosting
Quando molti siti web condividono lo stesso server di database, un plugin lento o una query fuori controllo possono silenziosamente rallentare ogni sito sul server. Individuiamo la provenienza del rallentamento in modo che il team possa risolvere la causa invece di riavviare alla cieca.
Cluster che rimangono online durante i guasti
Le configurazioni di produzione eseguono diverse copie del database in modo che un singolo guasto non possa bloccare l'applicazione. Quando le copie non sono allineate o perdono il contatto tra loro, l'intero cluster può improvvisamente smettere di accettare modifiche. Cogliamo subito il problema in modo che la rete di sicurezza continui a funzionare.
Database dietro un gateway di connessione
Un gateway di connessione davanti al database velocizza le query e protegge il database dalle tempeste di connessioni — ma aggiunge un elemento in movimento. Monitoriamo entrambi i livelli come un'unica unità in modo che i problemi vengano rilevati nel componente che li ha introdotti, non dopo che si sono propagati.
Prerequisiti per MariaDB
Assicurati di avere tutto questo in posizione — la maggior parte delle installazioni dura 60 secondi una volta soddisfatte le condizioni.
- MariaDB 10.x in esecuzione sul server
- performance_schema = ON nella sezione [mysqld]
- Un utente di monitoraggio con PROCESS, REPLICATION CLIENT e SELECT su performance_schema
Inizia con verbali
Installa Xitogent sul tuo server
Se non l'hai già fatto, installa il leggero agente di monitoraggio Xitogent sul tuo server.
curl -s https://xitoring.com/install.sh | sudo bash -s -- --key=YOUR_API_KEYCrea un utente di monitoraggio
Crea un utente MariaDB dedicato con privilegi minimi per la raccolta delle metriche:
CREATE USER 'xitoring'@'%' IDENTIFIED BY 'your_password';
GRANT REPLICATION CLIENT ON *.* TO 'xitoring'@'%' WITH MAX_USER_CONNECTIONS 5;
GRANT PROCESS ON *.* TO 'xitoring'@'%';
GRANT SELECT ON performance_schema.* TO 'xitoring'@'%';
FLUSH PRIVILEGES;Abilita l'integrazione MariaDB
Usa la dashboard di Xitoring o la CLI per abilitare l'integrazione MariaDB.
sudo xitogent integrateConfigura le soglie di allerta (opzionale)
Imposta soglie personalizzate per query rate, buffer pool hit ratio o Replication Lag per essere avvisato quando qualcosa richiede attenzione.
Verifica che funzioni
Esegui questo comando sul server per confermare che Xitogent ha rilevato l'integrazione. In circa 30 secondi nuove metriche cominceranno a comparire sulla tua dashboard.
sudo xitogent statusStai valutando alternative?
Scopri come Xitoring si confronta con le alternative per il monitoraggio di MariaDB — prezzi fissi, integrazioni più approfondite e un unico agente che copre l'intero stack.


Spesso domande poste
Il monitoraggio di MariaDB è diverso da quello di MySQL?
Questa integrazione influirà sulle prestazioni di MariaDB?
Posso monitorare Galera Cluster?
Quali versioni di MariaDB sono supportate?
È possibile monitorare più istanze su un unico server?
Con quale frequenza vengono raccolti i dati?
Cos'è MariaDB MaxScale e come si monitora?
Posso monitorare più istanze MariaDB sullo stesso server?
Quali versioni di MariaDB sono supportate?
Inizia a monitorare MariaDB oggi
Configurazione in meno di 60 secondi. Non è richiesta alcuna carta di credito. Statistiche complete fin dal primo giorno.
Inizia la prova gratuitaContinua a esplorare