Memcached Monitoraggio
Monitora in tempo reale le connessioni Memcached, i tassi di accesso, l'utilizzo della memoria e le metriche di eviction senza alcuna configurazione.
Perché monitorare Memcached?
Memcached è un sistema di cache a memoria distribuita ad alte prestazioni utilizzato per velocizzare le applicazioni web dinamiche riducendo il carico sul database. Il monitoraggio di Memcached garantisce un utilizzo ottimale della cache, rileva i picchi di eviczione e previene l'esaurimento della memoria nel livello di cache.
Monitoraggio di Memcached, spiegato
Il monitoraggio di Memcached intercetta tempeste di eviction, pressione di memoria, saturazione delle connessioni e hit ratio in calo prima che le richieste non cachate sovraccarichino il database. Per object cache di WordPress, sessioni PHP, caching dei risultati delle query in Django/Rails e deployment AWS ElastiCache Memcached, la visibilità per nodo è ciò che separa un'allerta in 60 secondi dal trovare il DB inchiodato al 100% di CPU alle 3 di notte. Xitoring rileva automaticamente Memcached, legge stats con intervallo di 1 minuto e instrada le allerte su Slack, PagerDuty, Telegram o sul Suo sistema di on-call esistente.
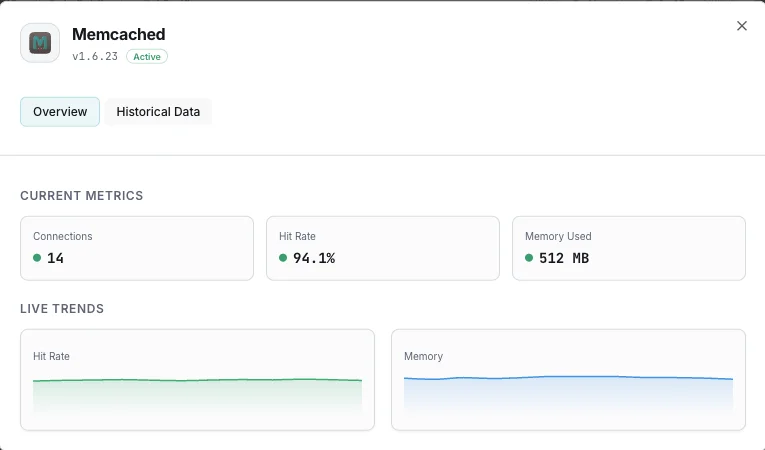
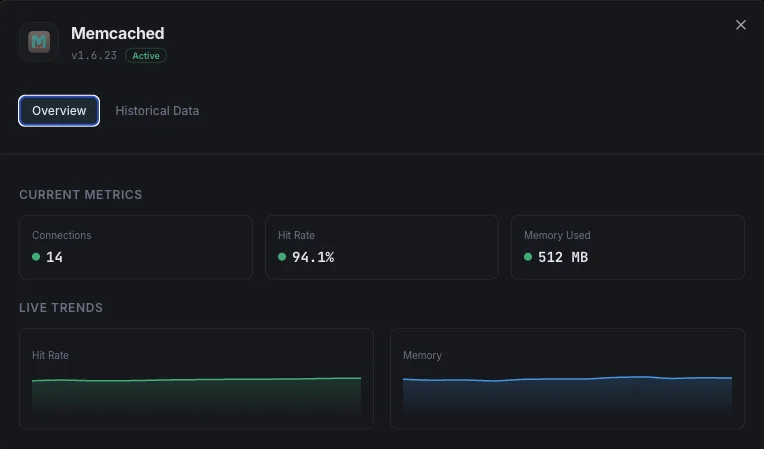
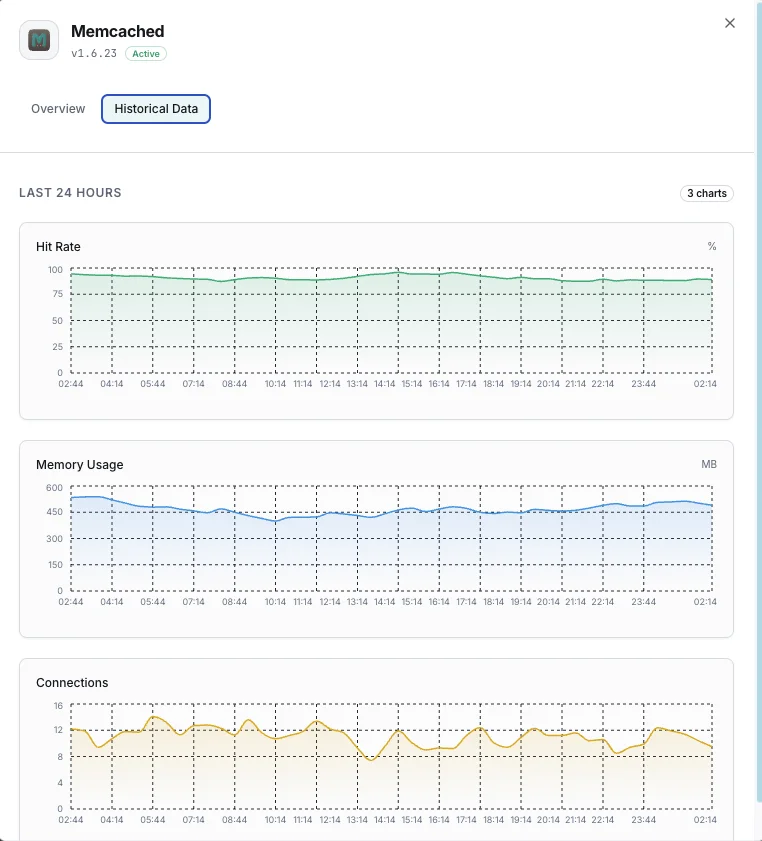
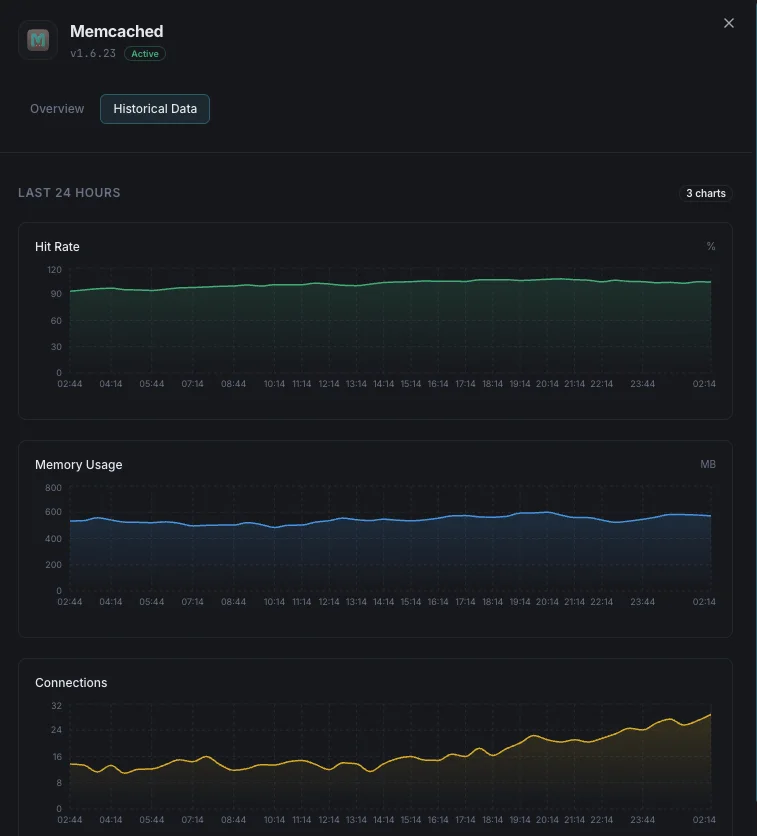
Ciò che monitoriamo
Memoria utilizzata
Memoria totale attualmente allocata per gli elementi in cache.
Memoria massima
Limite massimo di memoria configurato per l'istanza Memcached.
Tasso di hit
Percentuale di ricerche in cache riuscite rispetto ai miss, indicando l'efficacia della cache.
Eviction
Numero di elementi rimossi per fare spazio a nuovi dati.
Connessioni correnti
Numero di connessioni client attualmente aperte.
Item memorizzati
Numero totale di elementi attualmente memorizzati in cache.
Rapporto Get/Set
Rapporto tra comandi get e set, indicando il bilanciamento lettura/scrittura.
Byte letti/scritti
Throughput di rete totale per l'istanza Memcached.
CAS Hits/Misses
Tassi di successo delle operazioni check-and-set per aggiornamenti concorrenti.
Utilizzo degli slab
Efficienza di allocazione della memoria tra le classi di slab.
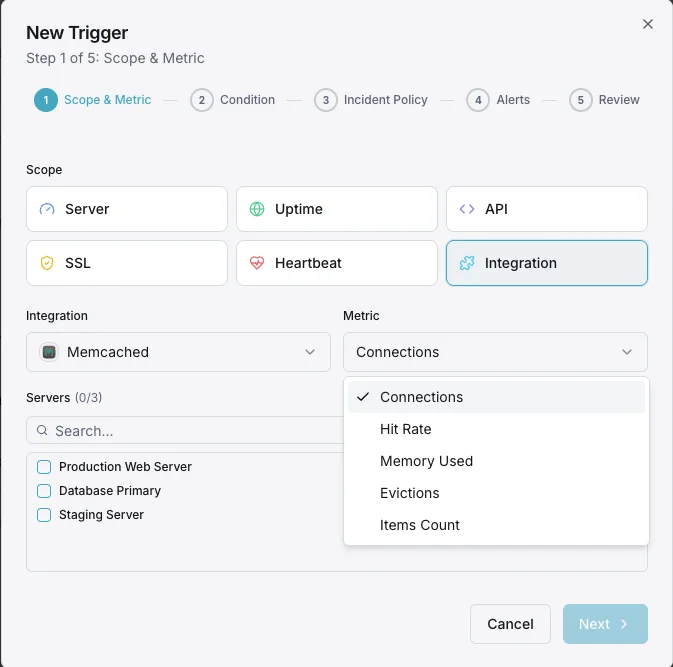
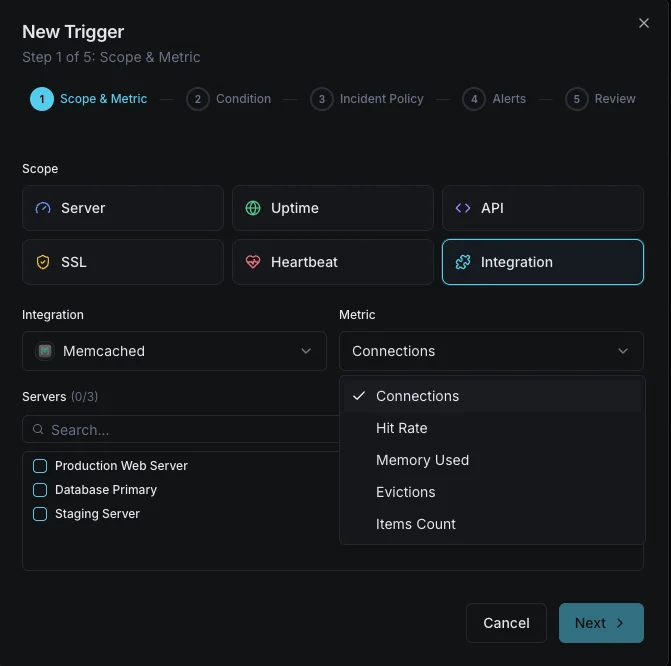
Configurabile condizioni di attivazione
Imposta dei trigger personalizzati nella tua dashboard per ricevere una notifica non appena le metriche dell{name}e superano le soglie da te definite.
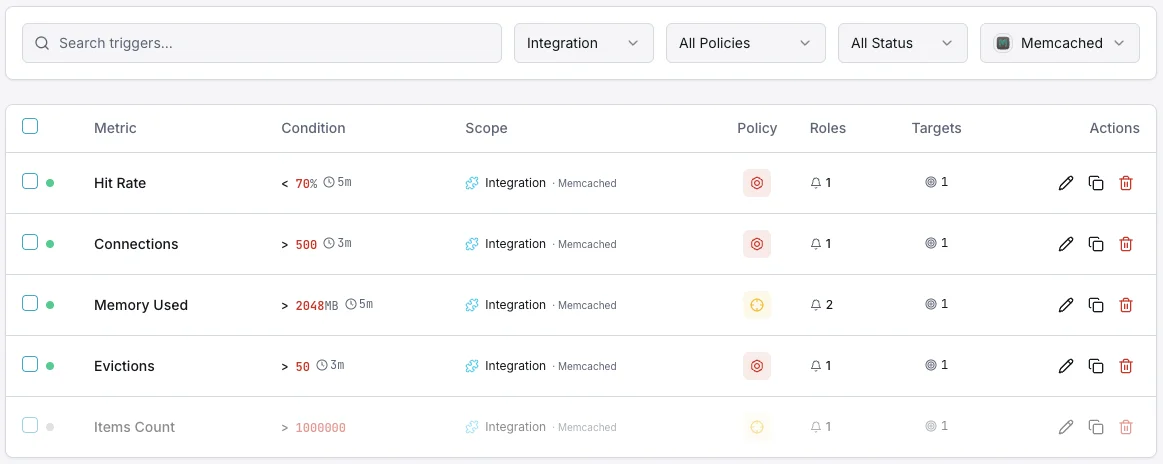
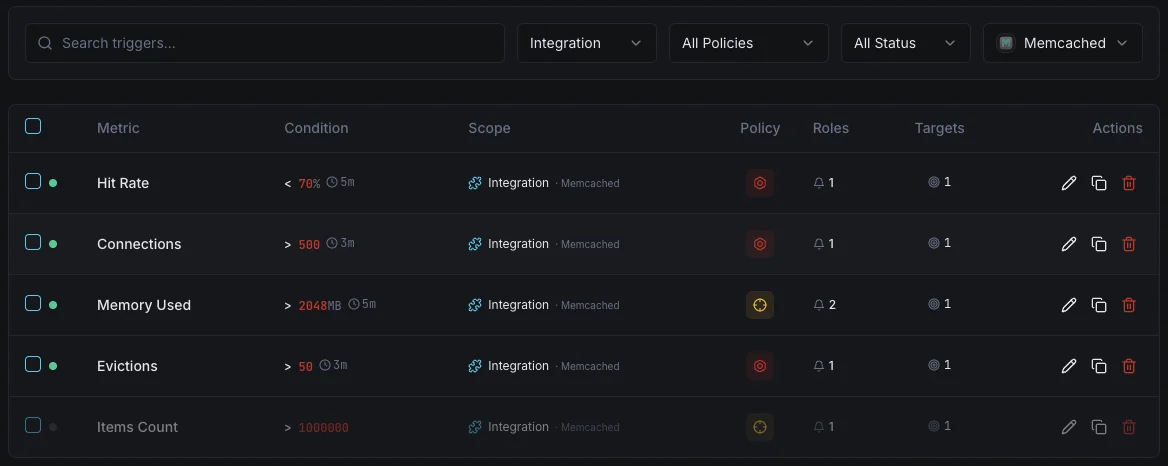
Utilizzo memoria
criticoSi attiva quando il consumo di memoria di Memcached si avvicina al limite configurato, rischiando eviction.
Calo del tasso di hit
avvisoAvvisa quando il tasso di hit della cache scende sotto la soglia, indicando inefficienza della cache o modifiche al working set.
Tasso di eviction
criticoSi attiva quando il tasso di eviction sale rapidamente, indicando che Memcached sta rimuovendo attivamente dati per restare entro i limiti di memoria.
Numero di connessioni
avvisoSi attiva quando le connessioni client superano la soglia, indicando potenziali connection leak.
Item reclamati
avvisoAvvisa quando gli elementi scaduti vengono reclamati a un ritmo elevato, suggerendo una configurazione errata dei TTL.
Importanza del monitoraggio Memcached
Memcached alimenta silenziosamente il livello di performance della tua applicazione. Senza monitoraggio, esaurimento della memoria, tempeste di eviction e connection leak possono degradare l'intera applicazione prima che qualcuno se ne accorga.
- Rileva la pressione di memoria prima che le eviction impattino sulle prestazioni dell'applicazione
- Monitora i tassi di hit della cache per garantire tempi di risposta ottimali
- Tieni traccia dei pattern di eviction per dimensionare correttamente l'allocazione della memoria
- Identifica le connection leak provenienti dai client applicativi
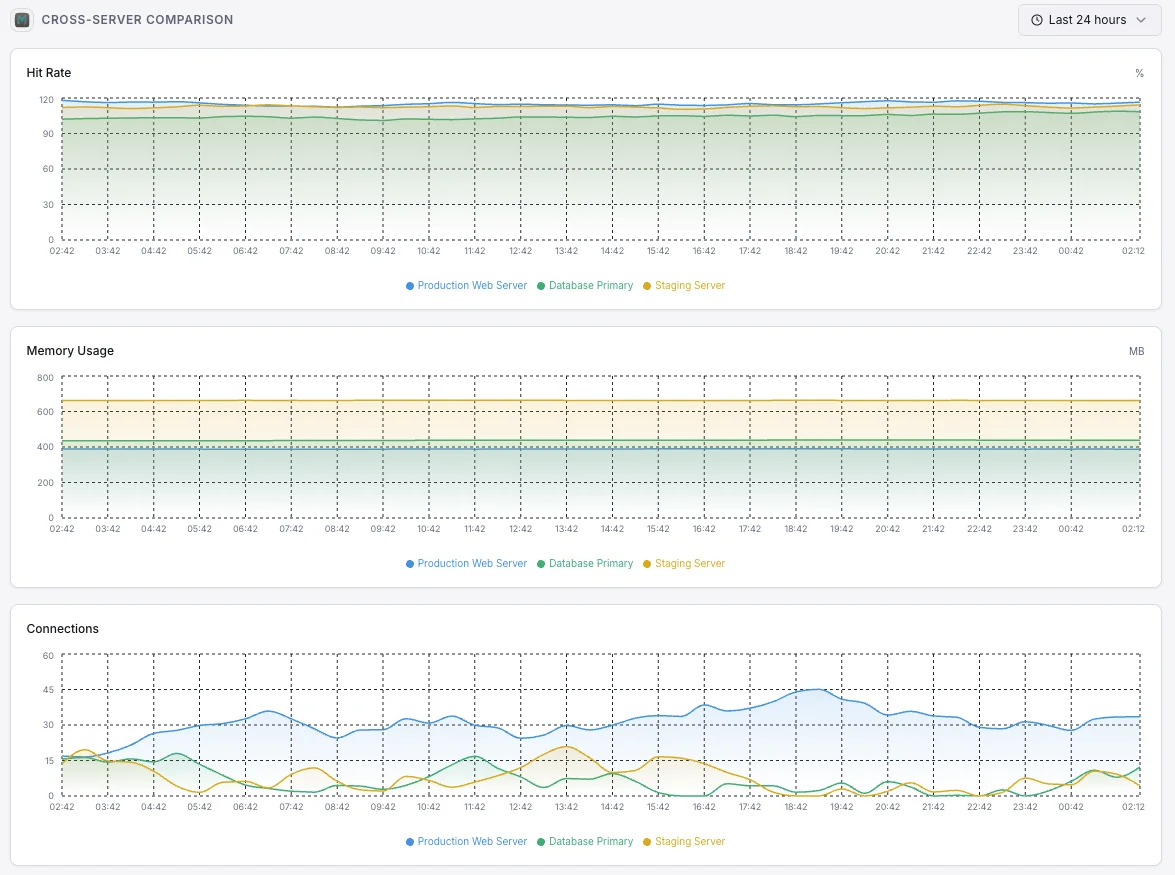
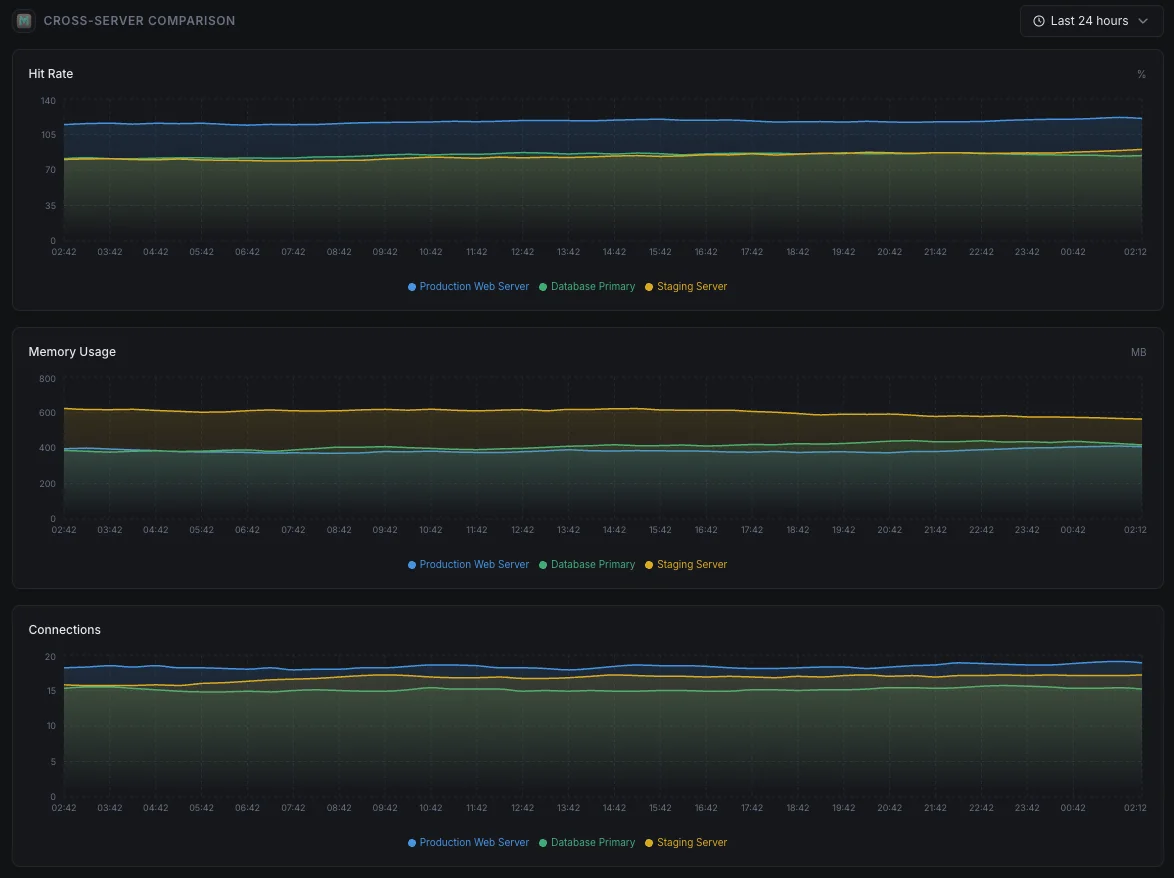
- Garantisci prestazioni cache costanti tra nodi distribuiti
Perché scegliere Xitoring
Xitoring offre un monitoraggio Memcached di livello enterprise con configurazione zero-config. Il nostro agente leggero rileva automaticamente le tue istanze Memcached, inizia a raccogliere metriche in meno di 60 secondi e si integra con i tuoi canali di notifica esistenti.
- Installazione con un solo comando — niente YAML o file di configurazione complessi
- Oltre 15 nodi di monitoraggio globali per controlli a bassa latenza
- Dashboard unificata per server, cache e uptime
- Alerting flessibile tramite Slack, PagerDuty, Telegram e altri
- Conservazione dei dati storici per pianificazione della capacità e audit
Scenari comuni di monitoraggio Memcached
Dove Memcached viene tipicamente eseguito oggi — e cosa potrebbe andare storto se nessuno lo monitora.
Accelerare i siti WordPress e PHP
Memcached mantiene veloci i siti WordPress e PHP memorizzando i risultati di operazioni ripetute. Quando la cache smette di essere efficace, il sito rallenta silenziosamente sotto carico. Lo rileviamo in anticipo in modo che visitatori e conversioni non ne risentano silenziosamente.
Accelerare le app web e le API
Le app web inseriscono i loro risultati più costosi nella cache in modo da non doverli calcolare ad ogni richiesta. Quando la cache si riempie o inizia a saturarsi, il lavoro originale torna a gravare sul database. Cogliamo il momento in cui la cache smette di proteggere la tua app in modo che il team possa intervenire prima che gli utenti se ne accorgano.
Cache gestita in cloud
I fornitori di servizi cloud gestiscono i server, ma non ti dicono quando il tuo utilizzo della cache sta diventando inefficiente — esaurimento della memoria, raggiungimento dei limiti di connessione o eliminazione di dati utili. Colmiamo questa lacuna in modo che tu mantenga il controllo su costi e prestazioni.
Prerequisiti per Memcached
Assicurati di avere tutto questo in posizione — la maggior parte delle installazioni dura 60 secondi una volta soddisfatte le condizioni.
- Memcached in esecuzione sulla porta configurata (predefinita 11211)
- Raggiungibilità di rete da Xitogent verso l'istanza Memcached
- Comando stats accessibile (nessuna AUTH richiesta di default)
Inizia con verbali
Installa Xitogent sul tuo server
Se non l'hai già fatto, installa il leggero agente di monitoraggio Xitogent sul tuo server.
curl -s https://xitoring.com/install.sh | sudo bash -s -- --key=YOUR_API_KEYAssicurati che le stats di Memcached siano accessibili
Xitogent usa il comando stats di Memcached per raccogliere metriche. Verifica che la tua istanza sia raggiungibile localmente:
echo 'stats' | nc localhost 11211 | head -10Abilita l'integrazione Memcached
Usa la dashboard di Xitoring o la CLI per abilitare l'integrazione Memcached. Xitogent rileverà automaticamente la tua istanza.
sudo xitogent integrateConfigura le soglie di allerta (opzionale)
Imposta soglie personalizzate per metriche come uso della memoria, hit rate o numero di eviction per essere avvisato quando qualcosa richiede attenzione.
Verifica che funzioni
Esegui questo comando sul server per confermare che Xitogent ha rilevato l'integrazione. In circa 30 secondi nuove metriche cominceranno a comparire sulla tua dashboard.
sudo xitogent statusStai valutando alternative?
Scopri come Xitoring si confronta con le alternative per il monitoraggio di Memcached — prezzi fissi, integrazioni più approfondite e un unico agente che copre l'intero stack.


Spesso domande poste
L'integrazione con Memcached richiede l'autenticazione?
Questa integrazione influirà sulle prestazioni di Memcached?
Posso monitorare più istanze di Memcached?
Quali versioni di Memcached sono supportate?
Con quale frequenza vengono raccolti i dati?
Memcached vs Redis — quale scegliere?
Come si esegue `stats` contro Memcached?
Come si monitora un cluster Memcached?
Quali versioni di Memcached sono supportate?
Inizia a monitorare Memcached oggi
Configurazione in meno di 60 secondi. Non è richiesta alcuna carta di credito. Statistiche complete fin dal primo giorno.
Inizia la prova gratuita