HAProxy Überwachung
Überwachen Sie den Betriebszustand der HAProxy-Backends, die Sitzungsraten, die Antwortzeiten und die Verbindungsmetriken in Echtzeit – ganz ohne Konfiguration.
Warum überwachen Sie HAProxy?
HAProxy ist der branchenübliche Load Balancer und Reverse Proxy, der Millionen von Verbindungen für Hochverfügbarkeits-Bereitstellungen verarbeitet. Die Überwachung von HAProxy ist unerlässlich, um den Zustand der Backend-Server zu verfolgen, Verschlechterungen der Antwortzeiten zu erkennen, Sitzungslimits zu verwalten und eine ausgewogene Lastverteilung sicherzustellen. Die HAProxy-Integration von Xitoring bietet vollständige Transparenz über Ihre Load-Balancing-Infrastruktur.
HAProxy-Monitoring, erklärt
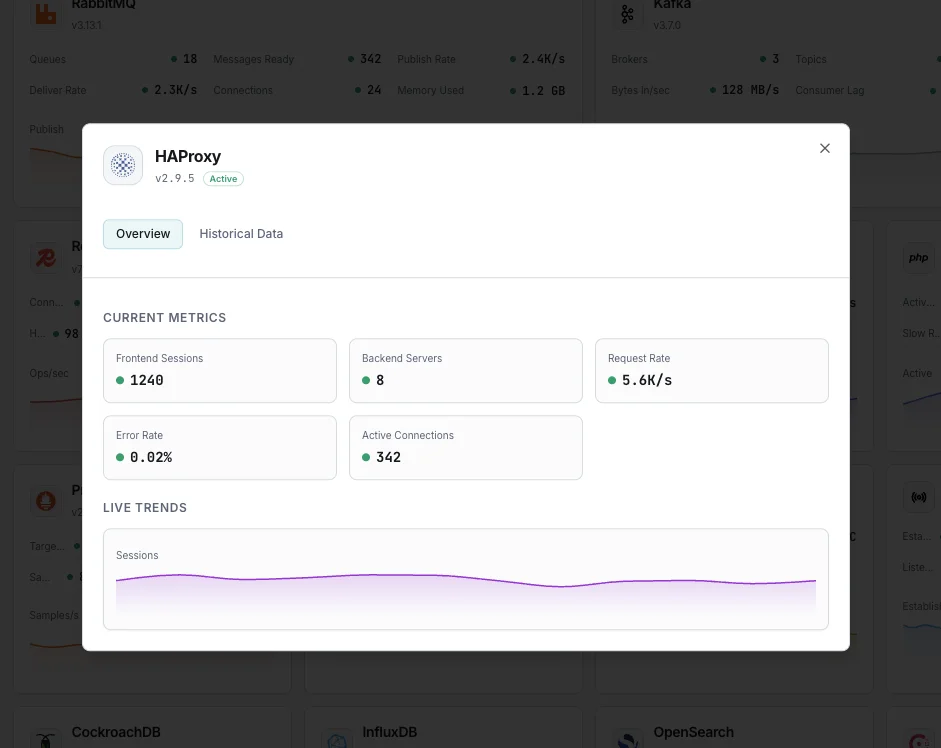
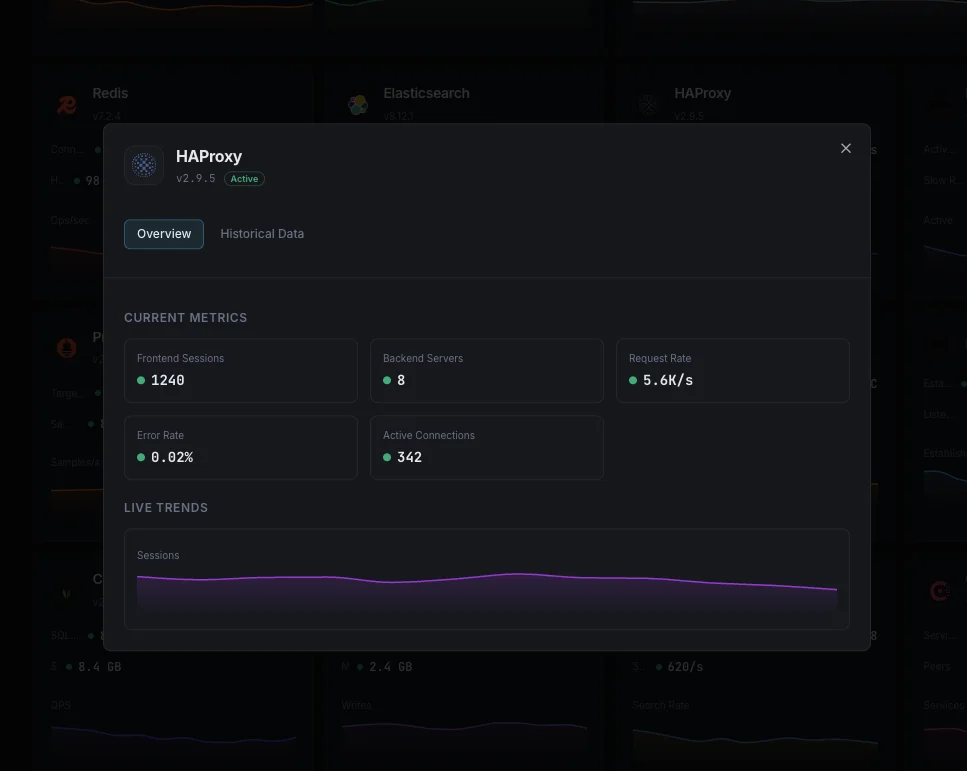
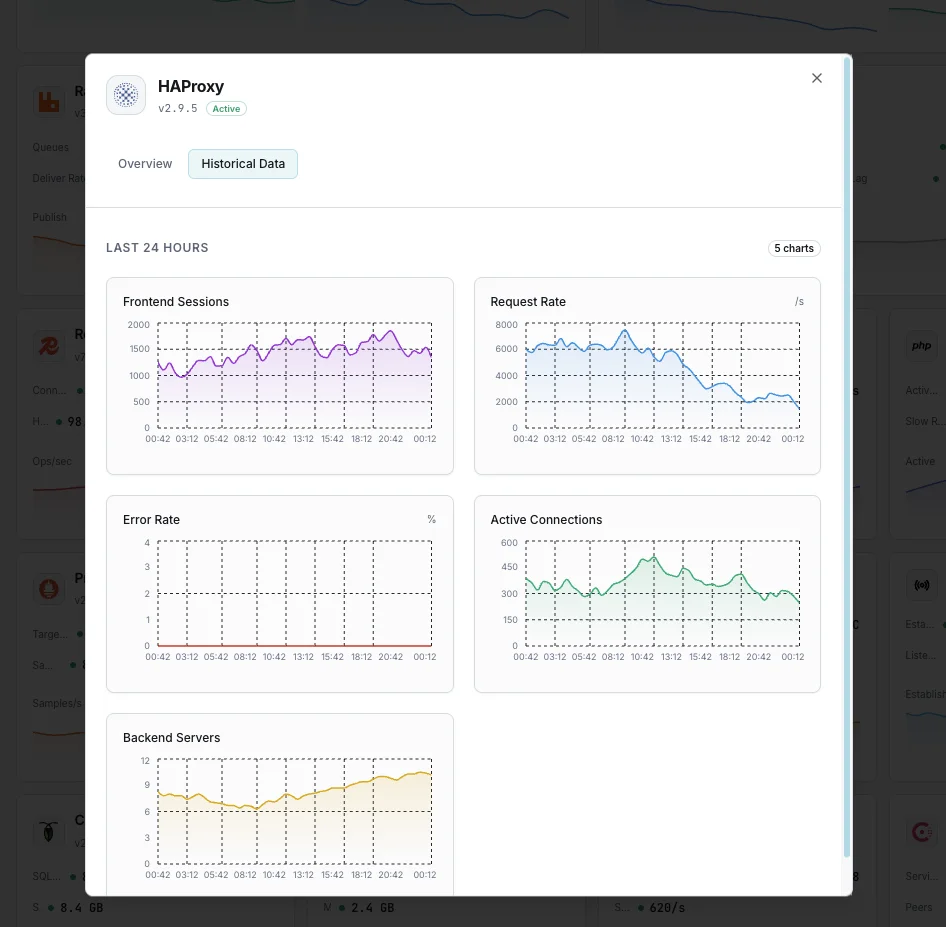
HAProxy-Monitoring erfasst Backend-Ausfälle, abgebrochene Sessions und Queue-Stau, bevor sie die Dienste lahmlegen, die HAProxy bedient. Da HAProxy am vordersten Punkt Ihres Stacks sitzt, bedeutet gutes Monitoring meist, Incidents am Eingangspunkt zu erkennen — Minuten bevor ein nachgelagerter Dienst die Rufbereitschaft alarmiert. Xitoring erkennt Ihren HAProxy automatisch, liest aus dem Stats-Socket, der /stats-Seite oder dem nativen Prometheus-Exporter (je nachdem, was Sie aktiviert haben) und leitet Alarme an Ihre bestehenden Benachrichtigungskanäle.
Was wir überwachen
Sitzungsrate
Anzahl der neuen Sitzungen pro Sekunde über alle Frontends und Backends hinweg.
Aktive Sitzungen
Derzeit aktive Sitzungen und Anzahl der Verbindungen pro Proxy.
Zustand des Backends
Status (UP/DOWN) und Überwachungsdauer für jeden Backend-Server.
Reaktionszeit
Durchschnittliche und maximale Antwortzeit pro Backend-Server.
Fehlerquote
Verbindungsfehler, Antwortfehler und abgelehnte Anfragen.
Warteschlangenlänge
Anzahl der Anfragen, die in den Backend-Warteschlangen anstehen.
Ein-/Ausgangsbytes
Netzwerkdurchsatz pro Frontend und Backend.
HTTP 4xx/5xx
Verteilung der HTTP-Antwortcodes, die auf Client- und Serverfehler hinweisen.
Wiederholungsversuche
Die Anzahl der Verbindungsversuche deutet auf eine Instabilität des Backends hin.
Sitzungslimit
Aktuelle Sitzungen im Vergleich zu den pro Proxy konfigurierten Sitzungslimits.
Verbindungsrate
Neue TCP-Verbindungen pro Sekunde zu jedem Frontend.
Abgelehnte Anfragen
Anfragen, die durch ACLs oder Regeln zur Ratenbegrenzung abgelehnt wurden.
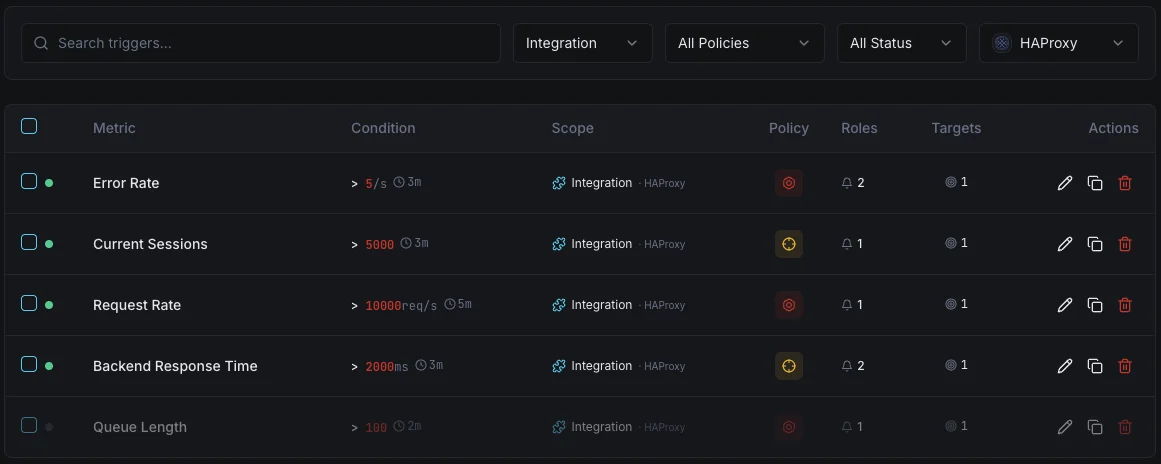
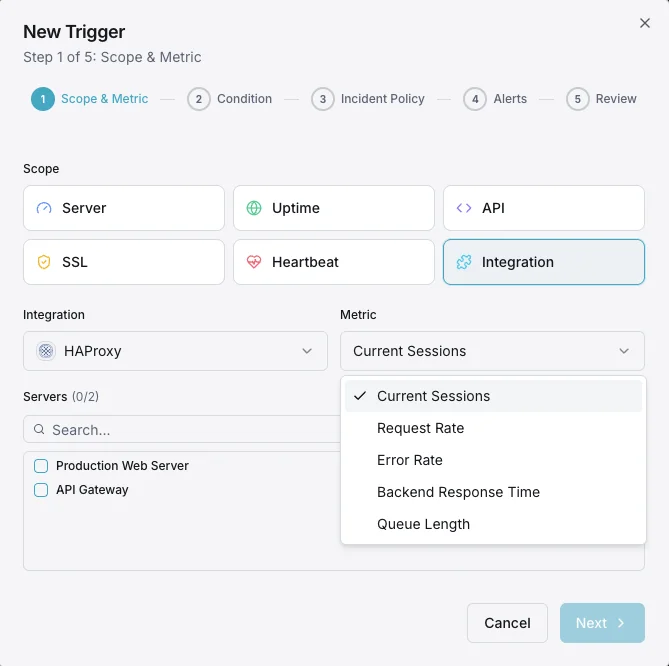
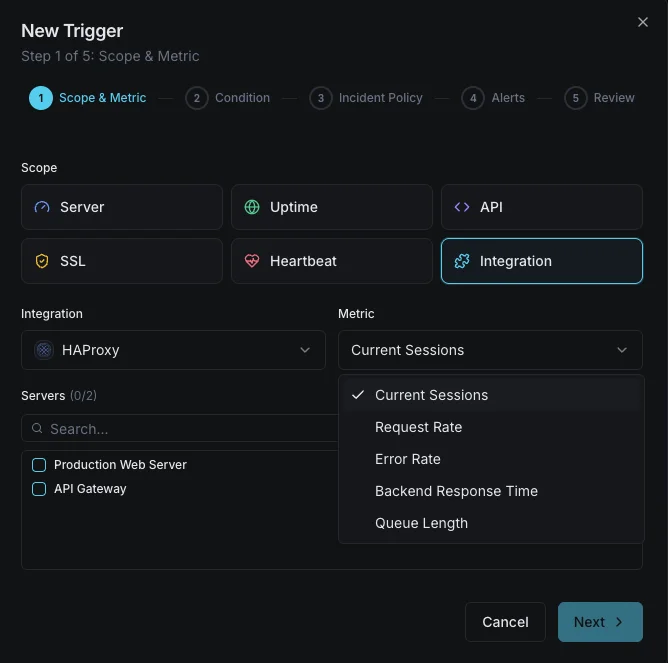
Konfigurierbare Alarmauslöser
Richten Sie benutzerdefinierte Trigger in Ihrem Dashboard ein, um benachrichtigt zu werden, sobald die Kennzahlen von „HAProxy“ Ihre festgelegten Schwellenwerte überschreiten.
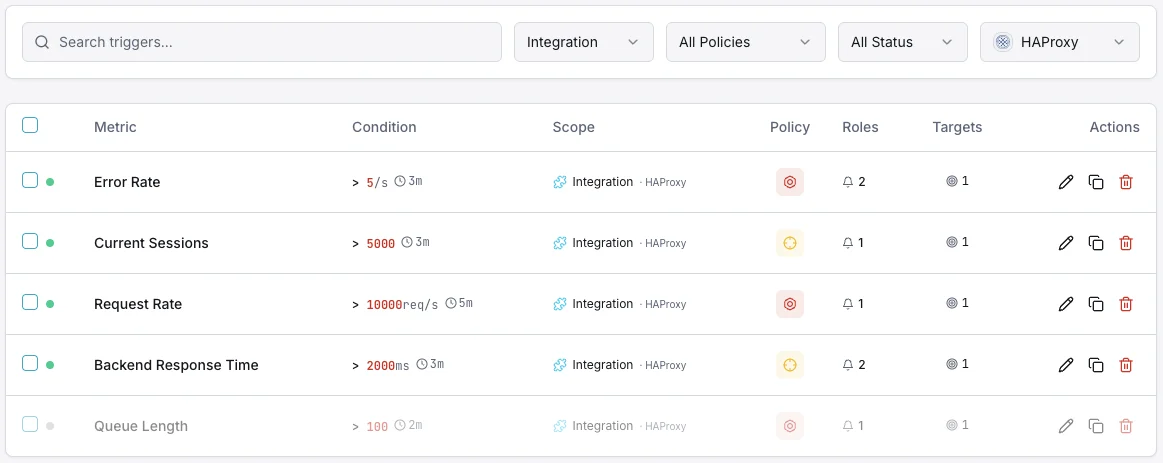
Backend ausgefallen
entscheidendLöst aus, wenn ein Backend-Server ausfällt, wodurch die Kapazität sinkt und die Gefahr einer Überlastung der verbleibenden Server besteht.
Reaktionszeit
WarnungWird ausgelöst, wenn die durchschnittliche Antwortzeit einen Schwellenwert überschreitet, was auf eine Verschlechterung der Backend-Leistung hindeutet.
Sitzungsrate
WarnungWarnmeldungen, wenn die Sitzungsrate über den normalen Basiswert hinaus ansteigt, was auf Traffic-Spitzen hindeutet.
Fehlerquote
entscheidendLöst einen Alarm aus, wenn die Fehlerquote bei Verbindungen oder Antworten über alle Backends hinweg einen Schwellenwert überschreitet.
Warteschlangenlänge
WarnungWird ausgelöst, wenn sich Anfragen in der Warteschlange stauen und auf Backend-Kapazität warten.
Sitzungslimit
entscheidendEs wird eine Benachrichtigung ausgegeben, wenn sich die Anzahl der aktiven Sitzungen der festgelegten Höchstgrenze nähert.
Bedeutung von HAProxy-Überwachung
HAProxy befindet sich am kritischen Punkt Ihres Datenverkehrs – jede Anfrage läuft darüber. Ohne Überwachung können Ausfälle im Backend, eine Überlastung der Sitzungen und sprunghafte Anstiege der Antwortzeiten unbemerkt die Verfügbarkeit Ihrer gesamten Anwendung und das Nutzererlebnis beeinträchtigen.
- Backend-Serverausfälle erkennen, bevor sie sich auf die Nutzer auswirken
- Überwachen Sie die Reaktionszeiten, um Leistungseinbußen frühzeitig zu erkennen
- Erfassen Sie die Sitzungsraten, um die Kapazitäten für Traffic-Spitzen zu planen
- Fehlermuster in Backends und Frontends identifizieren
- Stellen Sie sicher, dass die Lastverteilung auf die Server ausgewogen bleibt
Warum entscheiden Sie sich für Xitoring
Xitoring bietet HAProxy-Überwachung auf Unternehmensniveau mit einer Einrichtung ohne Konfiguration. Unser schlanker Agent erkennt Ihre HAProxy-Instanz automatisch, beginnt innerhalb von weniger als 60 Sekunden mit der Erfassung von Metriken und lässt sich in Ihre bestehenden Benachrichtigungskanäle integrieren.
- Installation mit einem einzigen Befehl – keine komplizierten YAML- oder Konfigurationsdateien
- Über 15 globale Überwachungsknoten für Überprüfungen mit geringer Latenz
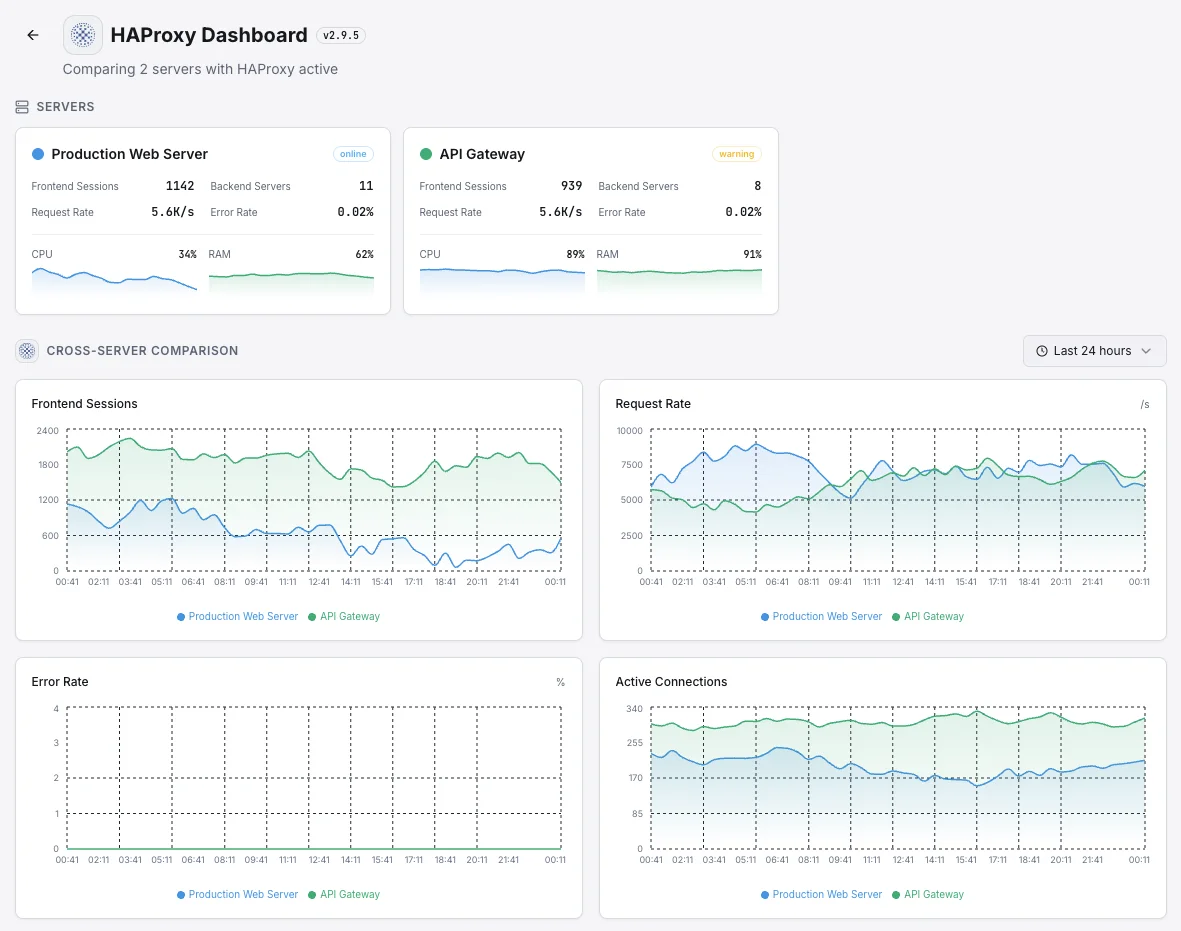
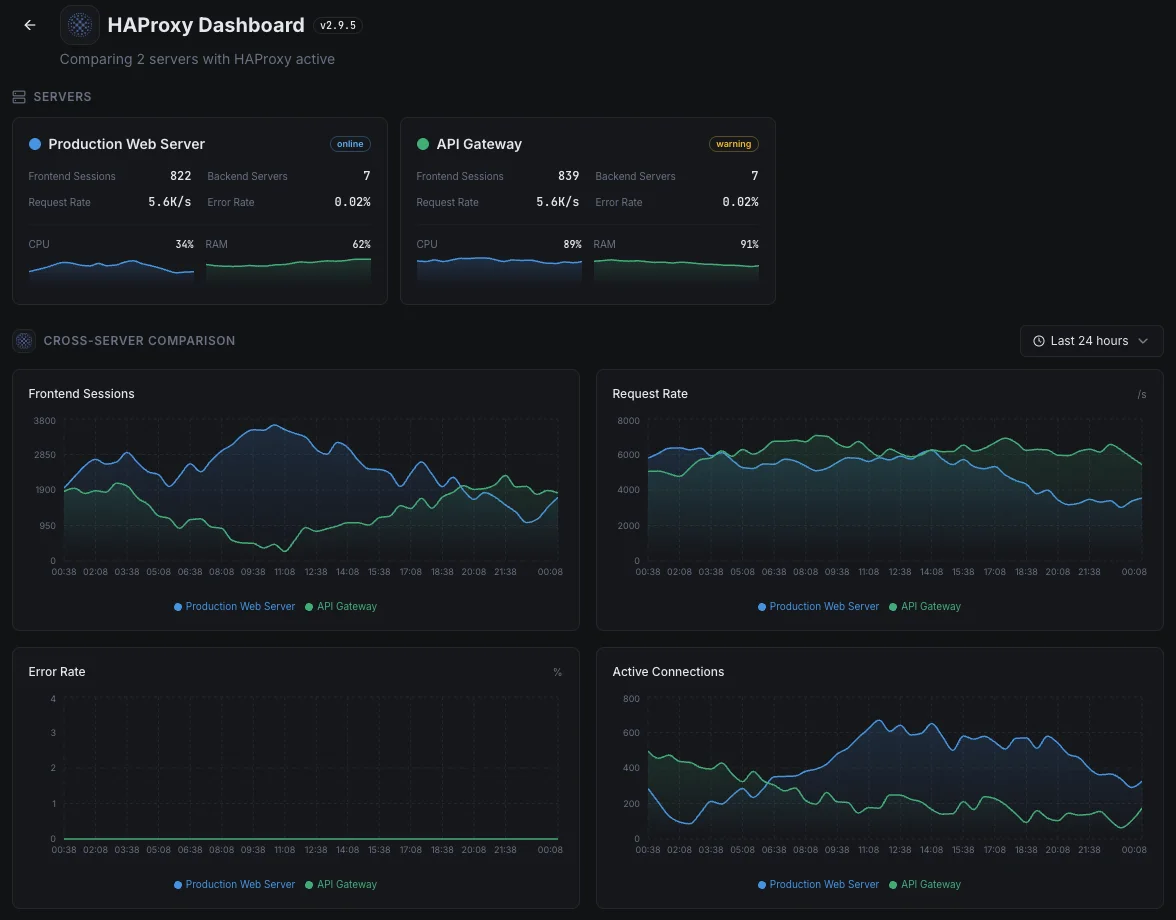
- Zentrales Dashboard für Server, Proxys und Verfügbarkeit
- Flexible Benachrichtigungen über Slack, PagerDuty, Telegram und weitere Dienste
- Aufbewahrung historischer Daten für die Kapazitätsplanung und Audits
Häufige HAProxy-Monitoring- Szenarien
Wo HAProxy heute typischerweise läuft – und was schiefgehen könnte, wenn niemand aufpasst.
Eine Datenbank bei Ausfällen online halten
HAProxy entscheidet, an welche Datenbank der Traffic gesendet werden soll, wenn die Hauptdatenbank ausfällt. Wenn es den Ausfall nicht schnell bemerkt – oder Traffic an ein überlastetes Backup sendet – fällt die Anwendung trotzdem aus. Wir überwachen die Übergabesignale, damit das Failover das tut, was es soll: für Benutzer unsichtbar bleiben.
Traffic-Gateway für eine App oder API
Wenn HAProxy vor einer App oder API sitzt, sieht es jede Anfrage und jeden Fehler, bevor es jemand anderes tut. Wir decken die Muster auf – langsame Dienste, steigende Fehler, Anfragestaus – damit das Team genau weiß, welches Teil zu beheben ist, anstatt bei einem Vorfall zu raten.
Einstiegspunkt für eine Kubernetes-App
In Kubernetes ist HAProxy oft die Tür zu Ihrer gesamten App. Ein Fehltritt dort – ein fehlerhafter Konfigurations-Push, ein fehlgeschlagener Rollout – kann alles kurzzeitig offline nehmen. Wir erkennen die Warnzeichen frühzeitig, damit routinemäßige Bereitstellungen nicht zu kundenrelevanten Ausfällen werden.
Voraussetzungen für HAProxy
Stellen Sie sicher, dass diese Punkte erfüllt sind — danach ist die Installation eine Sache von 60 Sekunden.
- HAProxy 2.x läuft auf dem Server
- Entweder ein Stats-Socket (
stats socket /var/run/haproxy.sock) oder ein HTTP-Stats-Endpunkt - Lesezugriff auf die Stats-Quelle für den Xitogent-Benutzer
Erste Schritte in Minuten
Xitogent auf Ihrem Server installieren
Falls noch nicht geschehen, installieren Sie den ressourcenschonenden Xitogent-Monitoring-Agenten auf Ihrem Server.
curl -s https://xitoring.com/install.sh | sudo bash -s -- --key=YOUR_API_KEYHAProxy-Stats-Socket oder -Seite aktivieren
Xitogent erfasst Metriken über das HAProxy-Stats-Interface. Stellen Sie sicher, dass der Stats-Socket konfiguriert ist:
# In haproxy.cfg:
listen stats
    bind localhost:8404
    stats enable
    stats uri /
# Then provide http://127.0.0.1:8404 to xitogent integrateHAProxy-Integration aktivieren
Aktivieren Sie die HAProxy-Integration über das Xitoring-Dashboard oder die CLI. Xitogent erkennt Ihre Instanz automatisch.
sudo xitogent integrateAlarmschwellen konfigurieren (optional)
Legen Sie eigene Schwellenwerte für Backend-Health, Antwortzeit oder Session-Anzahl fest, um benachrichtigt zu werden, wenn etwas Aufmerksamkeit benötigt.
Funktion überprüfen
Führen Sie diesen Befehl auf dem Server aus, um zu bestätigen, dass Xitogent die Integration erkannt hat. Innerhalb von etwa 30 Sekunden werden frische Metriken in Ihr Dashboard gestreamt.
sudo xitogent statusErwägen Sie Alternativen?
Sehen Sie, wie sich Xitoring gegen die Alternativen für HAProxy-Monitoring schlägt — Pauschalpreise, tiefere Integrationen und ein Agent, der Ihren gesamten Stack abdeckt.


Häufig gestellte Fragen
Ist für die Integration der Stats-Socket erforderlich?
Wird diese Integration die Leistung von HAProxy beeinträchtigen?
Kann ich mehrere HAProxy-Instanzen überwachen?
Kann ich einzelne Backends überwachen?
Welche HAProxy-Versionen werden unterstützt?
Wie oft werden Kennzahlen erfasst?
Wie verfolge ich Session-Rate vs. Session-Limit in HAProxy?
Wie nutze ich die HAProxy-Runtime-API, um Traffic von einem Server abzuziehen?
Welche HAProxy-Versionen werden unterstützt?
HAProxy überwachen heute
In weniger als 60 Sekunden eingerichtet. Keine Kreditkarte erforderlich. Umfassende Kennzahlen vom ersten Tag an.
Kostenlose Testversion starten