Memcached Suivi
Surveillez en temps réel les connexions Memcached, les taux de réussite, l'utilisation de la mémoire et les indicateurs d'éviction, sans aucune configuration.
Pourquoi surveiller ? Memcached?
Memcached est un système de mise en cache en mémoire distribué et hautement performant, utilisé pour accélérer les applications web dynamiques en réduisant la charge pesant sur la base de données. La surveillance de Memcached garantit une utilisation optimale du cache, détecte les « tempêtes d'éviction » et empêche l'épuisement de la mémoire au sein de votre couche de mise en cache.
La supervision Memcached, expliquée
La supervision Memcached détecte les tempêtes d'éviction, la pression mémoire, la saturation des connexions et la dégradation des taux de hit avant que des requêtes non mises en cache ne viennent marteler votre base de données. Pour le cache d'objets WordPress, les sessions PHP, le cache de résultats de requêtes Django/Rails et les déploiements AWS ElastiCache Memcached, la visibilité par nœud est ce qui fait la différence entre une alerte en 60 secondes et la découverte à 3 h du matin d'une base de données saturée à 100 % CPU. Xitoring détecte automatiquement votre Memcached, lit stats toutes les minutes et achemine les alertes vers Slack, PagerDuty, Telegram ou votre rotation d'astreinte existante.
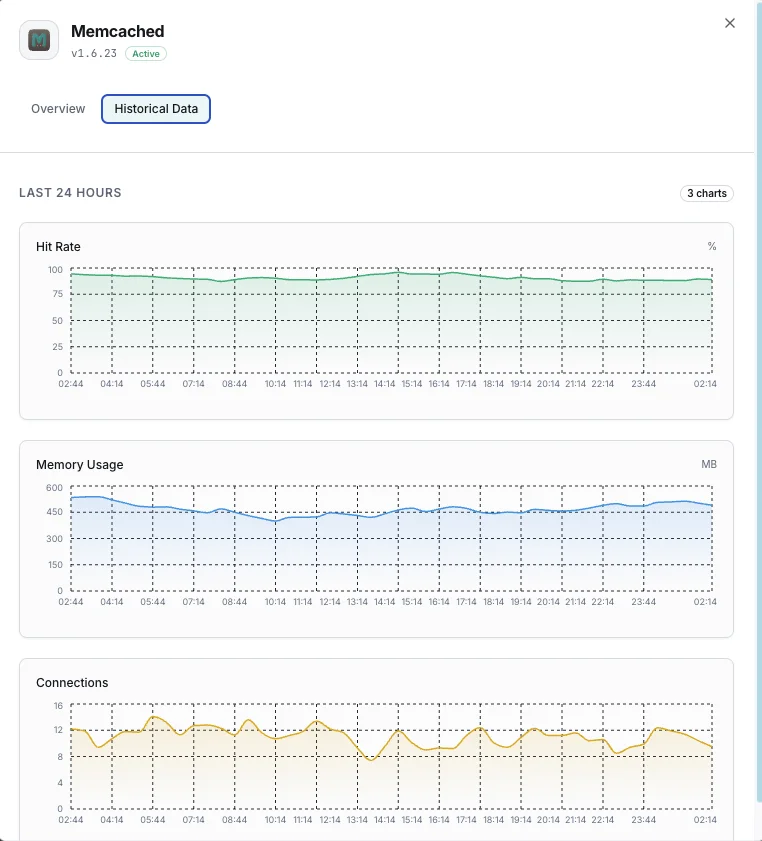
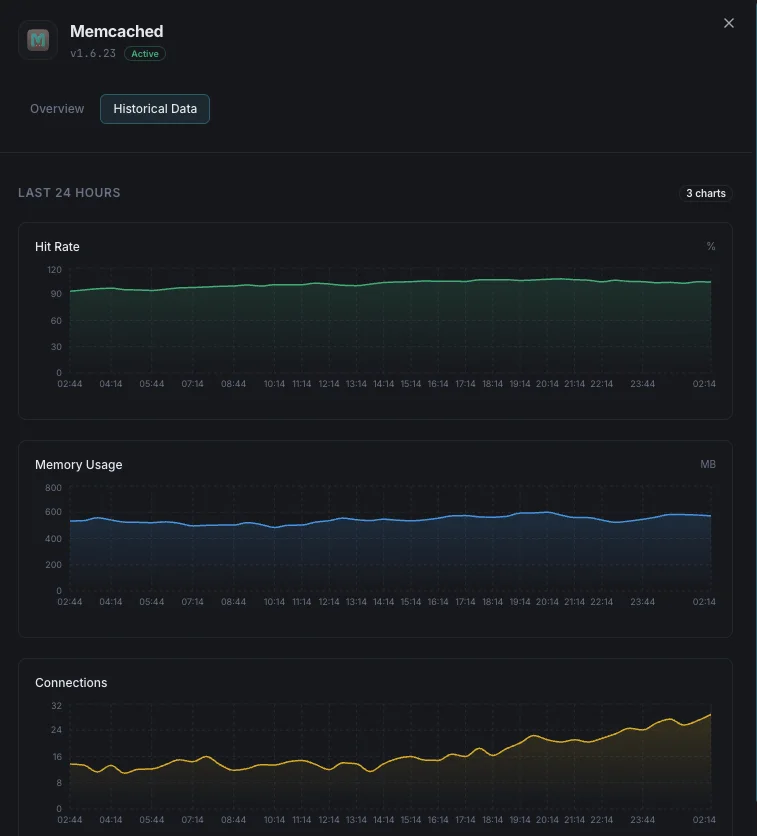
Ce que nous surveillons
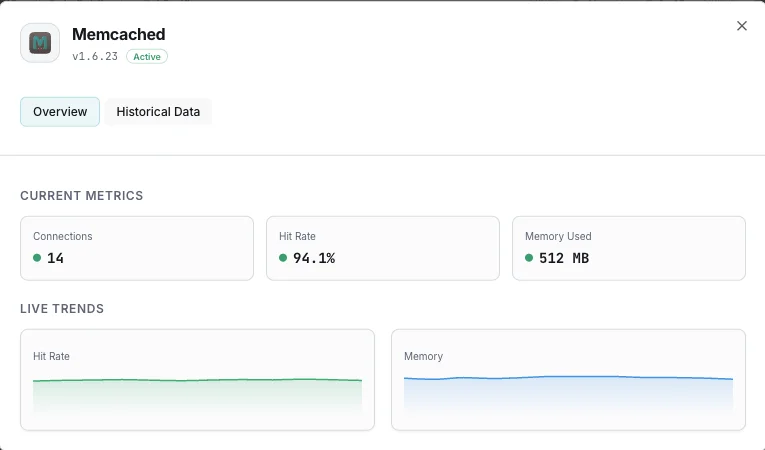
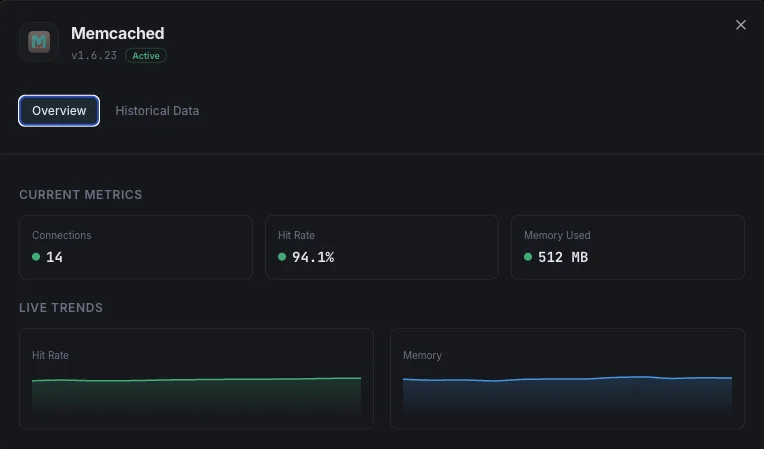
Mémoire utilisée
Mémoire totale actuellement allouée pour les éléments mis en cache.
Mémoire maximale
Limite de mémoire maximale configurée pour l'instance Memcached.
Taux de hit
Pourcentage de recherches dans le cache réussies vs manquées, indiquant l'efficacité du cache.
Évictions
Nombre d'éléments évincés pour faire de la place à de nouvelles données.
Connexions actuelles
Nombre de connexions client actuellement ouvertes.
Items stockés
Nombre total d'éléments actuellement stockés en cache.
Ratio Get/Set
Ratio des commandes get vs set, indiquant l'équilibre lecture/écriture.
Octets lus/écrits
Débit réseau total pour l'instance Memcached.
CAS Hits/Misses
Taux de réussite des opérations check-and-set pour les mises à jour concurrentes.
Utilisation des slabs
Efficacité de l'allocation mémoire entre les classes de slab.
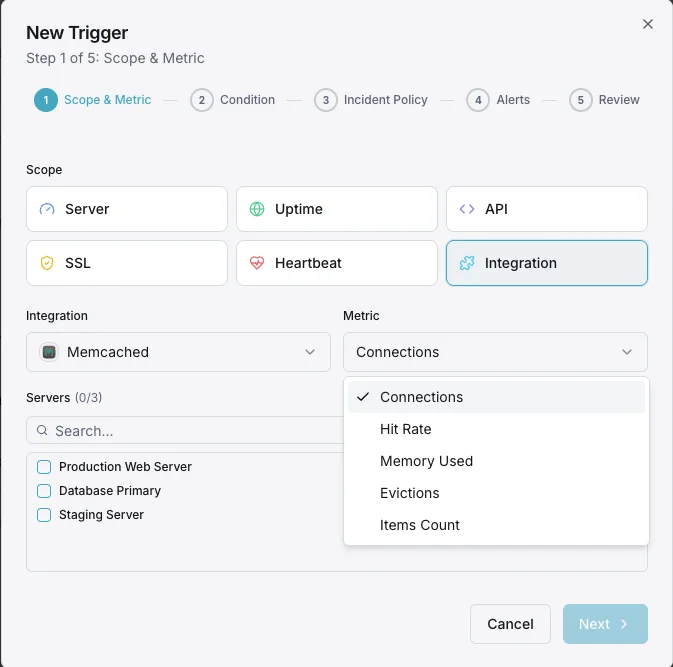
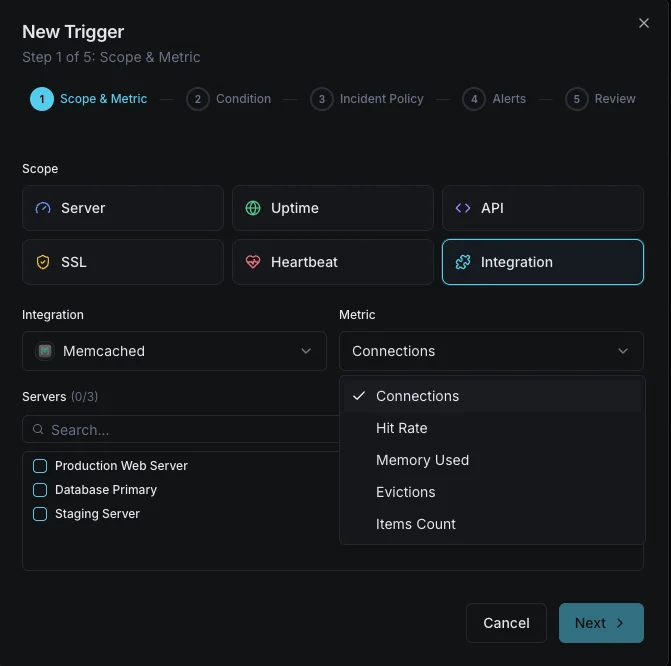
Configurables déclencheurs d'alerte
Configurez des déclencheurs personnalisés dans votre tableau de bord pour être averti dès que les indicateurs d{name}s dépassent les seuils que vous avez définis.
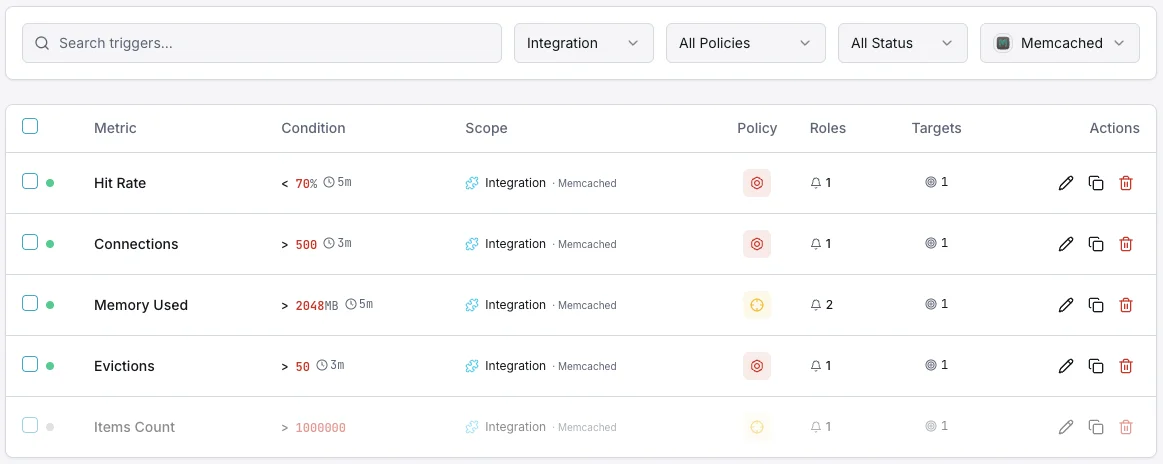
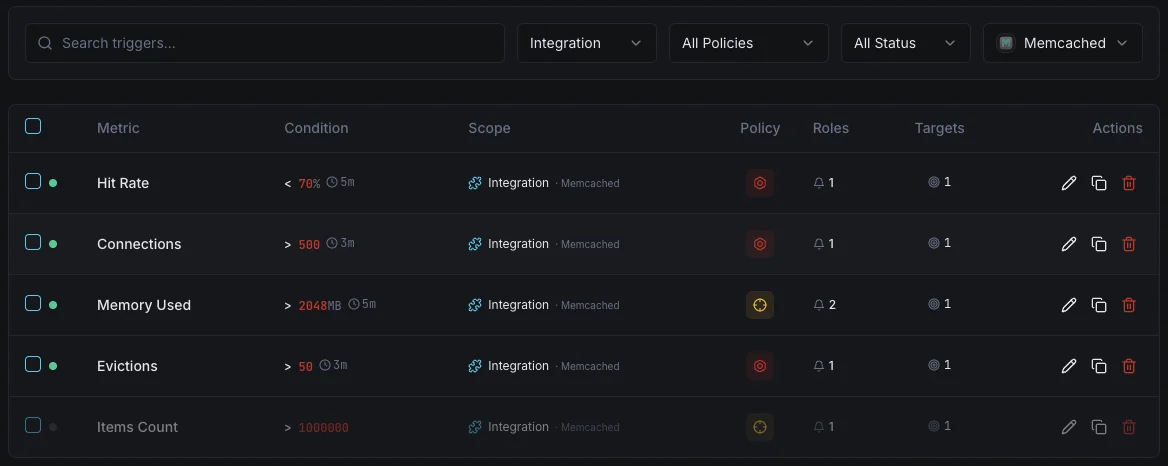
Utilisation mémoire
crucialSe déclenche lorsque la consommation mémoire de Memcached approche la limite configurée, risquant des évictions.
Chute du taux de hit
avertissementAlerte lorsque le taux de hit du cache tombe sous le seuil, indiquant une inefficacité du cache ou des changements de working set.
Taux d'éviction
crucialSe déclenche lorsque le taux d'éviction s'envole, signifiant que Memcached supprime activement des données pour rester dans les limites de mémoire.
Nombre de connexions
avertissementSe déclenche lorsque les connexions client dépassent le seuil, indiquant des fuites de connexion potentielles.
Items récupérés
avertissementAlerte lorsque les éléments expirés sont récupérés à un rythme élevé, suggérant une mauvaise configuration des TTL.
Importance de la surveillance Memcached
Memcached alimente silencieusement la couche de performance de votre application. Sans surveillance, l'épuisement mémoire, les tempêtes d'éviction et les fuites de connexion peuvent dégrader toute votre stack applicative avant que quiconque ne le remarque.
- Détectez la pression mémoire avant que les évictions n'impactent les performances de l'application
- Surveillez les taux de hit du cache pour garantir des temps de réponse optimaux
- Suivez les schémas d'éviction pour dimensionner correctement votre allocation mémoire
- Identifiez les fuites de connexion provenant des clients applicatifs
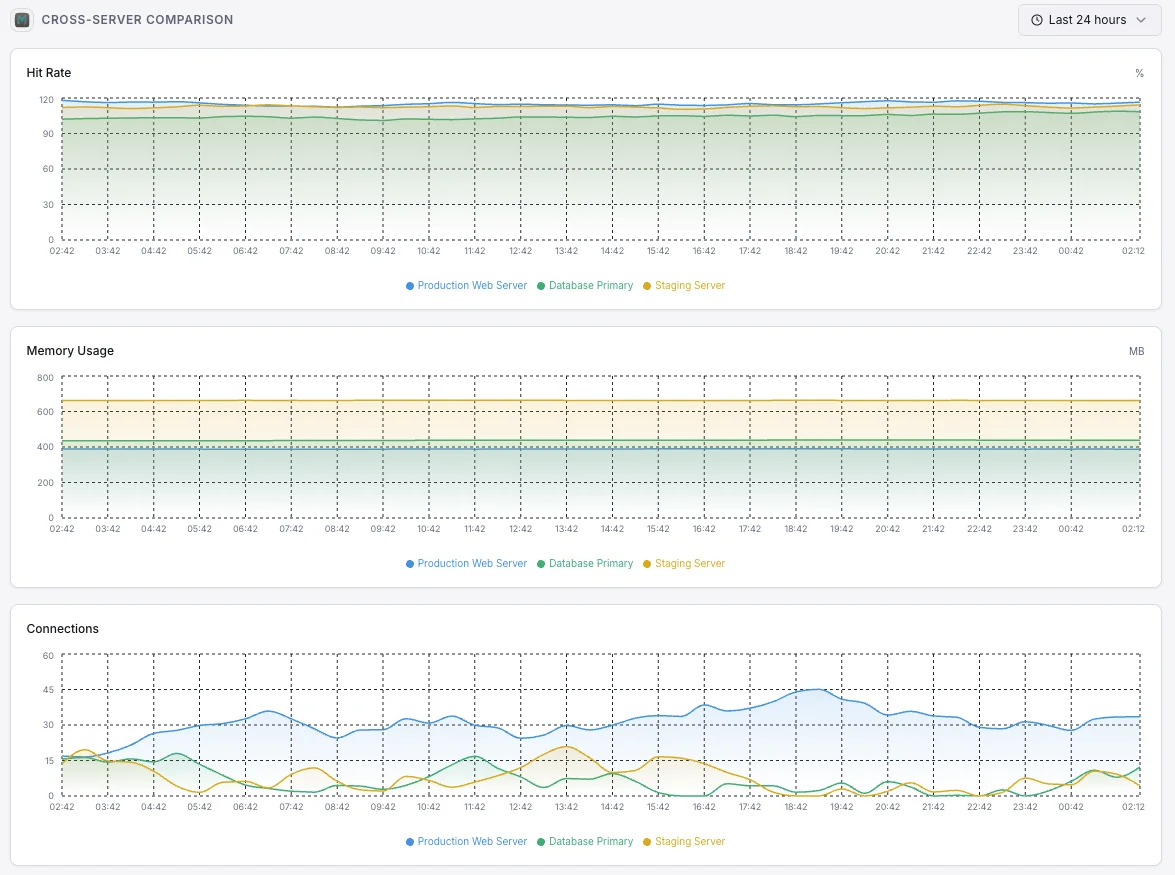
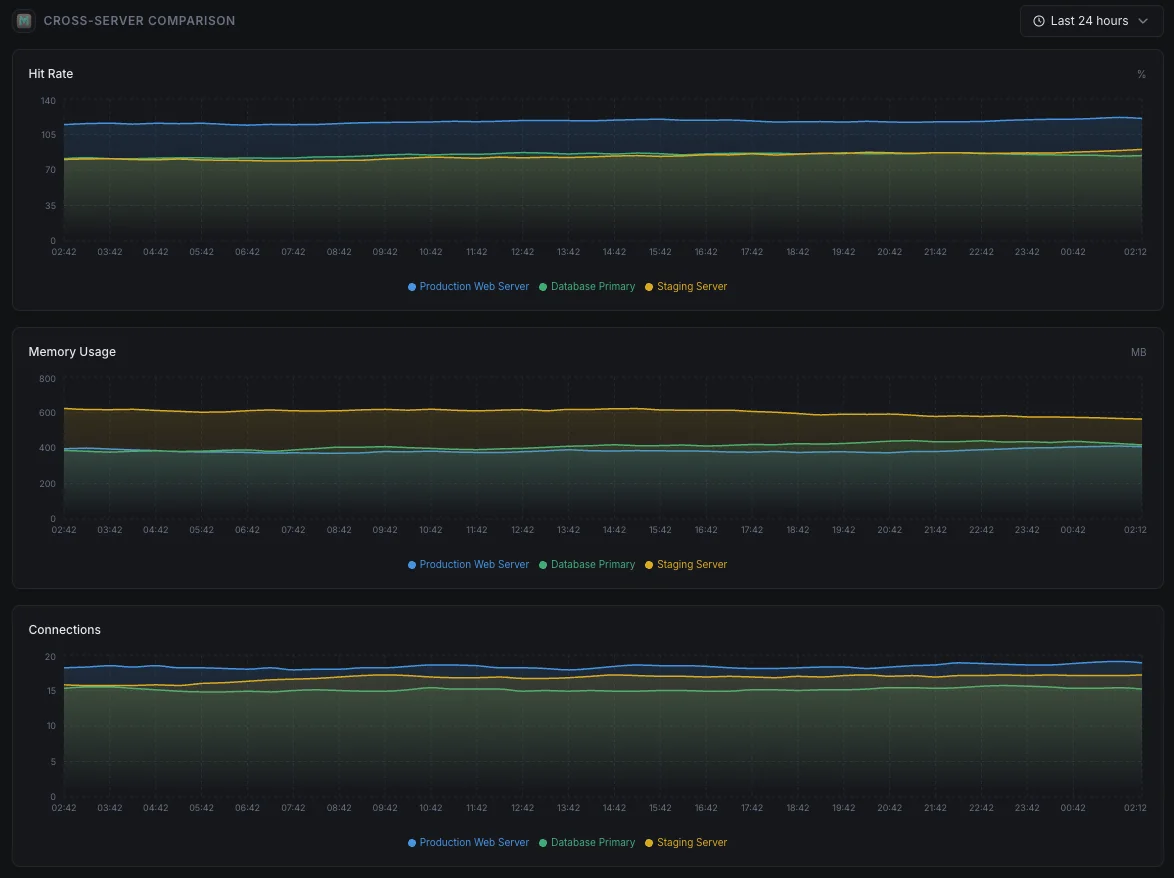
- Garantissez des performances de cache constantes sur les nœuds distribués
Pourquoi choisir Xitoring
Xitoring offre une surveillance Memcached de qualité entreprise avec une configuration zéro-config. Notre agent léger détecte automatiquement vos instances Memcached, commence à collecter des métriques en moins de 60 secondes et s'intègre à vos canaux de notification existants.
- Installation en une commande — pas de YAML complexe ni de fichiers de configuration
- 15+ nœuds de surveillance mondiaux pour des contrôles à faible latence
- Tableau de bord unifié pour serveurs, caches et uptime
- Alerting flexible via Slack, PagerDuty, Telegram et plus
- Conservation de l'historique pour la planification de capacité et les audits
Scénarios courants de supervision Memcached
Où Memcached fonctionne généralement aujourd'hui — et ce qui pourrait mal tourner si personne ne surveille.
Accélérer les sites WordPress et PHP
Memcached maintient la rapidité des sites WordPress et PHP en mémorisant les résultats des tâches répétées. Lorsque le cache ne rapporte plus, le site ralentit discrètement sous la charge. Nous le détectons tôt afin que les visiteurs et les conversions ne soient pas affectés silencieusement.
Accélérer les applications web et les API
Les applications web placent leurs résultats les plus coûteux dans le cache afin de ne pas avoir à les calculer à chaque requête. Lorsque le cache se remplit ou commence à s'agiter, le travail original revient en masse à la base de données. Nous détectons le moment où le cache cesse de protéger votre application afin que l'équipe puisse intervenir avant que les utilisateurs ne le ressentent.
Cache géré fonctionnant dans le cloud
Les fournisseurs de cloud gèrent les serveurs, mais ils ne vous disent pas quand votre propre utilisation du cache devient inefficace — manque de mémoire, atteinte des limites de connexion ou expulsion de données utiles. Nous comblons cette lacune afin que vous gardiez le contrôle des coûts et des performances.
Prérequis pour Memcached
Assurez-vous d'avoir tout cela en place — la plupart des installations sont une affaire de 60 secondes une fois ces conditions réunies.
- Memcached tournant sur son port configuré (par défaut 11211)
- Accessibilité réseau de Xitogent vers l'instance Memcached
- Commande stats accessible (aucune AUTH requise par défaut)
Commencez par procès-verbal
Installer Xitogent sur votre serveur
Si ce n'est pas déjà fait, installez l'agent de monitoring léger Xitogent sur votre serveur.
curl -s https://xitoring.com/install.sh | sudo bash -s -- --key=YOUR_API_KEYVérifier l'accessibilité des stats Memcached
Xitogent utilise la commande stats de Memcached pour collecter les métriques. Vérifiez que votre instance est accessible localement :
echo 'stats' | nc localhost 11211 | head -10Activer l'intégration Memcached
Utilisez le tableau de bord Xitoring ou la CLI pour activer l'intégration Memcached. Xitogent détectera automatiquement votre instance.
sudo xitogent integrateConfigurer les seuils d'alerte (facultatif)
Définissez des seuils personnalisés pour des métriques comme l'utilisation mémoire, le taux de hit ou le nombre d'évictions afin d'être notifié dès que quelque chose mérite votre attention.
Vérifier que tout fonctionne
Exécutez cette commande sur le serveur pour confirmer que Xitogent a bien détecté l'intégration. De nouvelles métriques apparaîtront sur votre tableau de bord dans environ 30 secondes.
sudo xitogent statusVous envisagez des alternatives ?
Découvrez comment Xitoring se positionne face aux alternatives pour la surveillance de Memcached — tarifs forfaitaires, intégrations plus poussées et un seul agent pour couvrir tout votre stack.


Souvent a posé des questions
L'intégration de Memcached nécessite-t-elle une authentification ?
Cette intégration aura-t-elle un impact sur les performances de Memcached ?
Puis-je surveiller plusieurs instances Memcached ?
Quelles versions de Memcached sont prises en charge ?
À quelle fréquence les indicateurs sont-ils collectés ?
Memcached vs Redis — lequel choisir ?
Comment lancer `stats` sur Memcached ?
Comment superviser un cluster Memcached ?
Quelles versions de Memcached sont prises en charge ?
Commencer à surveiller Memcached aujourd'hui
Configuration en moins de 60 secondes. Aucune carte bancaire requise. Statistiques complètes dès le premier jour.
Commencer l'essai gratuit