Apache Monitoraggio
Monitora in tempo reale le prestazioni del server HTTP Apache, la frequenza delle richieste e lo stato delle connessioni senza alcuna configurazione.
Perché monitorare Apache?
Apache HTTP Server è il server web più utilizzato al mondo e gestisce milioni di siti web. Il monitoraggio di Apache è fondamentale per garantire prestazioni ottimali, individuare i colli di bottiglia prima che incidano sugli utenti e mantenere un'elevata disponibilità. L'integrazione di Apache offerta da Xitoring garantisce una visibilità approfondita sullo stato di salute del server grazie alla raccolta di metriche in tempo reale tramite mod_status.
Monitoring di Apache, spiegato
Il monitoring di Apache intercetta la saturazione del worker-pool, i picchi di CPU e i pattern di risposta lenta prima che degenerino in errori 503. Su hosting condiviso cPanel/WHM o in qualsiasi configurazione multi-vhost, è anche il modo per individuare l’unico account rumoroso che sta consumando i worker degli altri — senza dover fare ssh sulla macchina alle 3 di notte. Xitoring rileva automaticamente il suo Apache, interroga /server-status?auto con un intervallo di 1 minuto e instrada gli alert verso Slack, PagerDuty, Telegram o qualsiasi altro strumento già in uso dal suo team.
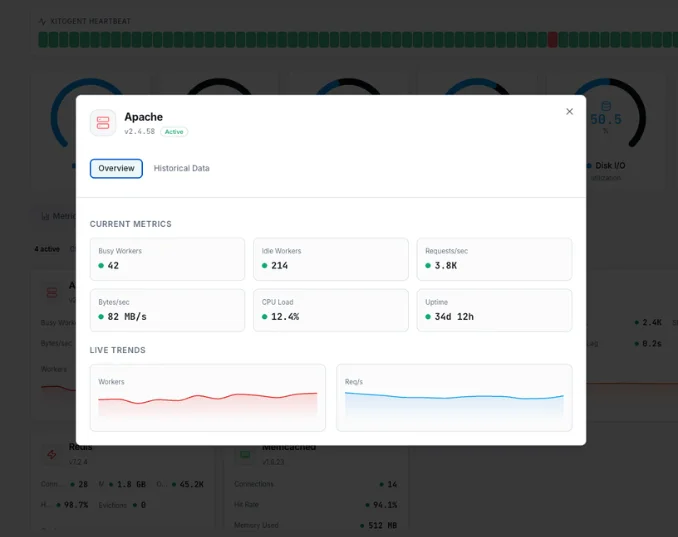
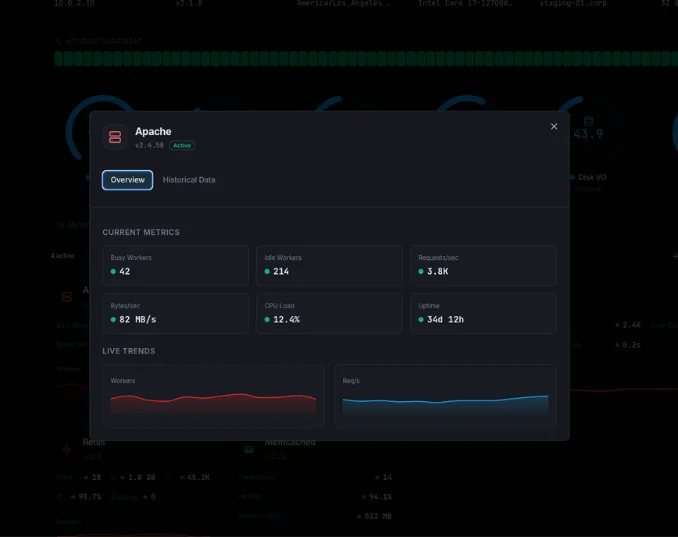
Ciò che monitoriamo
Richieste totali
Numero totale di richieste HTTP elaborate dall'avvio del server.
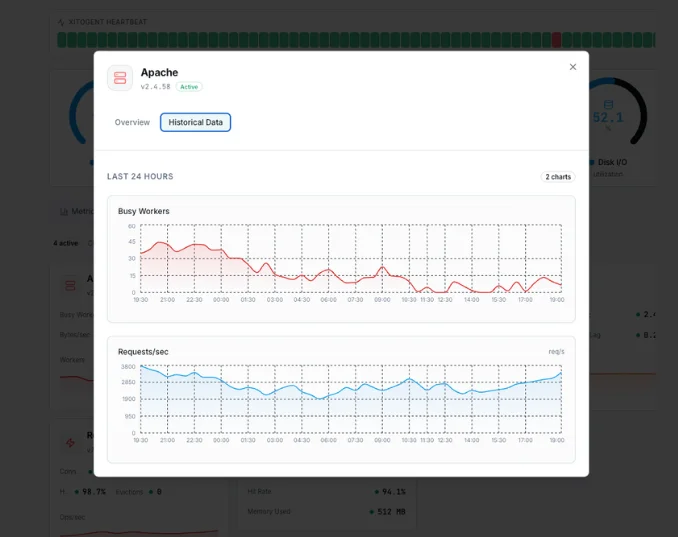
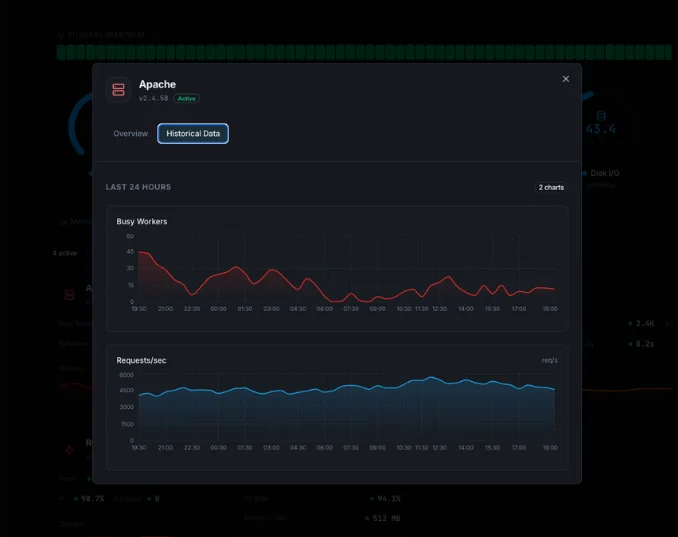
Richieste al secondo
Tasso attuale di richieste HTTP in ingresso sul server.
Byte al secondo
Tasso di throughput che misura quanti dati Apache sta servendo.
Byte per richiesta
Dimensione media della risposta per richiesta, utile per rilevare anomalie nel payload.
Worker occupati
Numero di thread worker che stanno elaborando attivamente le richieste.
Worker inattivi
Numero di thread worker in attesa di richieste in ingresso.
Connessioni totali
Numero totale di connessioni accettate dal server.
Connessioni Async Writing
Connessioni in stato di scrittura asincrona, in attesa di inviare dati ai client.
Connessioni Async Keep-Alive
Connessioni mantenute aperte in stato keep-alive per un possibile riutilizzo.
Connessioni Async Closing
Connessioni in fase di chiusura corretta.
Uptime del server
Tempo totale durante il quale il server Apache è stato in esecuzione senza riavvii.
Carico CPU
Percentuale di CPU consumata dai processi worker di Apache.
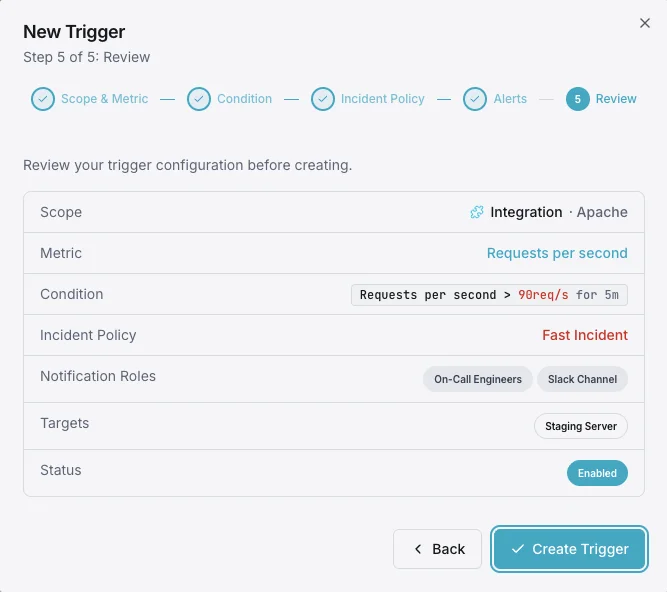
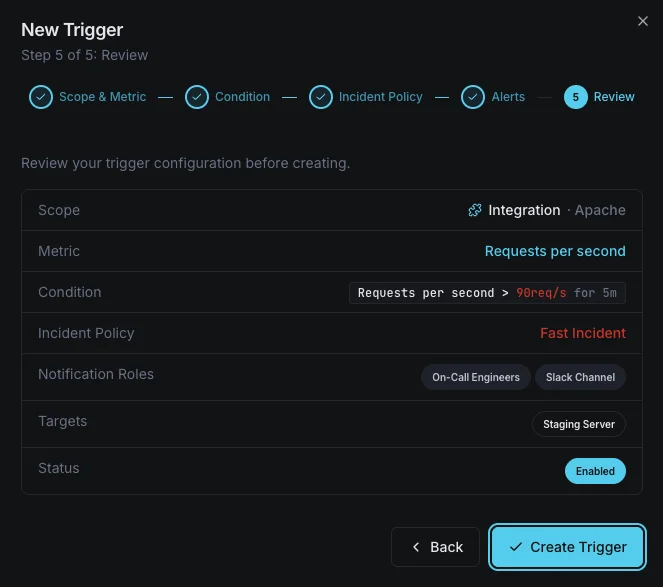
Configurabile condizioni di attivazione
Imposta dei trigger personalizzati nella tua dashboard per ricevere una notifica non appena le metriche dell{name}e superano le soglie da te definite.
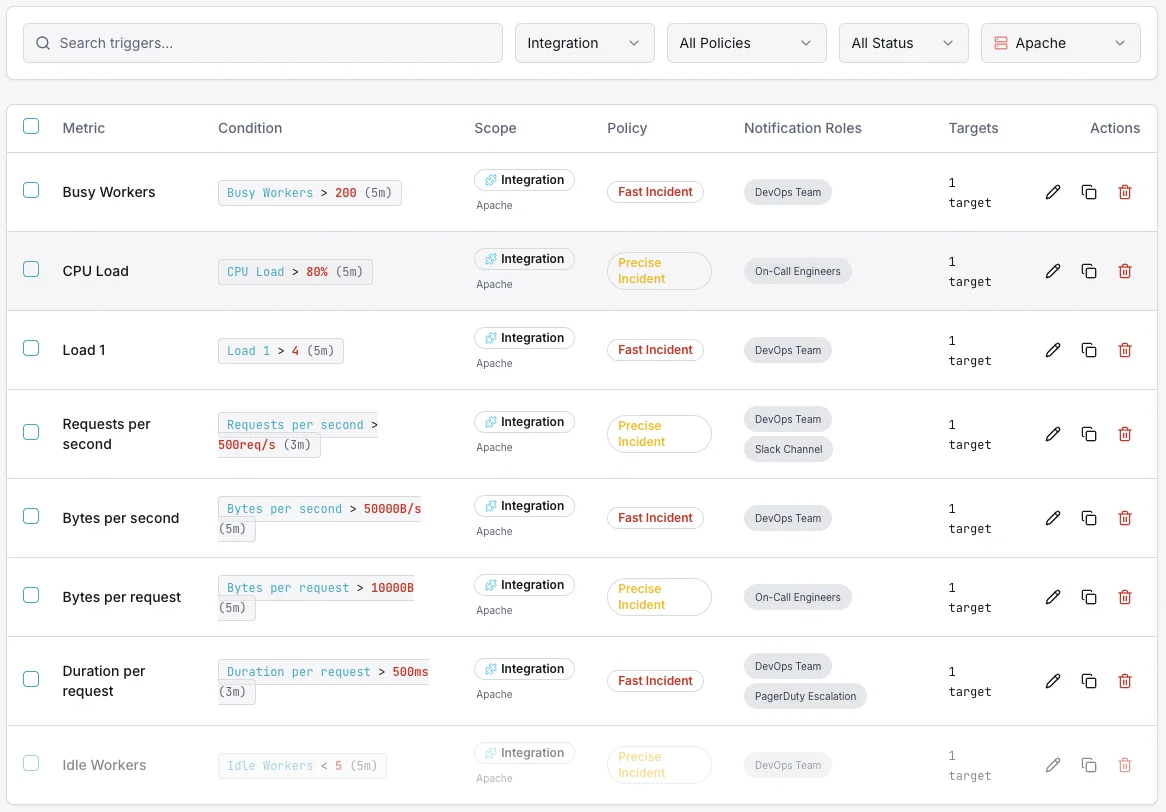
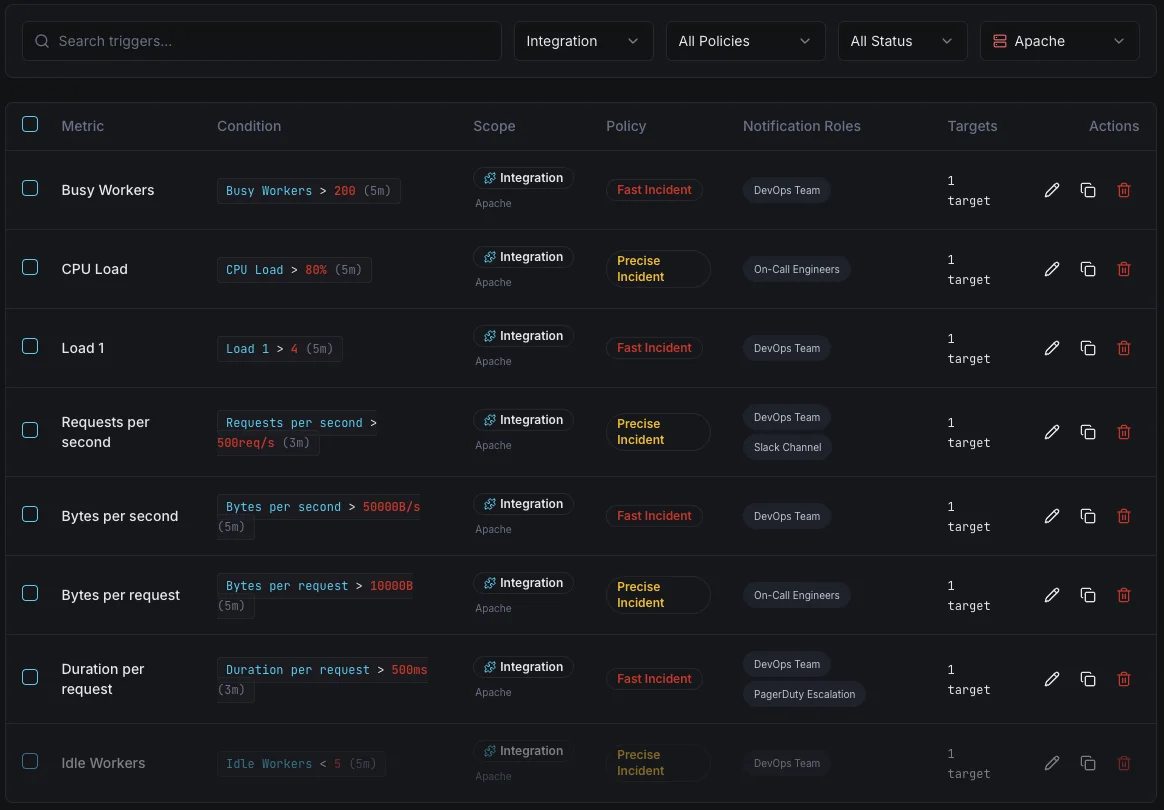
Worker occupati
avvisoSi attiva quando il numero di thread worker attivi supera la soglia, indicando un carico elevato sul server con possibile accodamento delle richieste.
Worker inattivi
criticoSi attiva quando i worker inattivi scendono sotto un minimo, segnalando che il server ha poca capacità libera per gestire picchi di traffico.
Richieste al secondo
avvisoAvvisa quando il tasso di richieste supera i valori di riferimento abituali, utile per rilevare picchi di traffico, pattern DDoS o bot fuori controllo.
Carico CPU
criticoSi attiva quando il consumo di CPU di Apache supera il limite definito, segnalando contesa di risorse che può degradare i tempi di risposta.
Byte al secondo
avvisoSi attiva su throughput anomalo: insolitamente alto (possibile esfiltrazione di dati) o basso (problemi upstream).
Reset uptime del server
criticoRileva quando il contatore di uptime del server torna a zero, indicando un riavvio imprevisto di Apache o un crash.
Importanza del monitoraggio Apache
Apache alimenta oltre il 30% di tutti i siti web attivi a livello globale. Senza un monitoraggio adeguato, degrado delle prestazioni, picchi di traffico ed esaurimento delle risorse possono passare inosservati, portando a downtime, perdita di ricavi e cattiva esperienza utente.
- Rileva tempi di risposta lenti prima che impattino sugli utenti finali
- Identifica memory leak ed esaurimento delle risorse in anticipo
- Previeni i guasti a catena nell'infrastruttura
- Mantieni la conformità SLA con visibilità in tempo reale
- Correla le metriche Apache con le prestazioni delle applicazioni upstream
Perché scegliere Xitoring
Xitoring offre un monitoraggio Apache di livello enterprise con configurazione zero-config. Il nostro agente leggero rileva automaticamente le tue istanze Apache, inizia a raccogliere metriche in meno di 60 secondi e si integra con i tuoi canali di notifica esistenti.
- Installazione con un solo comando — niente YAML o file di configurazione complessi
- Oltre 15 nodi di monitoraggio globali per controlli a bassa latenza
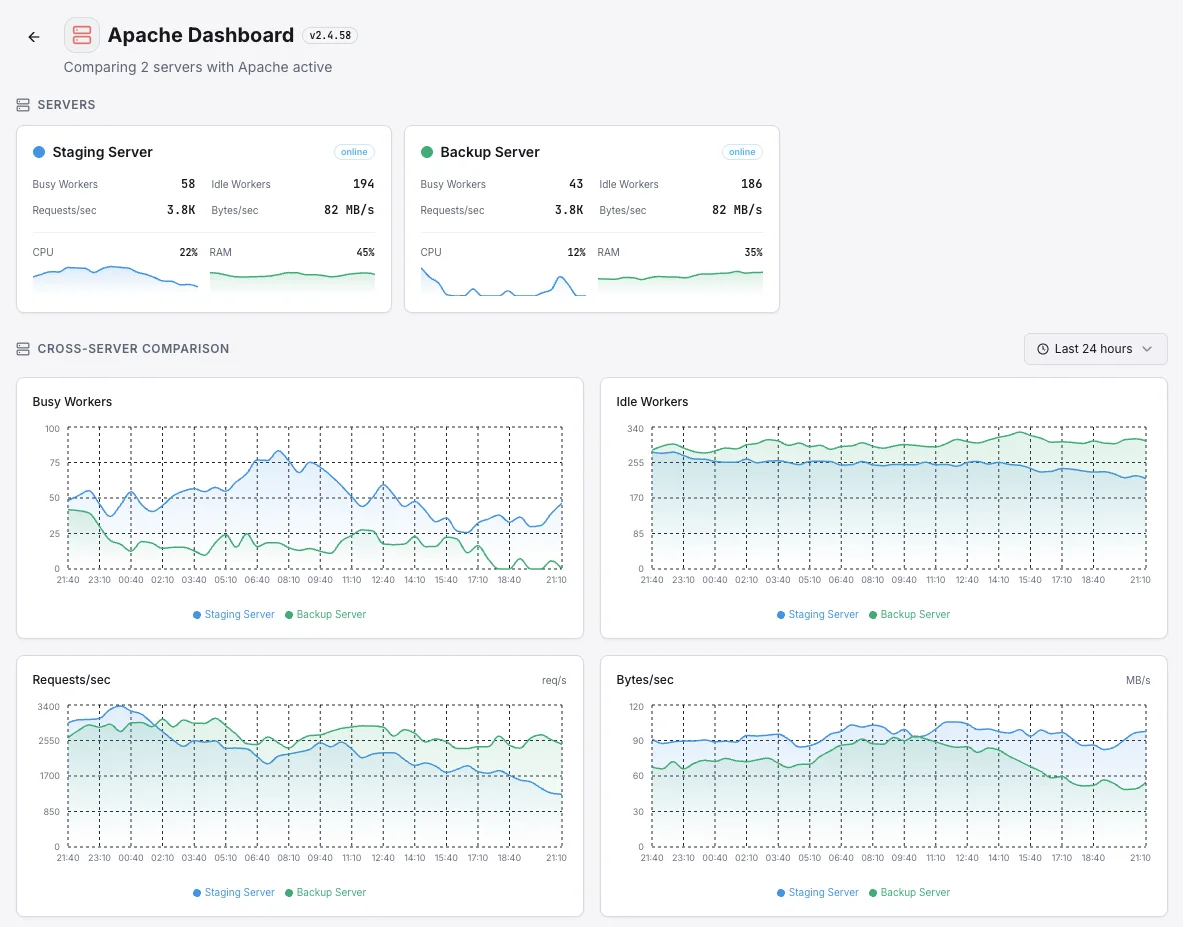
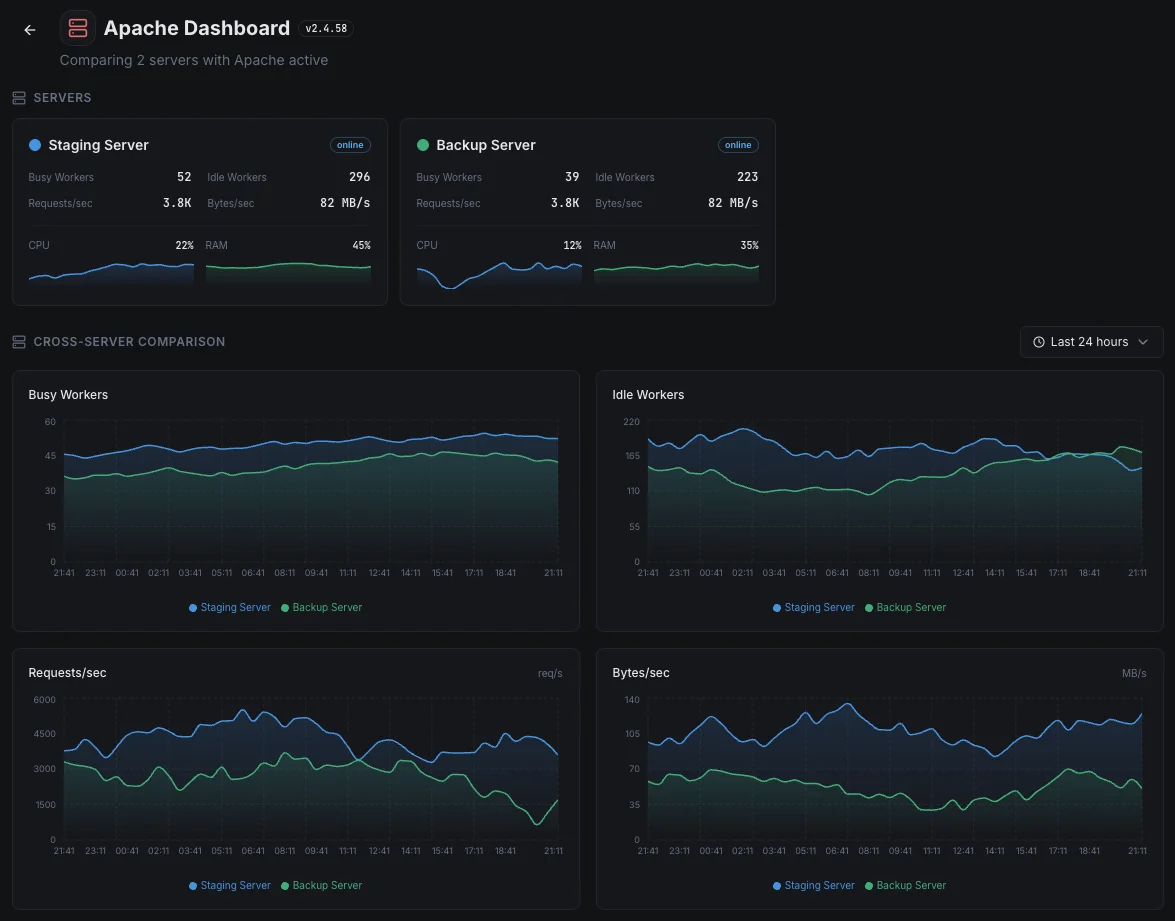
- Dashboard unificata per server, servizi e uptime
- Alerting flessibile tramite Slack, PagerDuty, Telegram e altri
- Conservazione dei dati storici per pianificazione della capacità e audit
Scenari comuni di monitoring per Apache
Dove viene solitamente utilizzato Apache al giorno d'oggi — e cosa potrebbe andare storto se nessuno lo tiene d'occhio.
Hosting WordPress o e-commerce ad alto traffico
Quando decine di siti web condividono lo stesso server — una configurazione comune per le società di hosting e le agenzie — un sito particolarmente "rumoroso" può compromettere le prestazioni di tutti gli altri siti presenti sullo stesso server. Individuiamo i primi segnali di allarme in modo che il team possa intervenire prima ancora che i clienti si trovino di fronte a una pagina lenta o non funzionante.
Sito web protetto da una rete CDN come Cloudflare
Una CDN assorbe i picchi di traffico, ma il server web di origine deve comunque funzionare correttamente — e le dashboard della CDN non segnalano quando ciò non avviene. Noi monitoriamo i segnali provenienti direttamente dal tuo server, in modo che un rallentamento impercettibile dell'origine non possa compromettere l'intero sito.
Il server web inoltra il traffico alle applicazioni che si trovano dietro di esso
Quando Apache inoltra le richieste a un'applicazione interna, il collo di bottiglia è solitamente quell'applicazione, non Apache stesso. Separiamo le due cose in modo che tu possa capire immediatamente se è necessario indagare sul livello web o sull'applicazione sottostante, invece di perdere tempo a cercare il problema nel posto sbagliato durante un incidente.
Prerequisiti per Apache
Assicurati di avere tutto questo in posizione — la maggior parte delle installazioni dura 60 secondi una volta soddisfatte le condizioni.
- Apache 2.4 o successivo in esecuzione sul server
- mod_status abilitato e raggiungibile da localhost
- Accesso sudo / root per installare Xitogent e leggere la configurazione Apache
Inizia con verbali
Installa Xitogent sul tuo server
Se non l'hai già fatto, installa il leggero agente di monitoraggio Xitogent sul tuo server.
curl -s https://xitoring.com/install.sh | sudo bash -s -- --key=YOUR_API_KEYAbilita mod_status in Apache
Assicurati che mod_status sia abilitato e accessibile localmente. Aggiungi quanto segue alla tua configurazione Apache:
<Location "/server-status">
    SetHandler server-status
    Require local
</Location>Abilita l'integrazione Apache
Usa la dashboard di Xitoring o la CLI per abilitare l'integrazione Apache. Xitogent rileva automaticamente la tua istanza Apache.
sudo xitogent integrateConfigura le soglie di allerta (opzionale)
Imposta soglie personalizzate per metriche come worker occupati, request rate o carico della CPU per essere avvisato quando qualcosa richiede attenzione.
Verifica che funzioni
Esegui questo comando sul server per confermare che Xitogent ha rilevato l'integrazione. In circa 30 secondi nuove metriche cominceranno a comparire sulla tua dashboard.
sudo xitogent statusStai valutando alternative?
Scopri come Xitoring si confronta con le alternative per il monitoraggio di Apache — prezzi fissi, integrazioni più approfondite e un unico agente che copre l'intero stack.


Spesso domande poste
L'integrazione con Apache richiede mod_status?
Questa integrazione influirà sulle prestazioni di Apache?
È possibile monitorare più istanze di Apache su un unico server?
Funziona con Apache su Windows?
Quali versioni di Apache sono supportate?
Con quale frequenza vengono raccolti i dati?
Questa integrazione influisce sulle performance di Apache?
Posso monitorare più istanze di Apache sullo stesso server?
Quali versioni di Apache sono supportate?
Inizia a monitorare Apache oggi
Configurazione in meno di 60 secondi. Non è richiesta alcuna carta di credito. Statistiche complete fin dal primo giorno.
Inizia la prova gratuita