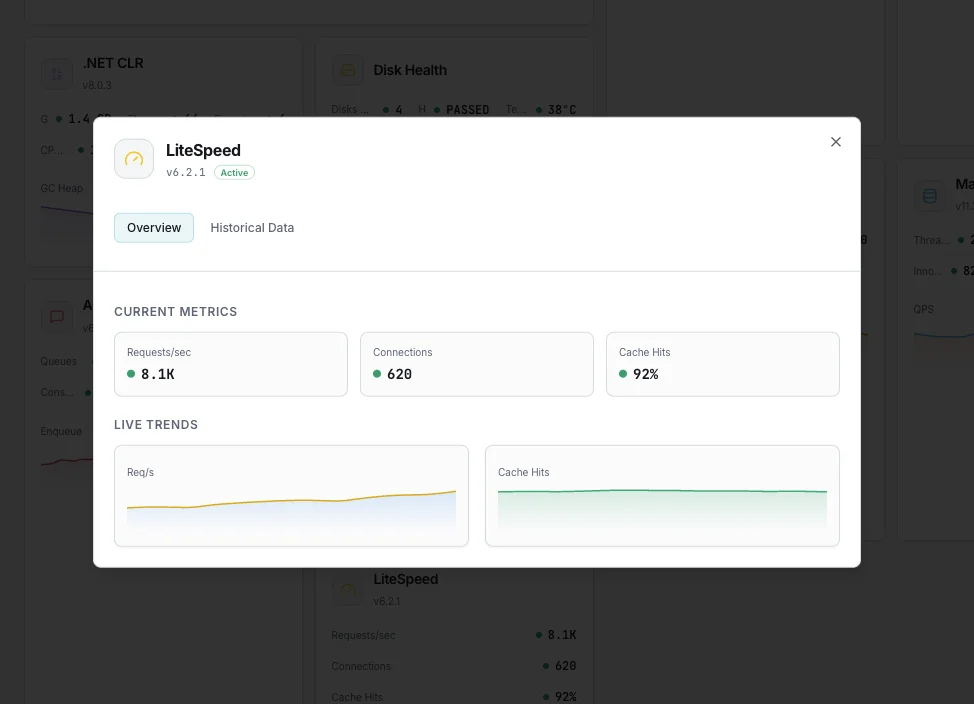
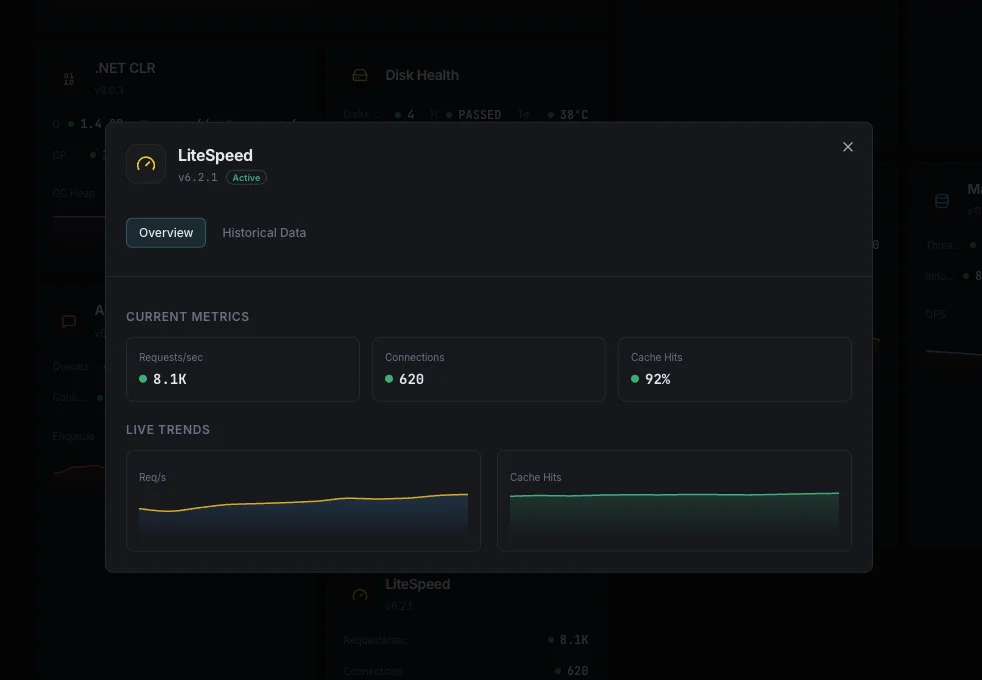
LiteSpeed Monitoraggio
Monitora in tempo reale le frequenze delle richieste di LiteSpeed Web Server, il rapporto di hit LSCache, i tempi di risposta, gli IP bloccati dall'anti-DDoS e gli stati di connessione — basato su agent, nessuna configurazione manuale.
Perché monitorare LiteSpeed?
LiteSpeed Web Server è un sostituto Apache ad alte prestazioni, plug-and-play, che alimenta molti dei siti WordPress, cPanel ed e-commerce più trafficati del web. Senza un monitoraggio dedicato, i mancati hit di LSCache, la saturazione dei worker, i picchi di IP bloccati e le risposte lente degli host virtuali possono degradare silenziosamente le prestazioni. L'integrazione LiteSpeed di Xitoring rileva automaticamente la tua istanza tramite Xitogent e preleva le metriche direttamente dal file di statistiche .rtreport in /tmp/lshttpd/ — la stessa fonte letta dalla console WebAdmin Real-Time Stats di LiteSpeed.
Monitoraggio LiteSpeed, spiegato
Il monitoraggio LiteSpeed è la pratica di raccogliere continuamente dati sulle prestazioni di LiteSpeed Web Server (LSWS) — throughput delle richieste, rapporto di hit LSCache, stati di connessione, tempi di risposta e segnali anti-DDoS — e di avvisare quando una di queste metriche si discosta dalle soglie di salute. È così che i team operativi rilevano i mancati hit della cache, la saturazione dei worker o i rallentamenti degli host virtuali prima che gli utenti se ne accorgano.
Ciò che monitoriamo
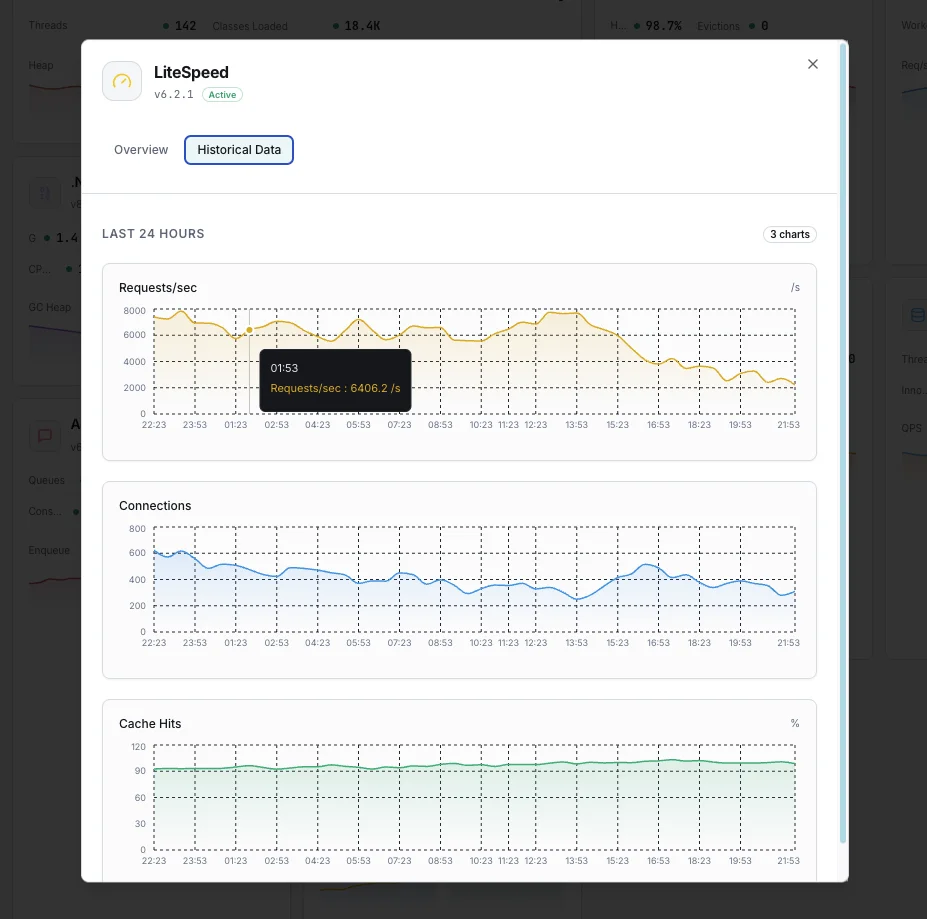
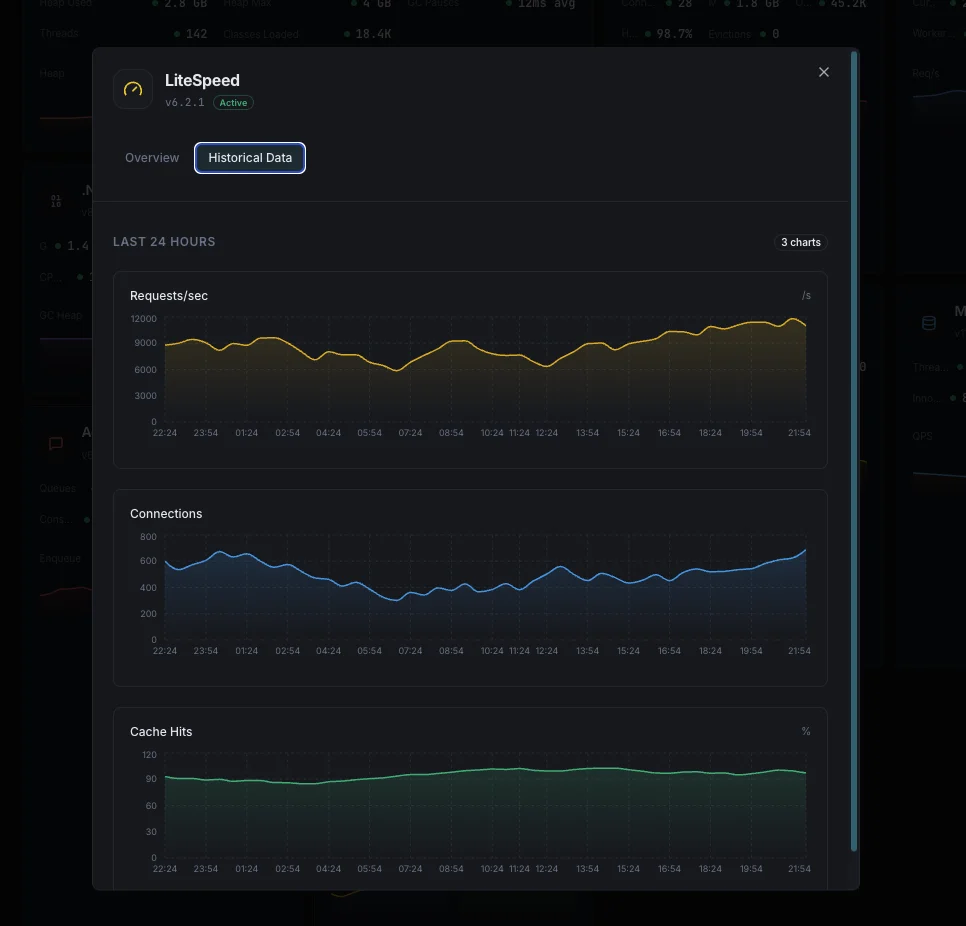
Richieste / sec
Frequenza delle richieste HTTP in tempo reale servite da LiteSpeed, suddivise per host virtuale. I picchi segnalano aumenti di traffico o attacchi prima che gli utenti percepiscano la latenza.
Hit cache pubblica / sec
Hit della cache pubblica LSCache al secondo — il segnale di ranking che la console LiteSpeed WebAdmin espone nativamente. Fondamentale per le configurazioni WordPress + LSCWP.
Hit cache privata / sec
Hit della cache privata LSCache — pagine utente loggate e contenuti personalizzati. Un profilo di efficienza diverso dalla cache pubblica.
Hit statici / sec
Hit di asset statici al secondo. Il rapporto statico-vs-dinamico è un input fondamentale per l'ottimizzazione della cache.
Tempo di risposta
Latenza end-to-end per servire una richiesta. Traccia p50, p95 e p99 per rilevare regressioni della latenza di coda invisibili alle medie.
Connessioni attive
Totale connessioni HTTP attive, inattive e keep-alive. Avvicinarsi al limite di connessioni dei worker significa essere a un picco di traffico dalla formazione di code.
Connessioni SSL / HTTPS
Connessioni SSL/TLS attive e throughput HTTPS in kilobit/sec — separato dall'HTTP semplice per una diagnosi più pulita.
Throughput HTTP / HTTPS
Larghezza di banda di rete servita tramite HTTP vs HTTPS. Le anomalie spesso emergono qui prima di manifestarsi nei conteggi delle richieste.
IP bloccati dall'anti-DDoS
Numero di IP che il livello anti-DDoS di LiteSpeed sta attualmente bloccando. Picchi improvvisi indicano attacchi attivi o client malfunzionanti.
Processi worker
Conteggio dei worker LiteSpeed attivi e memoria per worker. Il ricambio dei worker o la pressione della memoria sono i principali indicatori di riavvii.
Stato dell'host virtuale
Stato di elaborazione delle richieste per vhost. Permette di isolare quale sito o dominio è degradato quando i numeri complessivi sembrano a posto.
Stato dell'applicazione esterna
Stato e utilizzo delle risorse delle app esterne di LiteSpeed (lscgid, worker PHP LSAPI). Rileva rallentamenti in stile PHP-FPM all'interno di LSWS.
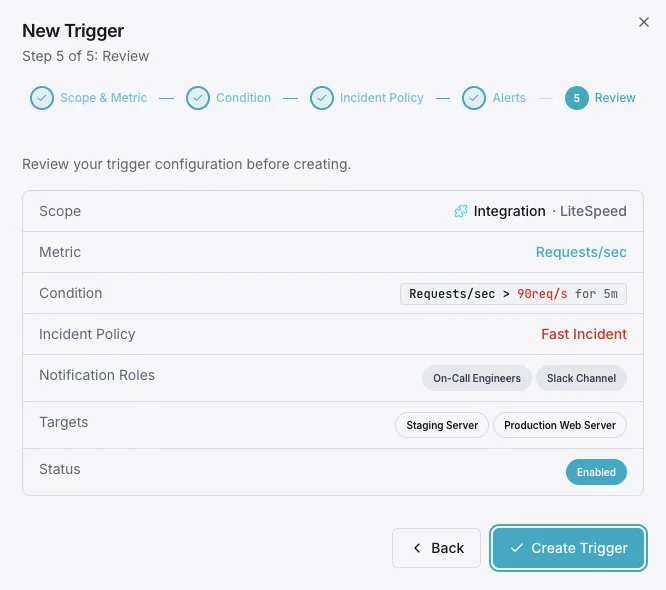
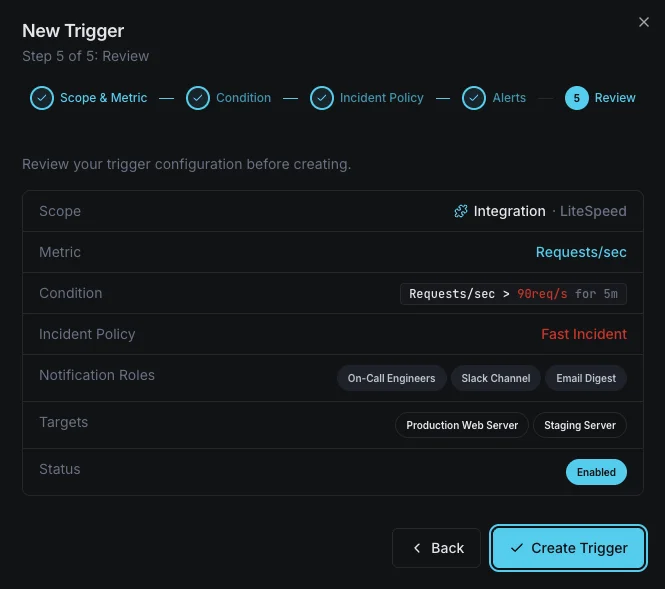
Configurabile condizioni di attivazione
Imposta dei trigger personalizzati nella tua dashboard per ricevere una notifica non appena le metriche dell{name}e superano le soglie da te definite.
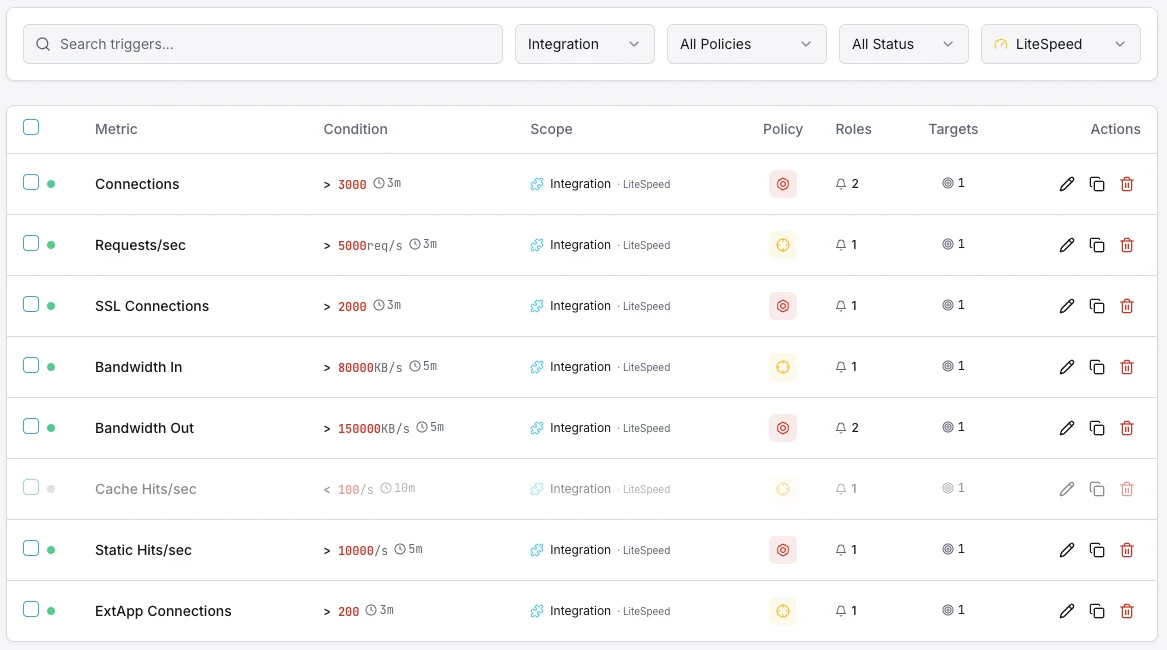
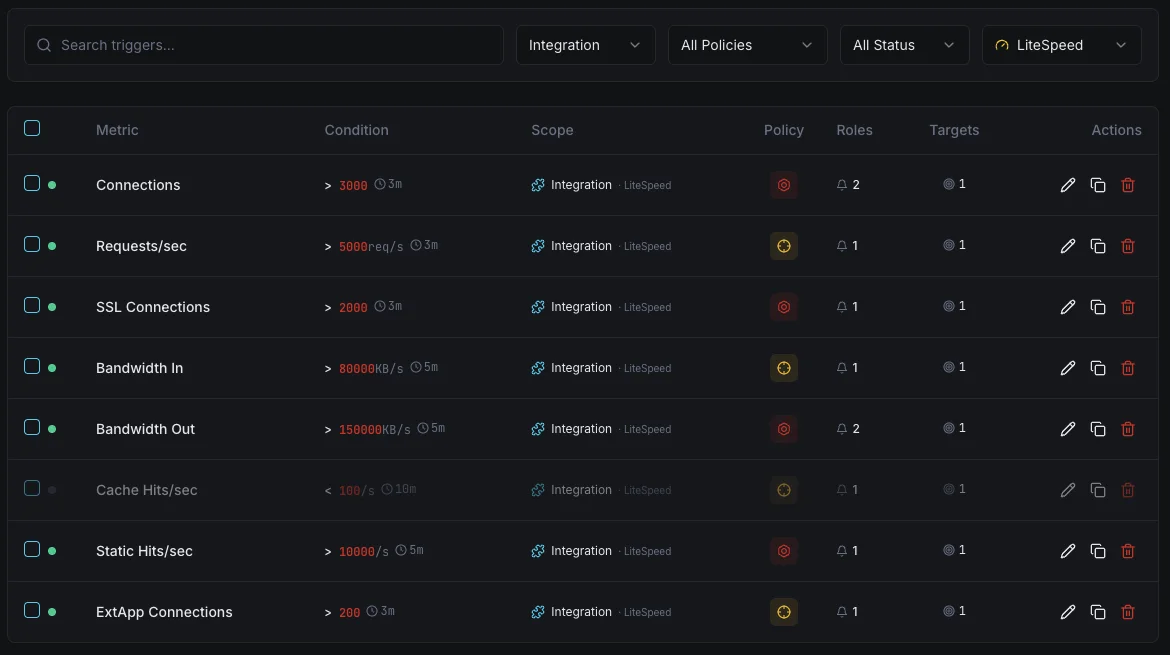
Tasso di richieste
avvisoSi attiva quando il tasso di richieste supera la soglia, indicando un picco di traffico o un possibile attacco.
Rapporto di cache hit
avvisoSi attiva quando il rapporto di hit di LSCache scende, aumentando il carico sull'origine.
Tempo di risposta
criticoAvvisa quando il tempo di risposta medio supera la soglia, degradando l'esperienza utente.
Limite di connessioni
criticoSi attiva quando le connessioni attive si avvicinano ai limiti del server.
Larghezza di banda
avvisoSi attiva su pattern di throughput anomali.
Importanza del monitoraggio LiteSpeed
LiteSpeed alimenta siti ad alto traffico con la sua architettura event-driven. Senza monitoraggio, cache miss, saturazione delle connessioni e risposte lente possono degradare silenziosamente le prestazioni.
- Rileva inefficienze della cache prima che impattino sui tempi di caricamento
- Monitora gli stati di connessione per prevenire la saturazione
- Tieni traccia dei tempi di risposta sulla tua flotta web
- Identifica in anticipo le anomalie di larghezza di banda
Perché scegliere Xitoring
Xitoring offre un monitoraggio LiteSpeed di livello enterprise con configurazione zero-config. Il nostro agente leggero rileva automaticamente le tue istanze e inizia a raccogliere metriche in meno di 60 secondi.
- Installazione con un solo comando
- Oltre 15 nodi di monitoraggio globali
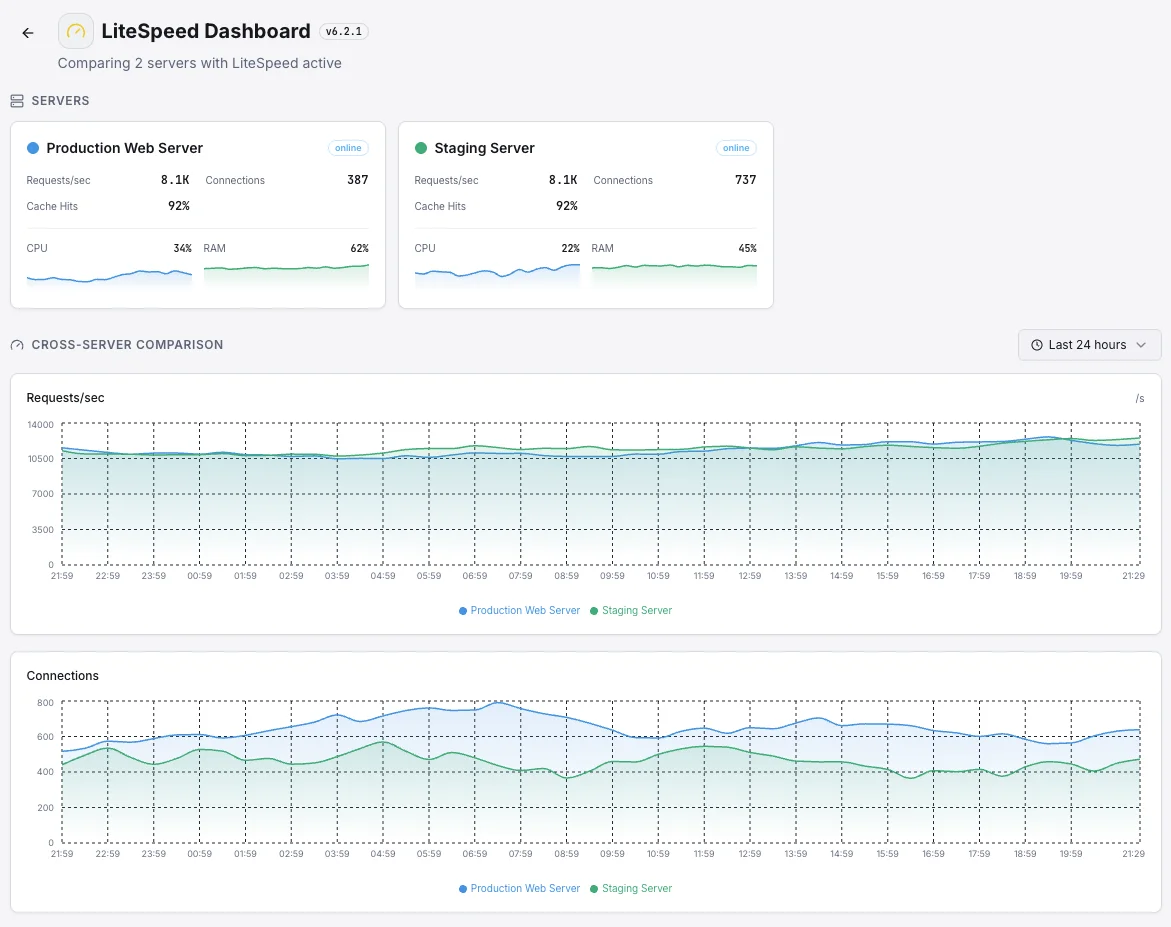
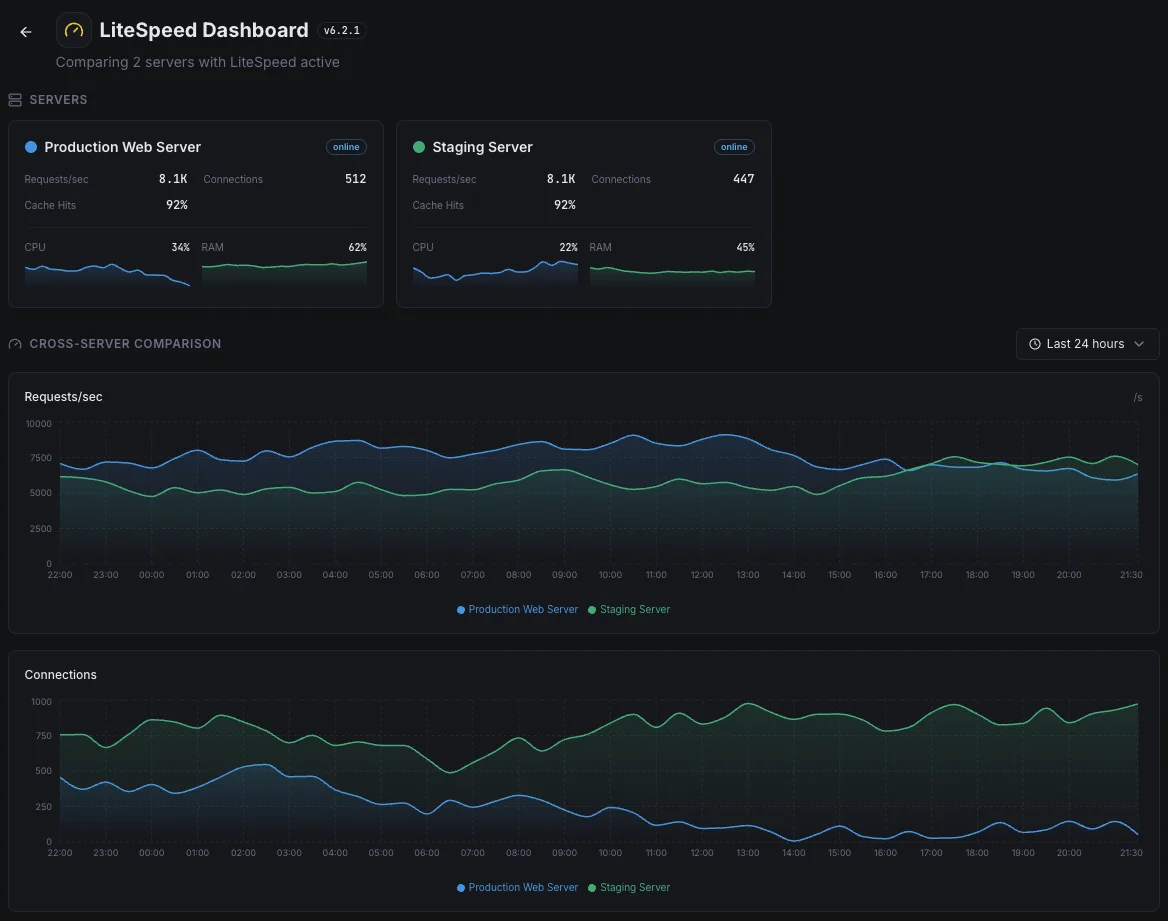
- Dashboard unificata per tutti i servizi
- Alerting flessibile tramite Slack, PagerDuty, Telegram e altri
- Conservazione dei dati storici per pianificazione della capacità
Monitoraggio LiteSpeed comune scenari
Dove LiteSpeed viene tipicamente eseguito oggi — e cosa potrebbe andare storto se nessuno lo monitora.
Siti WordPress veloci
I siti WordPress utilizzano la cache integrata di LiteSpeed per caricarsi in meno di un secondo. Quando quella cache smette di funzionare come previsto, la velocità della pagina diminuisce e i visitatori rimbalzano silenziosamente. Rileviamo il calo nel momento in cui inizia in modo che il team possa agire prima che i posizionamenti nei motori di ricerca e le conversioni ne risentano.
Server di hosting che eseguono molti siti web
Su un server di hosting, un sito cliente "avido" può privare di risorse ogni altro sito che condivide la stessa macchina. Mostriamo quali siti stanno utilizzando la maggior parte delle risorse in modo che il team possa affrontare la causa prima che le pagine di tutti gli altri inizino a rallentare.
Negozi online trafficati
I negozi online sollecitano maggiormente il loro server web al momento del checkout — il momento esatto in cui una pagina lenta costa entrate reali. Monitoriamo i segnali che mostrano se il negozio può gestire un picco di traffico in modo che il team possa prepararsi per saldi e promozioni con fiducia.
Prerequisiti per LiteSpeed
Assicurati di avere tutto questo in posizione — la maggior parte delle installazioni dura 60 secondi una volta soddisfatte le condizioni.
- LiteSpeed Web Server (Enterprise) 5.x o 6.x installato e in esecuzione
- Percorso delle statistiche LiteSpeed accessibile (predefinito
/tmp/lshttpd/) - Accesso root sull'host per installare Xitogent
Inizia con verbali
Installa Xitogent sul tuo server
Installa il leggero agente di monitoraggio Xitogent.
curl -s https://xitoring.com/install.sh | sudo bash -s -- --key=YOUR_API_KEYAbilita l'integrazione LiteSpeed
Usa la dashboard di Xitoring o la CLI per abilitare l'integrazione LiteSpeed.
sudo xitogent integrateConfigura le soglie di allerta (opzionale)
Imposta soglie personalizzate per cache hit ratio, request rate o tempo di risposta.
Verifica che funzioni
Esegui questo comando sul server per confermare che Xitogent ha rilevato l'integrazione. In circa 30 secondi nuove metriche cominceranno a comparire sulla tua dashboard.
sudo xitogent statusStai valutando alternative?
Scopri come Xitoring si confronta con le alternative per il monitoraggio di LiteSpeed — prezzi fissi, integrazioni più approfondite e un unico agente che copre l'intero stack.


Spesso domande poste
Cos'è il monitoraggio LiteSpeed?
Perché il monitoraggio LiteSpeed è importante?
Come si monitora il rapporto di hit di LSCache?
Come posso monitorare LiteSpeed in tempo reale?
Funziona con LiteSpeed Enterprise e OpenLiteSpeed?
Xitogent influirà sulle prestazioni di LiteSpeed?
Quali versioni di LiteSpeed sono supportate?
Con quale frequenza vengono raccolte le metriche?
Qual è la differenza tra il monitoraggio LiteSpeed e OpenLiteSpeed?
Inizia a monitorare LiteSpeed oggi
Configurazione in meno di 60 secondi. Non è richiesta alcuna carta di credito. Statistiche complete fin dal primo giorno.
Inizia la prova gratuitaContinua a esplorare