MSSQL Monitoraggio
Monitora in tempo reale le prestazioni delle query di Microsoft SQL Server, le statistiche di attesa, la cache del buffer e lo stato del log delle transazioni senza alcuna configurazione.
Perché monitorare MSSQL?
Microsoft SQL Server è alla base di applicazioni aziendali, data warehouse e piattaforme di business intelligence in tutto il mondo. Il monitoraggio di MSSQL è fondamentale per ottimizzare i piani di esecuzione delle query, tenere traccia delle statistiche di attesa, gestire l'efficienza della cache del buffer e individuare i deadlock. L'integrazione MSSQL di Xitoring offre una visibilità completa sulle vostre istanze di SQL Server.
Monitoraggio di SQL Server, spiegato
Il monitoraggio di SQL Server intercetta catene di blocking, tempeste di deadlock, drift di Always On AG, pressione di memoria e regressioni di piano in Query Store prima che causino rallentamenti visibili agli utenti o eventi di failover HA. Per Dynamics 365, SharePoint, ERP e qualsiasi workload SQL enterprise, la visibilità per database su wait-stats e Query Store è ciò che separa un tuning fix pulito da una caccia alla causa che dura giorni. Xitoring rileva automaticamente SQL Server, legge le DMV native con il permesso VIEW SERVER STATE e instrada le allerte su Slack, PagerDuty, Telegram o sul Suo sistema di on-call esistente.
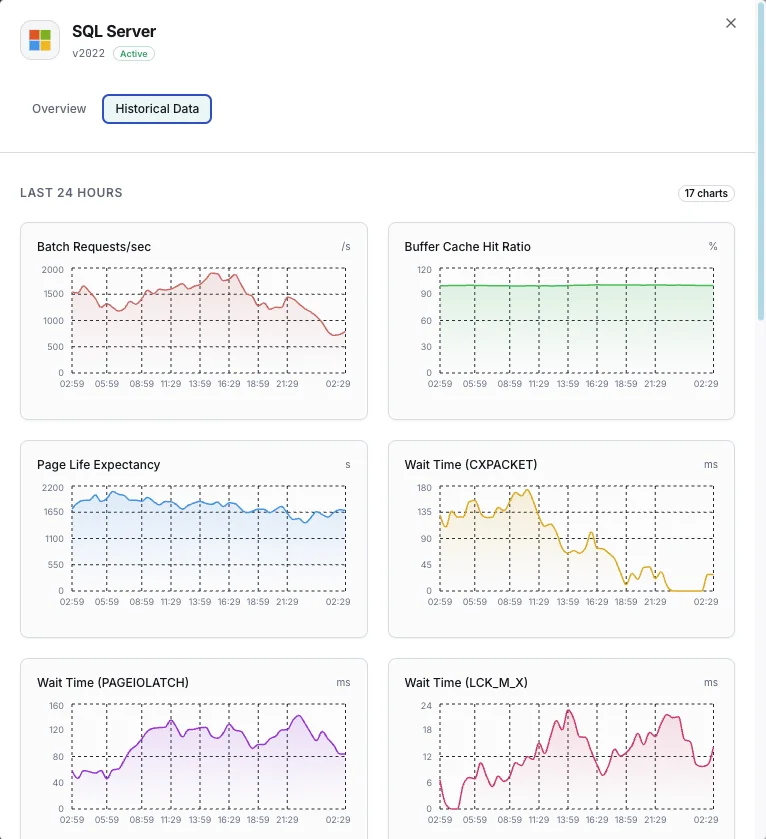
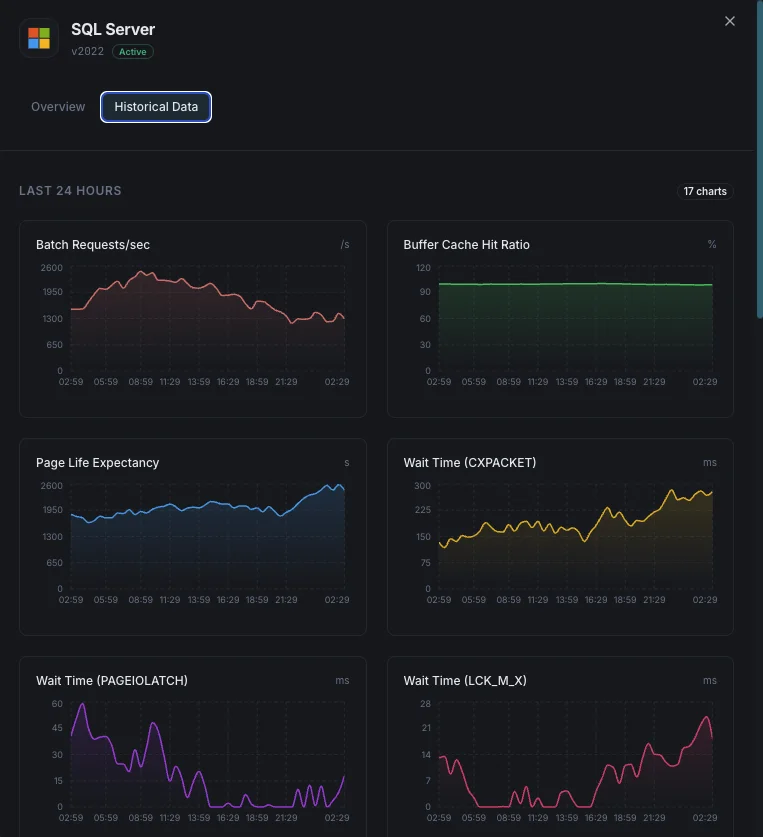
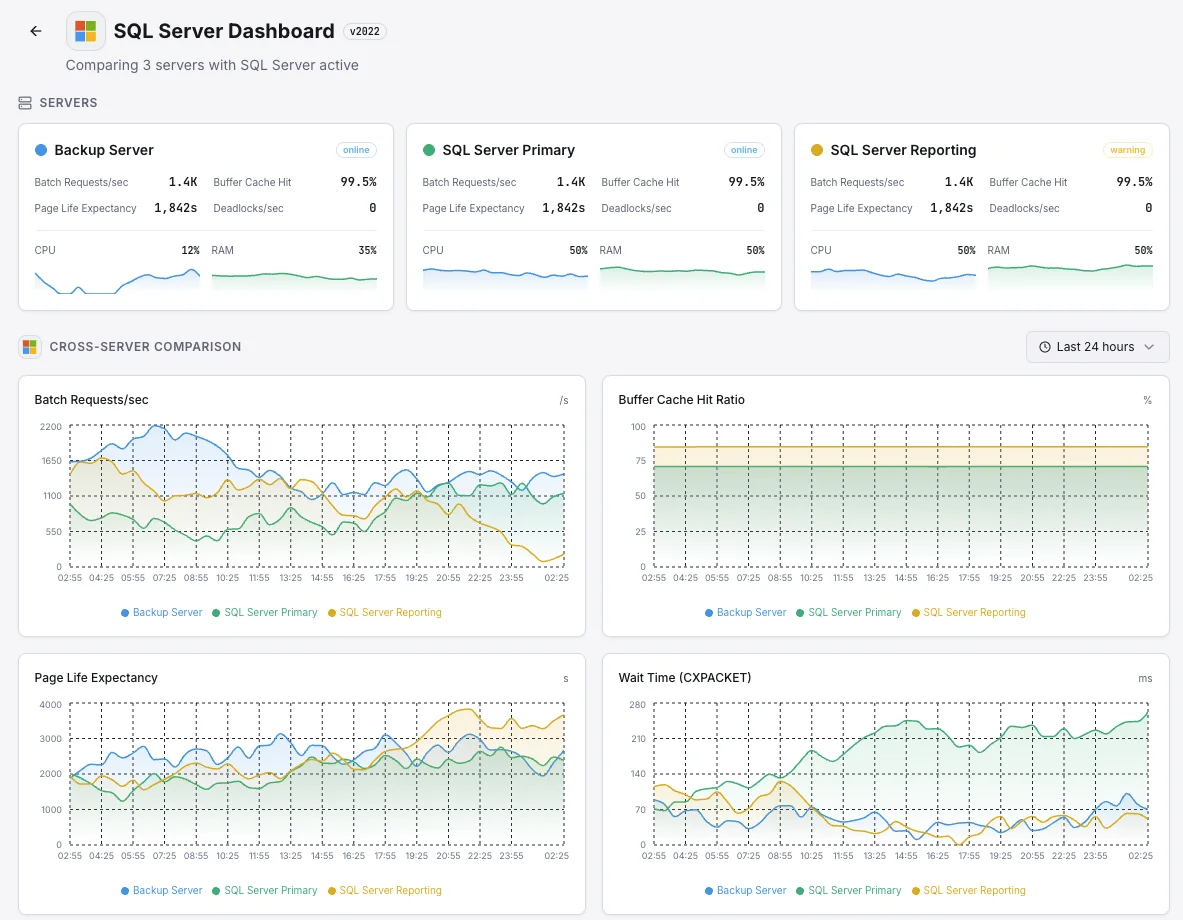
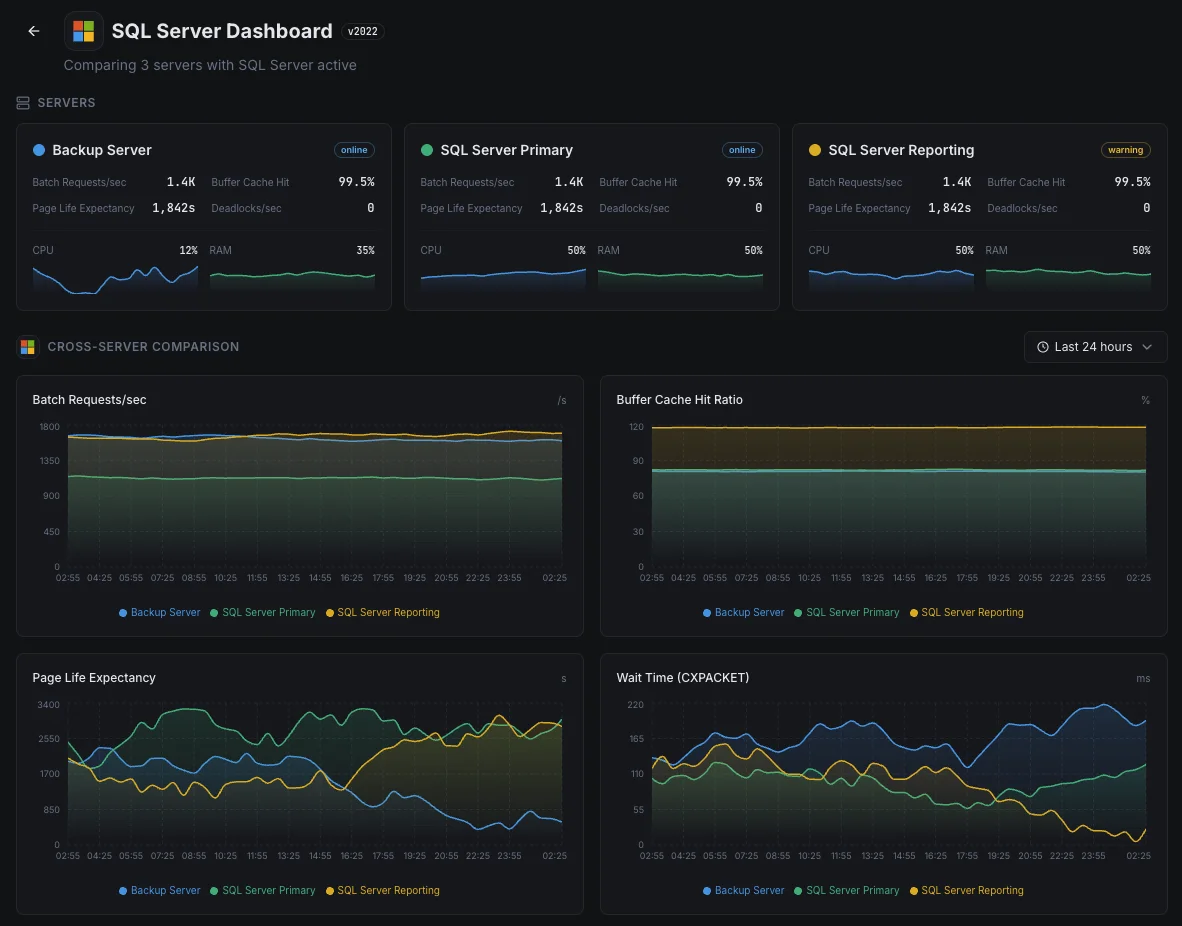
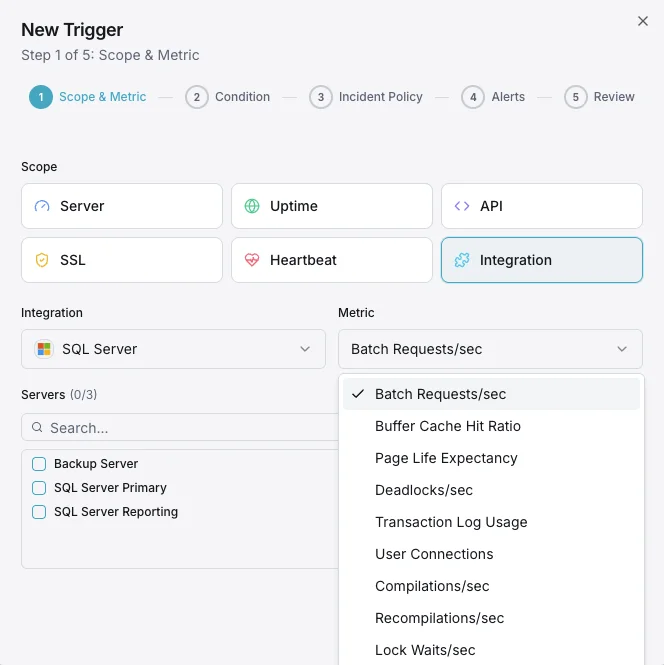
Ciò che monitoriamo
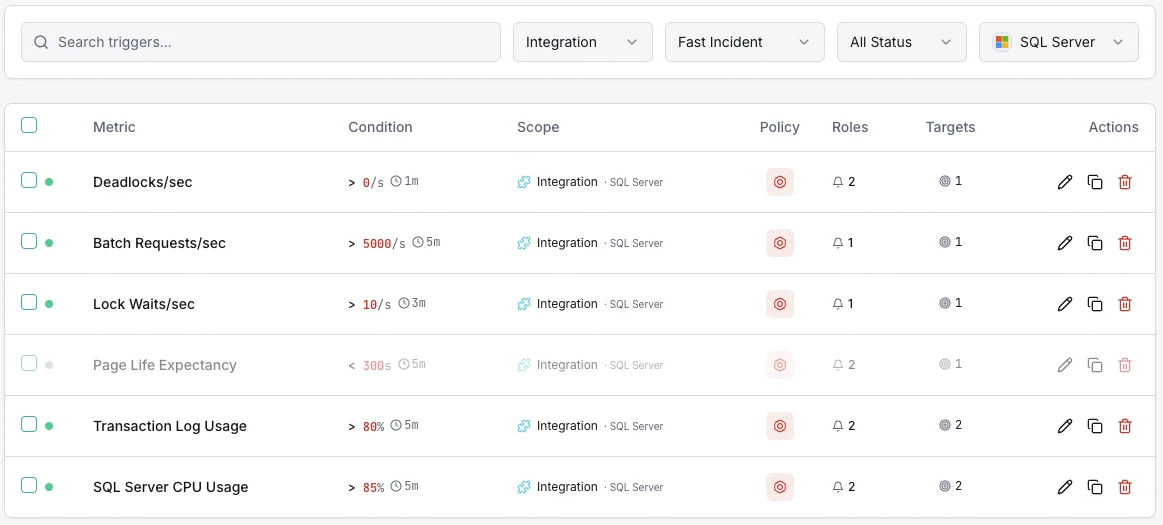
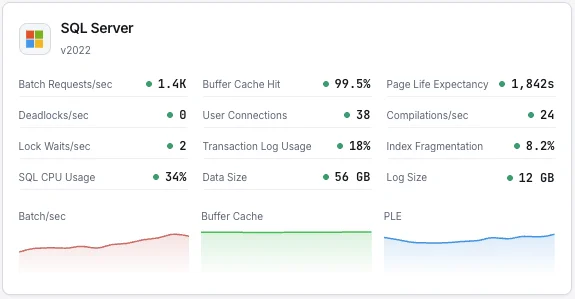
Batch Requests/sec
Numero di batch request SQL ricevute al secondo.
Rapporto di hit del buffer cache
Percentuale di letture di pagine soddisfatte dal buffer pool rispetto alle letture fisiche da disco.
Page Life Expectancy
Tempo medio (in secondi) di permanenza di una pagina nel buffer pool — valori bassi indicano pressione di memoria.
Statistiche di attesa
Tipi di wait principali e durate che indicano colli di bottiglia delle risorse.
Deadlock/sec
Numero di richieste di lock che hanno generato deadlock.
Utilizzo del transaction log
Percentuale di spazio del transaction log utilizzato per database.
Connessioni utente
Numero di connessioni utente attive all'istanza SQL Server.
Compilazioni/sec
Numero di compilazioni e ricompilazioni SQL al secondo.
Lock Waits/sec
Numero di richieste di lock che hanno richiesto attesa al chiamante.
Frammentazione degli indici
Livello di frammentazione degli indici tra database.
Utilizzo CPU
Utilizzo CPU del processo SQL Server rispetto alla CPU totale del sistema.
Dimensione del database
Dimensioni dei file di dati e log per ogni database.
Configurabile condizioni di attivazione
Imposta dei trigger personalizzati nella tua dashboard per ricevere una notifica non appena le metriche dell{name}e superano le soglie da te definite.
Rapporto di hit del buffer cache
criticoSi attiva quando il rapporto di hit della cache scende sotto la soglia, indicando memoria insufficiente per il carico di lavoro.
Page Life Expectancy
avvisoSi attiva quando il PLE scende sotto la soglia, indicando che le pagine vengono svuotate dalla memoria troppo rapidamente.
Deadlock
criticoAvvisa quando il tasso di deadlock supera la soglia, indicando contesa di lock nelle query applicative.
Utilizzo del transaction log
criticoSi attiva quando l'utilizzo del transaction log supera la soglia, rischiando fallimenti di scrittura.
Connessioni utente
avvisoSi attiva quando il numero di connessioni si avvicina ai limiti, rischiando errori connection refused.
Statistiche di attesa
avvisoAvvisa quando wait type specifici aumentano rapidamente, indicando colli di bottiglia delle risorse (CPU, I/O, memoria, lock).
Importanza del monitoraggio MSSQL
SQL Server esegue carichi di lavoro enterprise mission-critical: dai sistemi ERP e database finanziari alle piattaforme di e-commerce. Senza monitoraggio, pressione sui buffer, deadlock e bloat dei transaction log possono causare interruzioni e corruzione dei dati.
- Rileva la pressione di memoria tramite le metriche di buffer cache e PLE
- Monitora le statistiche di wait per identificare la causa radice dei rallentamenti
- Tieni traccia dei deadlock per correggere problemi di locking a livello applicativo
- Garantisci spazio nel transaction log per operazioni di scrittura ininterrotte
- Ottimizza l'utilizzo degli indici per mantenere nel tempo le prestazioni delle query
Perché scegliere Xitoring
Xitoring offre un monitoraggio SQL Server di livello enterprise con configurazione zero-config. Il nostro agente leggero rileva automaticamente le tue istanze MSSQL, inizia a raccogliere metriche in meno di 60 secondi e si integra con i tuoi canali di notifica esistenti.
- Supporto nativo per Windows Server con installer semplice
- Oltre 15 nodi di monitoraggio globali per controlli a bassa latenza
- Dashboard unificata per server, database e uptime
- Alerting flessibile tramite Slack, PagerDuty, Telegram e altri
- Conservazione dei dati storici per pianificazione della capacità e audit
Scenari comuni di monitoraggio SQL Server
Dove SQL Server viene tipicamente eseguito oggi — e cosa potrebbe andare storto se nessuno lo monitora.
App aziendali e sistemi ERP
Quando SQL Server esegue app aziendali critiche — finanza, risorse umane, vendite — un database lento si traduce in un'azienda lenta. Monitoriamo i segnali che indicano quando il database inizia a faticare in modo che il team possa risolverlo prima che il personale inizi a chiamare l'IT.
Database di backup per il ripristino di emergenza
Le aziende eseguono copie aggiuntive del loro database — spesso in un'altra regione — in modo che un singolo guasto non metta offline l'attività. Quando queste copie rimangono indietro, il ripristino perderebbe più dati del previsto. Monitoriamo ogni copia in modo che il piano di ripristino di emergenza funzioni ancora il giorno in cui ne avrai effettivamente bisogno.
SQL Server in cloud o su Linux
Sia che SQL Server venga eseguito in Azure, su Linux o in una configurazione intermedia, la visibilità ottenuta dalla sola piattaforma è raramente sufficiente. Rileviamo i rallentamenti delle query e altri problemi interni in modo che costi e prestazioni rimangano entrambi sotto il tuo controllo.
Prerequisiti per MSSQL
Assicurati di avere tutto questo in posizione — la maggior parte delle installazioni dura 60 secondi una volta soddisfatte le condizioni.
- Microsoft SQL Server 2012 o successivo (2022+ per la metrica size_on_disk_bytes)
- Un login SQL con i permessi CONNECT ANY DATABASE, VIEW SERVER STATE, VIEW ANY DEFINITION e SELECT
- TCP/IP abilitato sull'istanza, con la porta raggiungibile da Xitogent
Inizia con verbali
Installa Xitogent sul tuo server Windows
Scarica e installa l'agente Xitogent sul tuo Windows Server che ospita SQL Server.
# Download from https://xitoring.com/xitogent
# Run the installer as AdministratorConfigura l'accesso a SQL Server
Crea un login dedicato per il monitoraggio con privilegi minimi:
CREATE LOGIN xitoring WITH PASSWORD = 'your_password';
CREATE USER xitoring FOR LOGIN xitoring;
GRANT CONNECT ANY DATABASE TO xitoring;
GRANT VIEW SERVER STATE TO xitoring;
GRANT VIEW ANY DEFINITION TO xitoring;
GRANT SELECT TO xitoring;Abilita l'integrazione MSSQL
Usa la dashboard di Xitoring o la CLI per abilitare l'integrazione MSSQL.
xitogent integrateConfigura le soglie di allerta (opzionale)
Imposta soglie personalizzate per buffer cache hit ratio, page life expectancy o numero di deadlock per essere avvisato quando qualcosa richiede attenzione.
Verifica che funzioni
Esegui questo comando sul server per confermare che Xitogent ha rilevato l'integrazione. In circa 30 secondi nuove metriche cominceranno a comparire sulla tua dashboard.
sudo xitogent statusStai valutando alternative?
Scopri come Xitoring si confronta con le alternative per il monitoraggio di MSSQL — prezzi fissi, integrazioni più approfondite e un unico agente che copre l'intero stack.


Spesso domande poste
L'integrazione supporta SQL Server su Linux?
Questa integrazione influirà sulle prestazioni di SQL Server?
Posso monitorare più istanze?
Posso monitorare Azure SQL Database?
Quali versioni di SQL Server sono supportate?
Con quale frequenza vengono raccolti i dati?
Come si rilevano i deadlock in SQL Server?
Come si monitora la salute dei backup di SQL Server?
Quali versioni di SQL Server sono supportate?
Inizia a monitorare MSSQL oggi
Configurazione in meno di 60 secondi. Non è richiesta alcuna carta di credito. Statistiche complete fin dal primo giorno.
Inizia la prova gratuitaContinua a esplorare