RabbitMQ Monitoraggio
Monitora in tempo reale la profondità delle code RabbitMQ, il numero di consumer, la frequenza dei messaggi e lo stato dei nodi senza alcuna configurazione.
Perché monitorare RabbitMQ?
RabbitMQ è il broker di messaggi open source più diffuso, che consente la comunicazione asincrona tra microservizi. Il monitoraggio di RabbitMQ è fondamentale per prevenire l'accumulo di code, rilevare i guasti dei consumer, monitorare i tassi di consegna dei messaggi e garantire la stabilità del cluster. L'integrazione di RabbitMQ offerta da Xitoring garantisce una visibilità completa sulla vostra infrastruttura di messaggistica.
Il monitoraggio di RabbitMQ, spiegato
Il monitoraggio di RabbitMQ intercetta la saturazione delle code (i consumer non riescono a tenere il passo), gli alarm di memoria + disco (i publisher vengono bloccati), l'accumulo di messaggi non acked (consumer lenti), i leak di connessioni / canali, gli eventi di partizione del cluster e i problemi di elezione del leader delle quorum queue prima che causino ritardi nel processing dei messaggi, disservizi completi del broker o perdita di dati. Per code task Celery / Sidekiq, eventing microservizi, ingestione IoT MQTT e qualsiasi cluster RabbitMQ in produzione, la visibilità per coda + per nodo è ciò che separa un alert di 60 secondi su un consumer bloccato dal trovare 10M di messaggi accumulati domani. Xitoring scopre automaticamente il suo RabbitMQ, legge l'API di management + il plugin Prometheus e indirizza gli alert verso Slack, PagerDuty, Telegram o la sua on-call esistente.
Ciò che monitoriamo
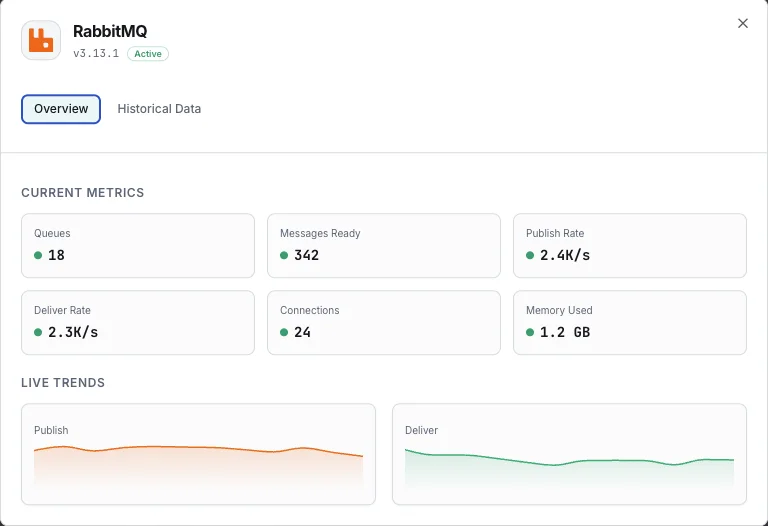
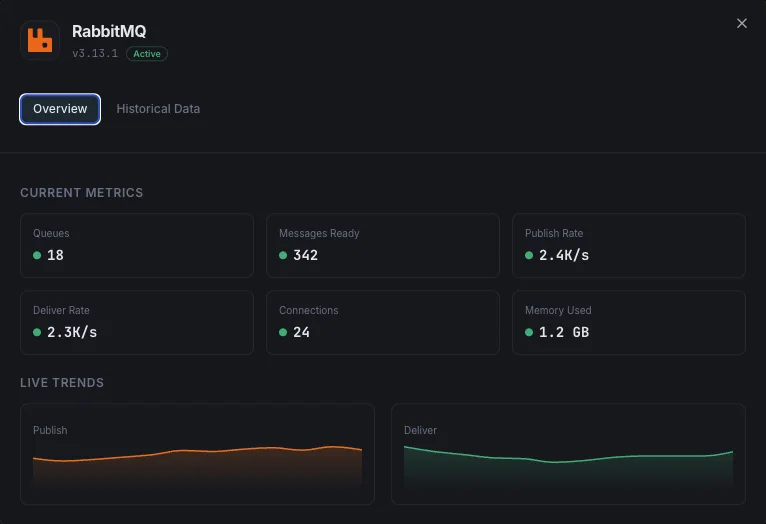
Profondità della coda
Numero di messaggi ready e unacknowledged in ogni coda.
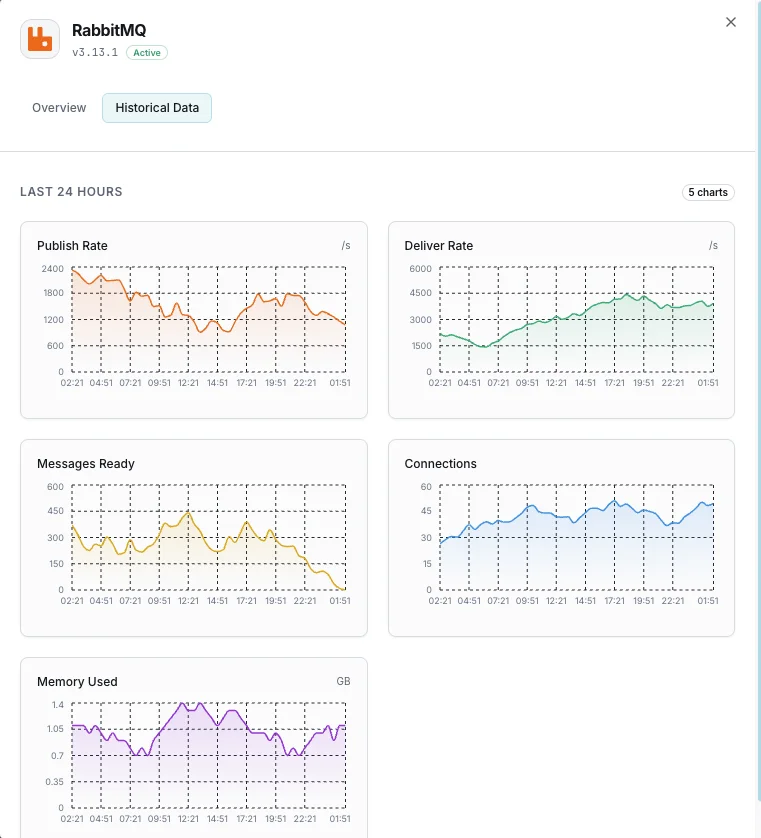
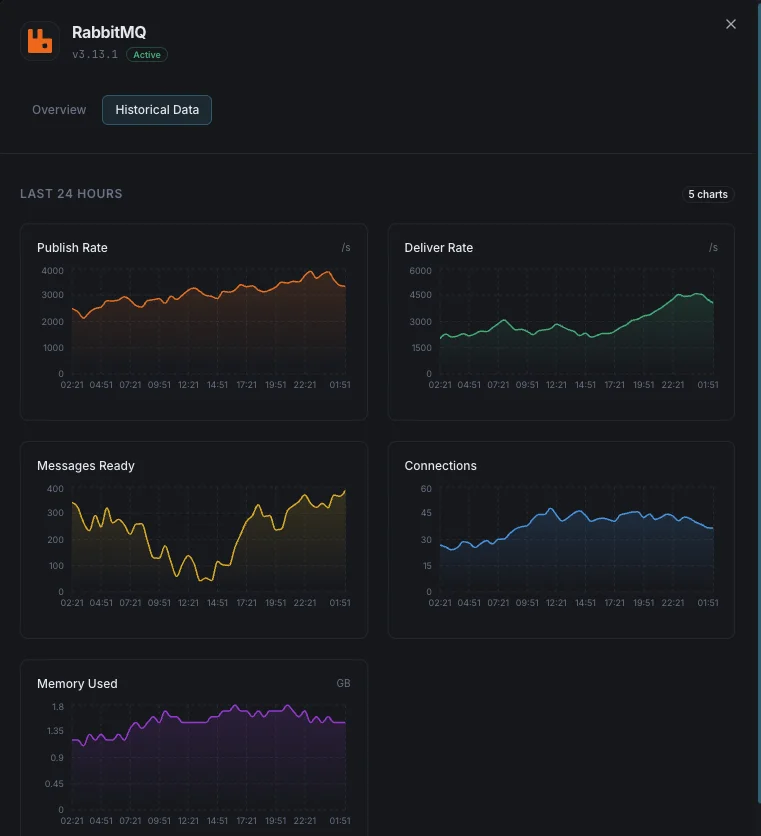
Tassi di messaggi
Tassi di publish, deliver, ack e redelivery al secondo.
Numero di consumer
Numero di consumer attivi collegati a ogni coda.
Memoria del nodo
Memoria utilizzata da ogni nodo RabbitMQ inclusi binary e queue memory.
Spazio disco libero
Spazio disco disponibile su ogni nodo rispetto alla soglia di allarme configurata.
Numero di connessioni
Totale di connessioni client e channel nel cluster.
Tassi degli exchange
Tassi di messaggi attraverso ogni exchange (publish in/out).
Messaggi non instradabili
Messaggi che non è stato possibile instradare a nessuna coda.
Descrittori di file
Descrittori di file utilizzati rispetto a disponibili su ogni nodo.
Processi Erlang
Numero di processi Erlang in esecuzione su ogni nodo.
Partizioni del cluster
Eventi di partizione di rete tra i nodi del cluster.
Messaggi dead letter
Messaggi instradati a exchange dead letter a causa di rifiuto o scadenza TTL.
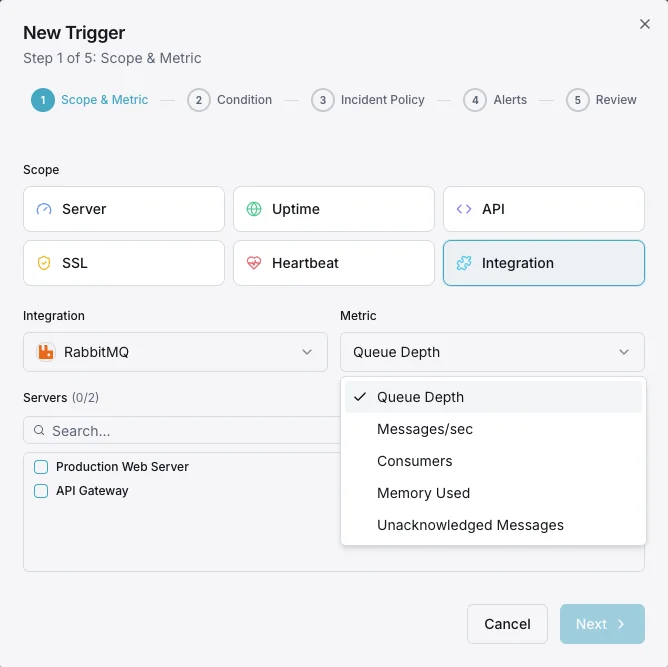
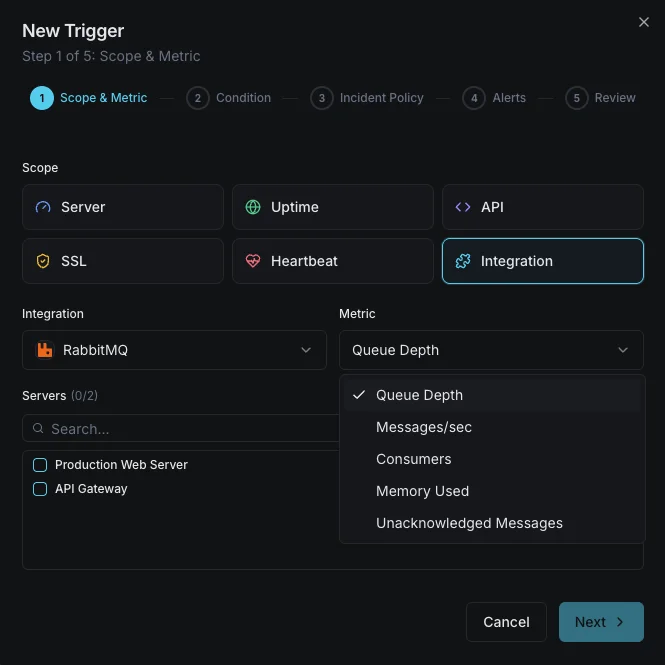
Configurabile condizioni di attivazione
Imposta dei trigger personalizzati nella tua dashboard per ricevere una notifica non appena le metriche dell{name}e superano le soglie da te definite.
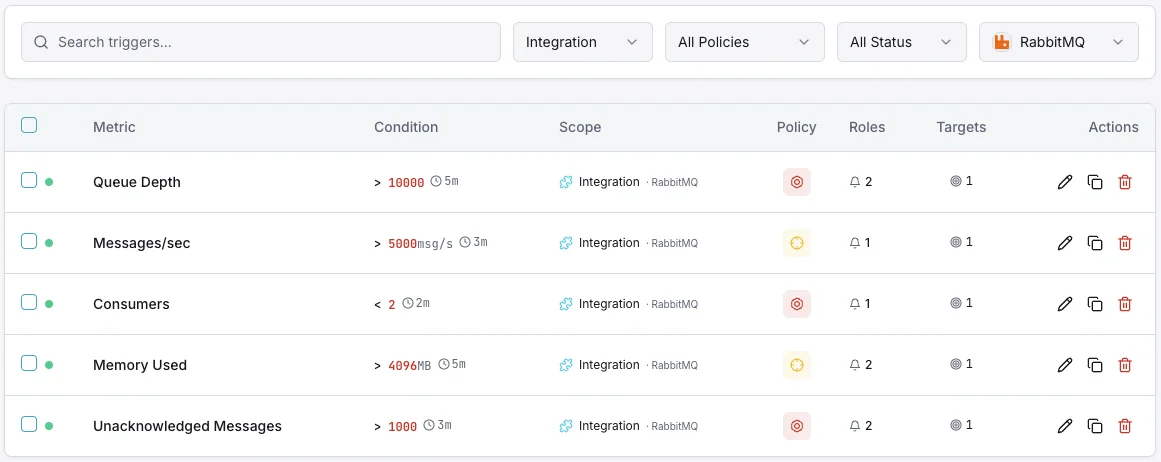
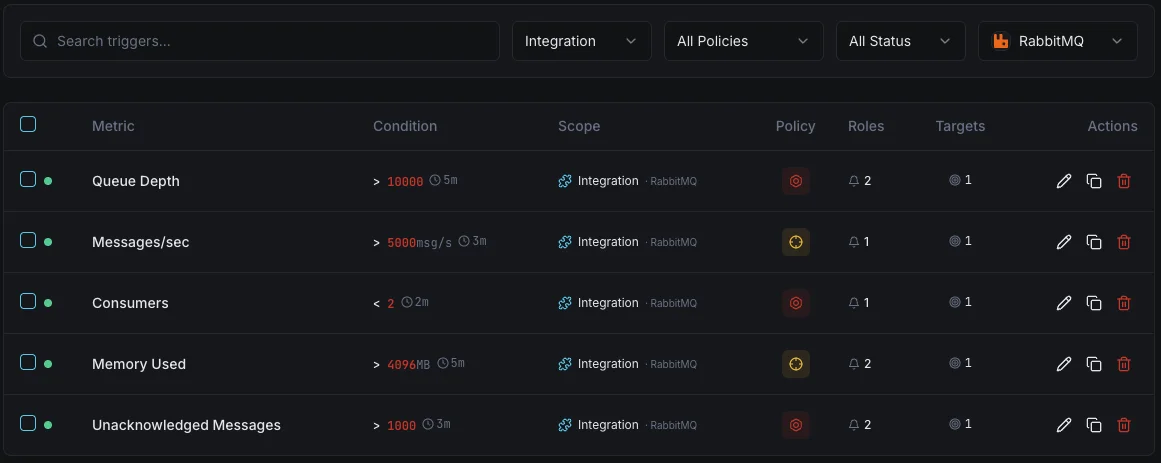
Profondità della coda
criticoSi attiva quando i messaggi si accumulano in una coda, indicando che i consumer non riescono a tenere il passo dei producer.
Numero di consumer
avvisoSi attiva quando i consumer scendono sotto la soglia, rischiando ritardi nell'elaborazione dei messaggi.
Memoria del nodo
criticoAvvisa quando la memoria dei nodi si avvicina alla high watermark, rischiando l'attivazione del flow control.
Tasso di messaggi
avvisoSi attiva quando i tassi di publish o delivery deviano in modo significativo dalla baseline.
Allarme spazio disco libero
criticoSi attiva quando lo spazio disco scende sotto la soglia configurata, bloccando tutti i publisher.
Messaggi unacknowledged
avvisoAvvisa quando i messaggi unacked aumentano, indicando consumer lenti o bloccati.
Importanza del monitoraggio RabbitMQ
RabbitMQ è la spina dorsale delle architetture event-driven: gestisce elaborazione degli ordini, notifiche, pipeline di dati e comunicazione tra servizi. Senza monitoraggio, saturazione delle code, guasti dei consumer e pressione di memoria possono trasformarsi in interruzioni complete del sistema.
- Rileva l'accumulo in coda prima che causi timeout dell'applicazione
- Monitora la salute dei consumer per garantire continuità nell'elaborazione dei messaggi
- Tieni traccia dell'utilizzo di memoria e disco per prevenire l'attivazione del flow control
- Identifica in anticipo i messaggi non instradabili e dead lettered
- Garantisci il recupero delle partizioni di cluster per l'alta disponibilità
Perché scegliere Xitoring
Xitoring offre un monitoraggio RabbitMQ di livello enterprise con configurazione zero-config. Il nostro agente leggero rileva automaticamente i tuoi nodi RabbitMQ, inizia a raccogliere metriche in meno di 60 secondi e si integra con i tuoi canali di notifica esistenti.
- Installazione con un solo comando — niente YAML o file di configurazione complessi
- Oltre 15 nodi di monitoraggio globali per controlli a bassa latenza
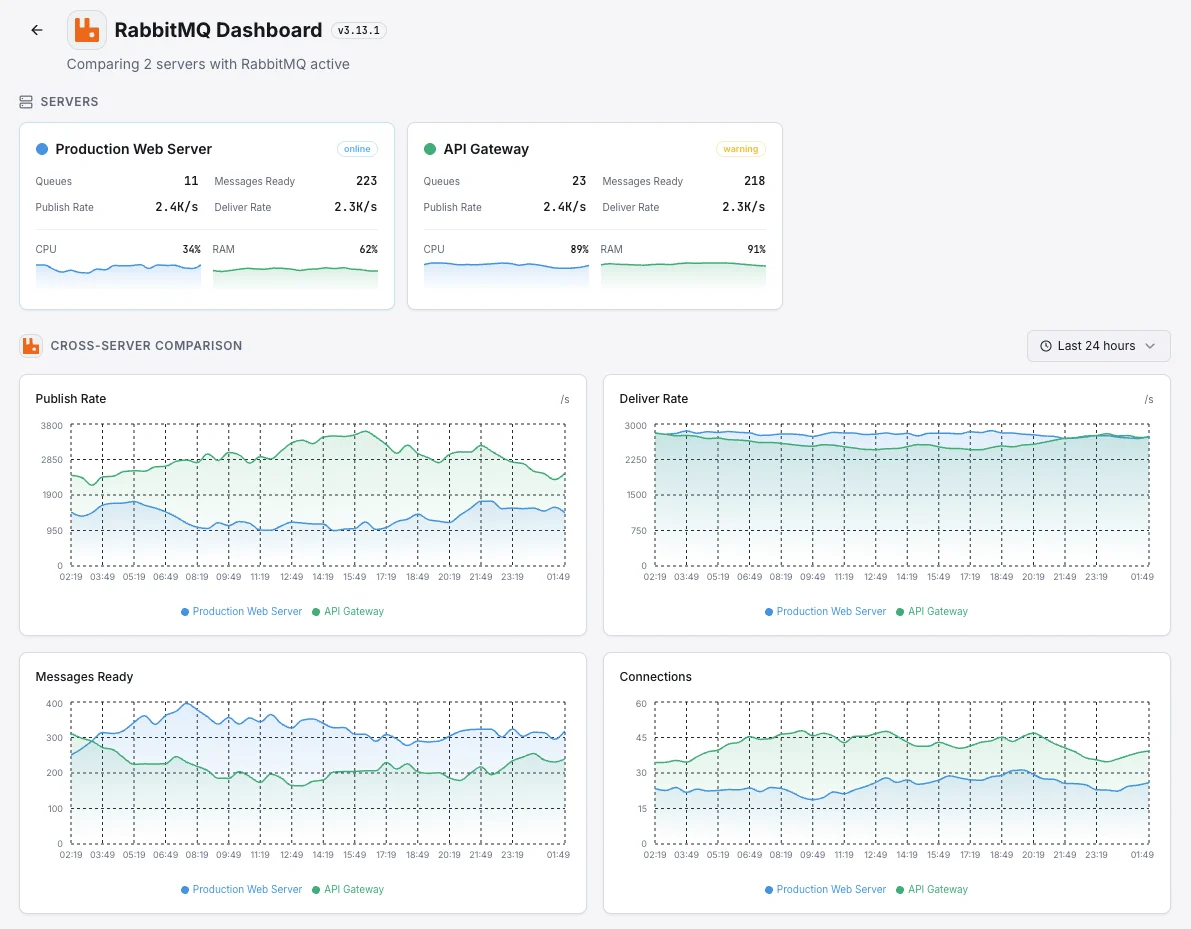
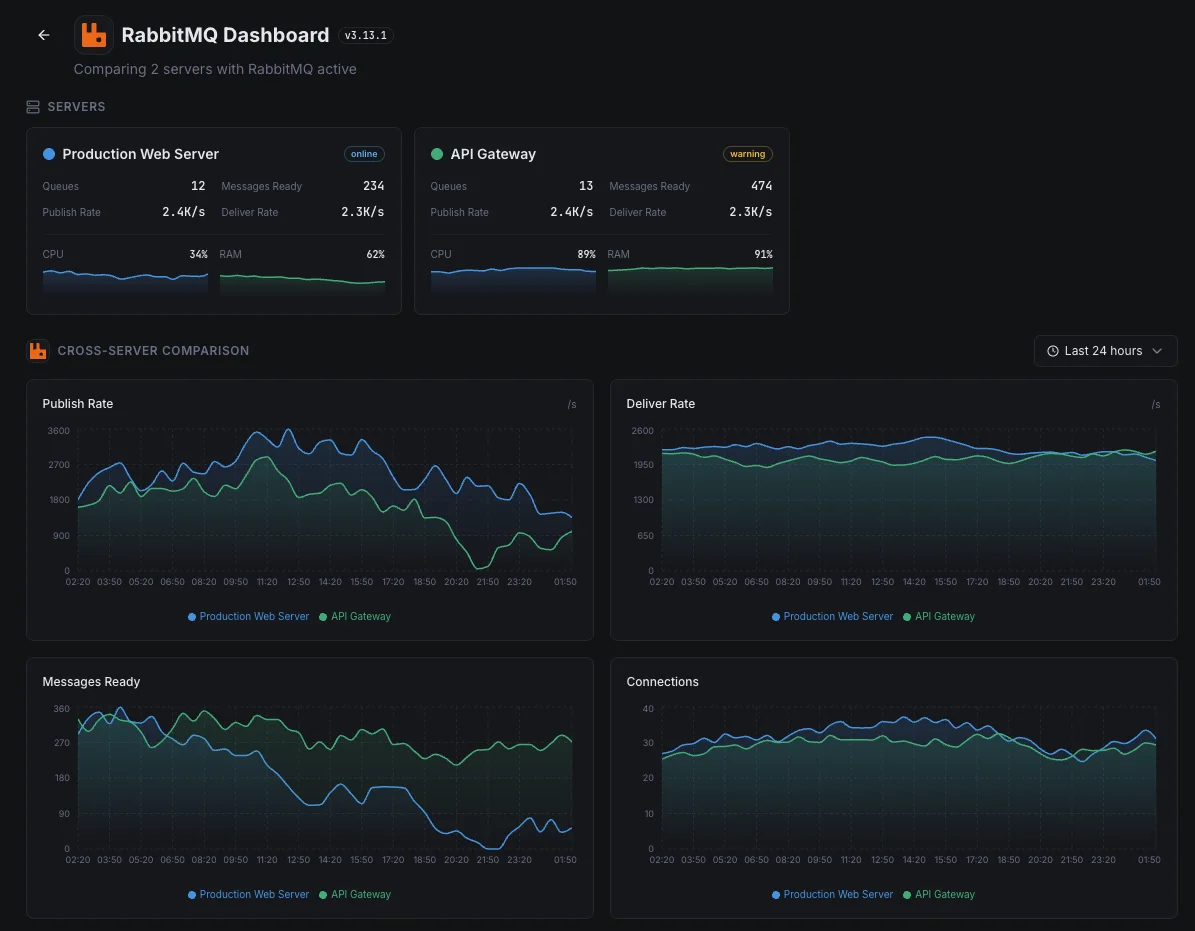
- Dashboard unificata per server, message broker e uptime
- Alerting flessibile tramite Slack, PagerDuty, Telegram e altri
- Conservazione dei dati storici per pianificazione della capacità e audit
Scenari comuni di monitoraggio RabbitMQ
Dove RabbitMQ è tipicamente in esecuzione oggi e cosa potrebbe andare storto se nessuno sta monitorando.
Lavori in background in un'app web
Le app web spingono il lavoro lento — invio di email, generazione di PDF, elaborazione di pagamenti — a una coda in background in modo che il sito rimanga veloce. Quando quella coda si accumula silenziosamente, quelle attività vengono ritardate per ogni utente. Rileviamo l'accumulo precocemente in modo che il team possa risolverlo prima che i clienti se ne accorgano.
La dorsale di messaggistica che collega le tue app
Quando i messaggi passano tra le app per mantenere i dati sincronizzati, qualsiasi rallentamento significa che un'app sta silenziosamente rimanendo indietro. Rileviamo il ritardo nel momento in cui inizia in modo che non si trasformi silenziosamente in un problema visibile al cliente.
Raccolta dati da dispositivi IoT
Dispositivi e sensori intelligenti inviano flussi costanti di dati a un server centrale. Quando quella pipeline si blocca, i dati vengono silenziosamente persi o ritardati. Monitoriamo il flusso in modo che ogni lettura del dispositivo sia contabilizzata.
Prerequisiti per RabbitMQ
Assicurati di avere tutto questo in posizione — la maggior parte delle installazioni dura 60 secondi una volta soddisfatte le condizioni.
- RabbitMQ 3.x in esecuzione con il plugin management abilitato (porta 15672)
- Un utente con il tag monitoring
- Raggiungibilità di rete da Xitogent verso l'API di management
Inizia con verbali
Installa Xitogent sul tuo server
Se non l'hai già fatto, installa il leggero agente di monitoraggio Xitogent sul tuo server.
curl -s https://xitoring.com/install.sh | sudo bash -s -- --key=YOUR_API_KEYAbilita il plugin di management di RabbitMQ
Xitogent raccoglie metriche tramite l'API di management di RabbitMQ. Abilita il plugin se non è già attivo:
rabbitmq-plugins enable rabbitmq_managementAbilita l'integrazione RabbitMQ
Usa la dashboard di Xitoring o la CLI per abilitare l'integrazione RabbitMQ. Xitogent rileverà automaticamente la tua istanza.
sudo xitogent integrateConfigura le soglie di allerta (opzionale)
Imposta soglie personalizzate per profondità della coda, numero di consumer o uso della memoria per essere avvisato quando qualcosa richiede attenzione.
Verifica che funzioni
Esegui questo comando sul server per confermare che Xitogent ha rilevato l'integrazione. In circa 30 secondi nuove metriche cominceranno a comparire sulla tua dashboard.
sudo xitogent statusStai valutando alternative?
Scopri come Xitoring si confronta con le alternative per il monitoraggio di RabbitMQ — prezzi fissi, integrazioni più approfondite e un unico agente che copre l'intero stack.


Spesso domande poste
L'integrazione richiede il plugin di gestione?
Questa integrazione influirà sulle prestazioni di RabbitMQ?
Posso monitorare i cluster RabbitMQ?
Posso monitorare le singole code?
Quali versioni di RabbitMQ sono supportate?
Con quale frequenza vengono raccolti i dati?
Cosa mostra la UI rabbitmq_management?
RabbitMQ vs Kafka nel monitoraggio — cosa cambia?
Quali versioni di RabbitMQ sono supportate?
Inizia a monitorare RabbitMQ oggi
Configurazione in meno di 60 secondi. Non è richiesta alcuna carta di credito. Statistiche complete fin dal primo giorno.
Inizia la prova gratuitaContinua a esplorare