Elasticsearch Suivi
Surveillez en temps réel l'état de santé du cluster Elasticsearch, les taux d'indexation, l'utilisation du tas JVM et la latence des recherches, sans aucune configuration.
Pourquoi surveiller ? Elasticsearch?
Elasticsearch assure les fonctions de recherche, de journalisation et d'analyse pour des milliers d'organisations à travers le monde. La surveillance d'Elasticsearch est essentielle pour maintenir la santé du cluster, optimiser le débit d'indexation, suivre la latence des recherches et éviter l'épuisement du tas de la JVM. L'intégration d'Elasticsearch par Xitoring offre une visibilité approfondie sur tous les aspects de votre cluster.
Le monitoring Elasticsearch, expliqué
Le monitoring Elasticsearch détecte la dégradation du cluster (statut yellow / red), les shards non assignés, la pression sur le heap JVM, les pics de pauses GC et les rejets de thread pools avant qu'ils ne provoquent des pannes de recherche, des échecs d'ingestion ou des pertes de données. Pour les pipelines de logs ELK, les charges de recherche vectorielle et tout cluster de production, la visibilité par nœud est ce qui sépare une auto-récupération de 30 secondes d'une panne à l'échelle du cluster. Xitoring découvre automatiquement votre Elasticsearch, interroge les API natives avec un utilisateur cluster:monitor et achemine les alertes vers Slack, PagerDuty, Telegram ou votre astreinte existante.
Ce que nous surveillons
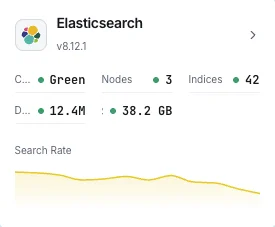
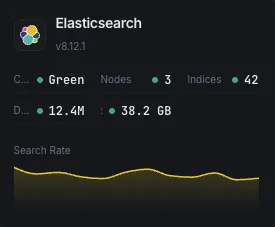
Santé du cluster
Statut global du cluster (vert/jaune/rouge) et nombre de shards actifs.
Utilisation du heap JVM
Heap utilisé, alloué et maximum sur tous les nœuds avec statistiques GC.
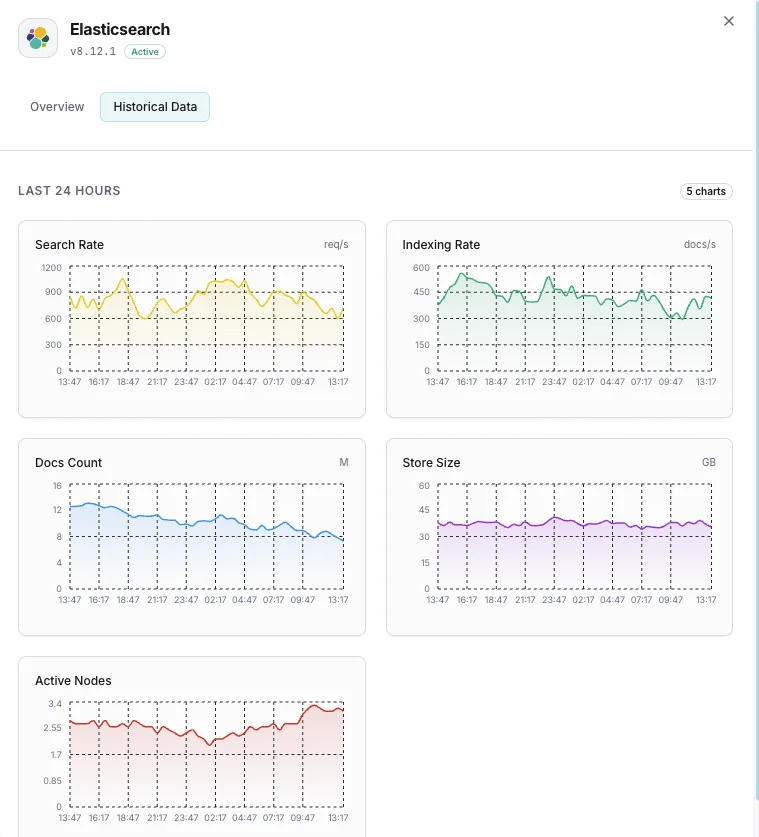
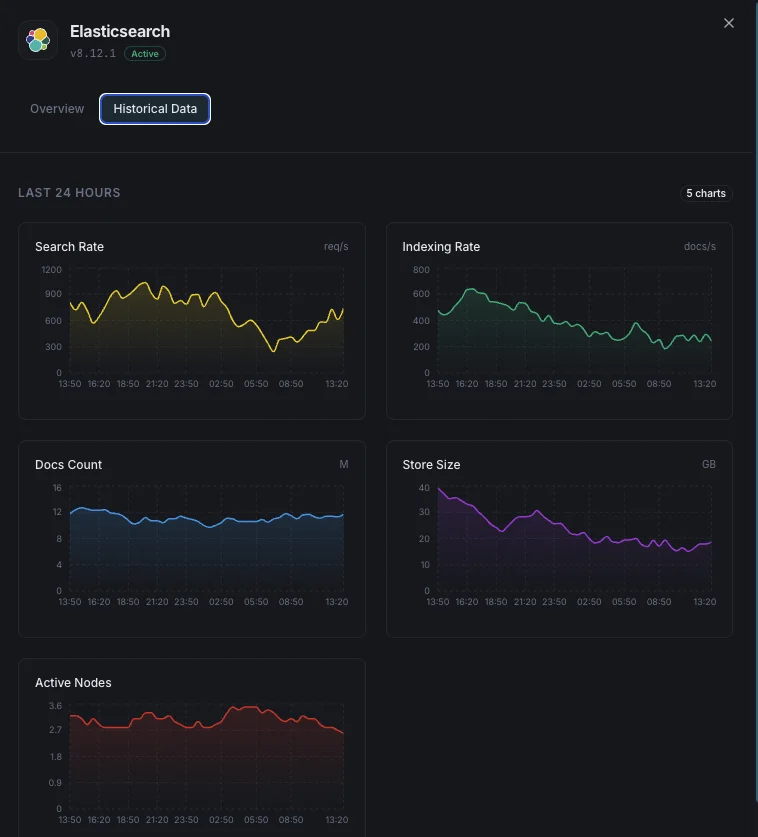
Taux d'indexation
Documents indexés par seconde dans le cluster.
Taux de recherche
Requêtes de recherche par seconde et latence moyenne de recherche.
Nombre de shards
Shards actifs, en relocalisation, en initialisation et non assignés.
Tâches en attente
Tâches en attente au niveau du cluster qui peuvent indiquer des goulets d'étranglement.
Utilisation CPU
Utilisation CPU par nœud et moyennes de charge au niveau OS.
Utilisation disque
Stockage utilisé par nœud et espace disque disponible.
Pool de threads
Tâches actives, en file d'attente et rejetées dans chaque pool de threads.
Circuit breakers
Estimations mémoire et nombres de déclenchements pour les breakers request/fielddata/in-flight.
Nombre de segments
Nombre de segments Lucene et activité de fusion.
Cache fielddata
Taille du cache fielddata et nombre d'évictions.
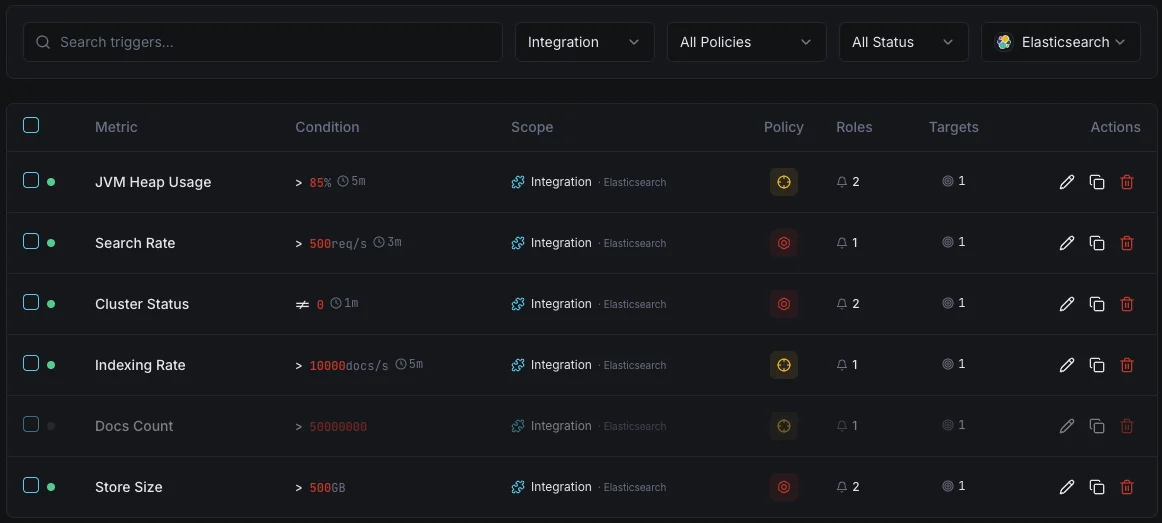
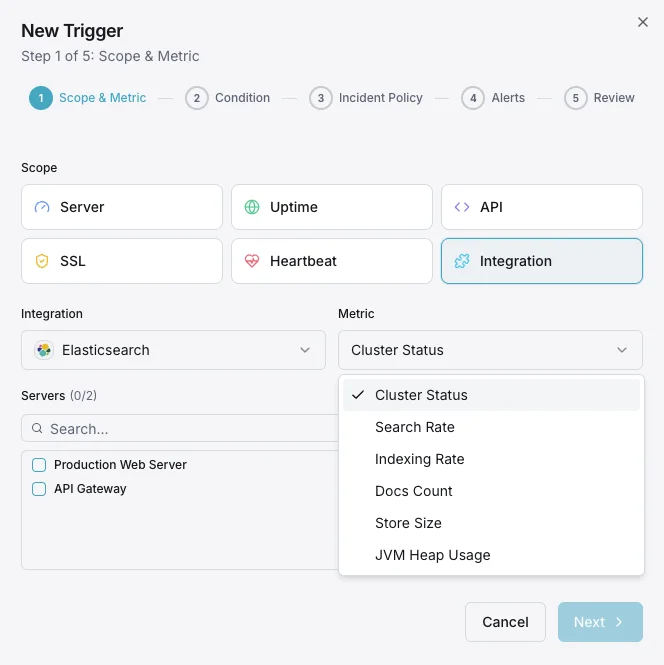
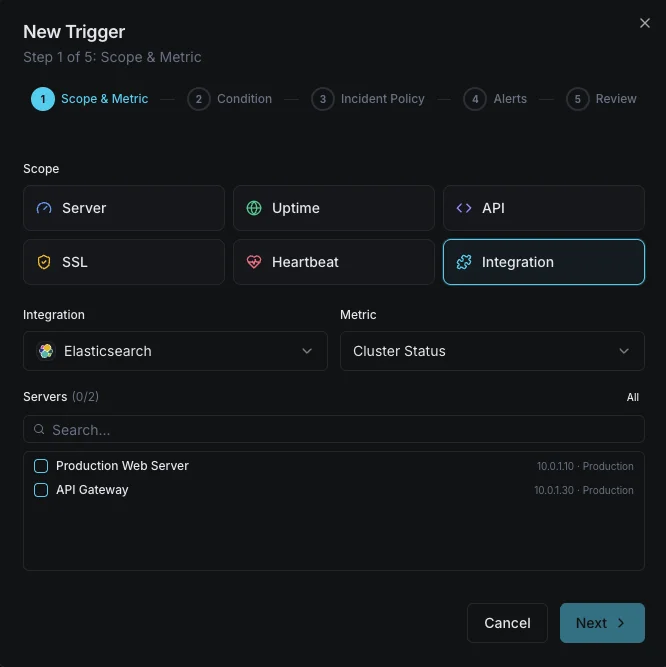
Configurables déclencheurs d'alerte
Configurez des déclencheurs personnalisés dans votre tableau de bord pour être averti dès que les indicateurs d{name}s dépassent les seuils que vous avez définis.
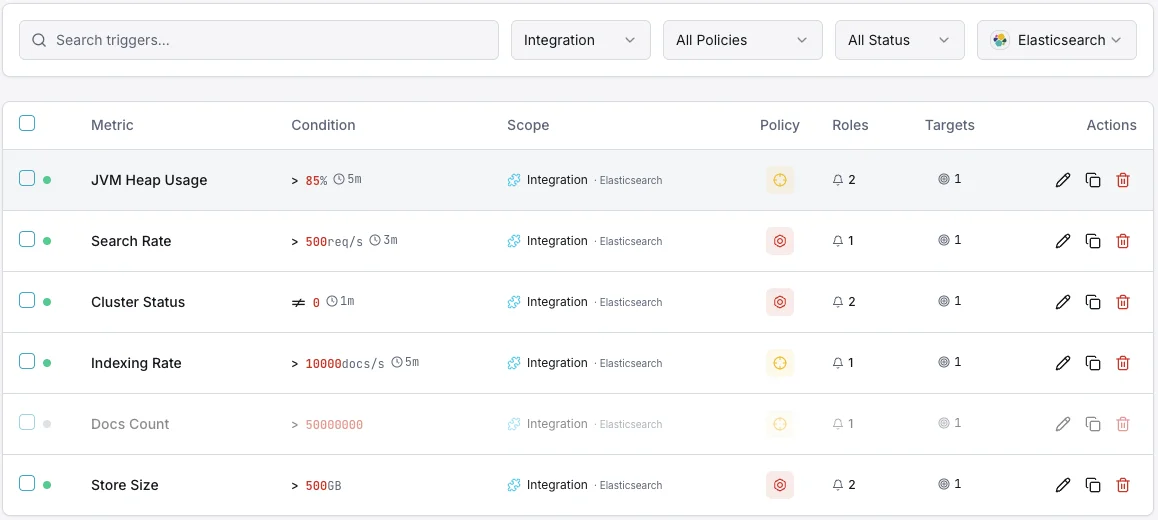
Santé du cluster
crucialSe déclenche lorsque le statut du cluster passe au jaune ou au rouge, indiquant des problèmes d'allocation des shards.
Utilisation du heap JVM
crucialSe déclenche lorsque l'utilisation du heap JVM dépasse le seuil, risquant des erreurs out-of-memory et l'instabilité des nœuds.
Taux d'indexation
avertissementAlerte lorsque le débit d'indexation tombe sous la baseline, indiquant des problèmes de pipeline d'ingestion.
Latence de recherche
avertissementSe déclenche lorsque la latence moyenne de recherche dépasse le seuil, dégradant la qualité des recherches utilisateur.
Shards non assignés
crucialSe déclenche lorsque des shards restent non assignés, laissant des données sous-répliquées et à risque.
Rejets du pool de threads
avertissementAlerte lorsque les files du pool de threads débordent et commencent à rejeter les requêtes.
Importance de la surveillance Elasticsearch
Elasticsearch sous-tend la fonctionnalité de recherche, l'agrégation de logs et l'analytique en temps réel. Sans surveillance, la dégradation du cluster, la pression JVM et les shards non assignés peuvent se transformer en pannes de recherche et en pertes de données.
- Détectez la dégradation de la santé du cluster avant qu'elle n'impacte la disponibilité de la recherche
- Surveillez le heap JVM pour éviter les crashs out-of-memory
- Suivez le débit d'indexation pour garantir des pipelines d'ingestion sains
- Identifiez les shards non assignés qui laissent les données sous-répliquées
- Optimisez la latence de recherche pour les applications utilisateur
Pourquoi choisir Xitoring
Xitoring offre une surveillance Elasticsearch de qualité entreprise avec une configuration zéro-config. Notre agent léger détecte automatiquement vos nœuds Elasticsearch, commence à collecter des métriques en moins de 60 secondes et s'intègre à vos canaux de notification existants.
- Installation en une commande — pas de YAML complexe ni de fichiers de configuration
- 15+ nœuds de surveillance mondiaux pour des contrôles à faible latence
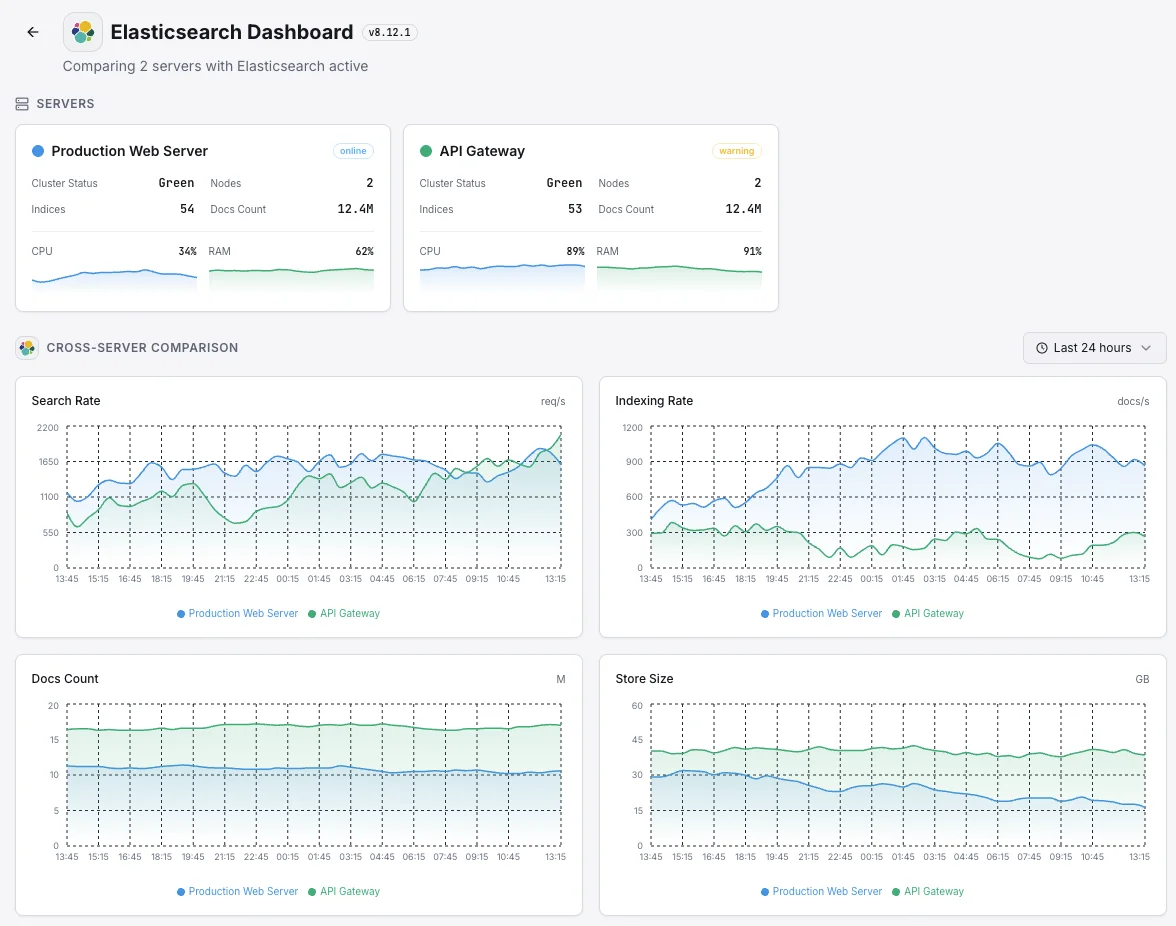
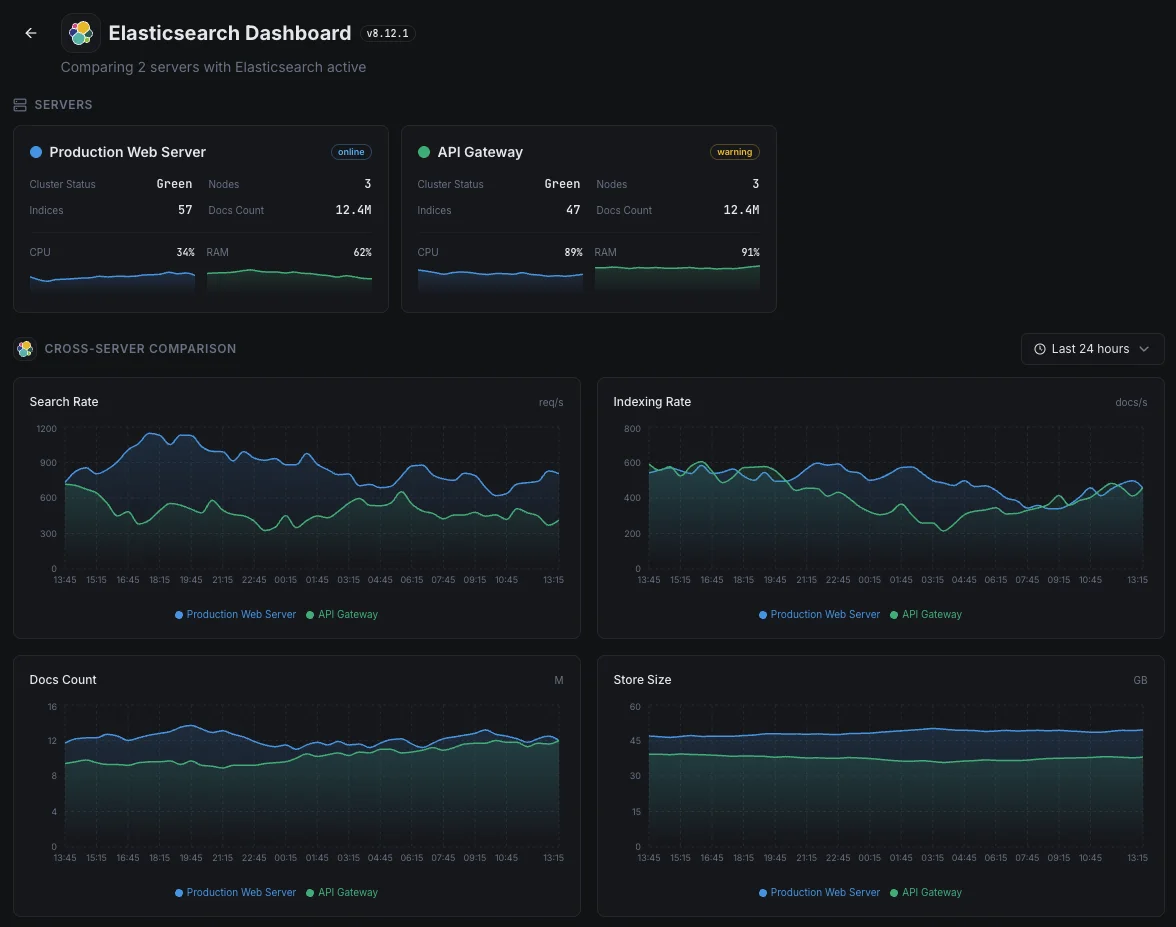
- Tableau de bord unifié pour serveurs, clusters de recherche et uptime
- Alerting flexible via Slack, PagerDuty, Telegram et plus
- Conservation de l'historique pour la planification de capacité et les audits
Scénarios courants de monitoring Elasticsearch
Où Elasticsearch fonctionne généralement aujourd'hui — et ce qui pourrait mal tourner si personne ne surveille.
Journaux et données d'observabilité
Lorsque les applications et les serveurs transmettent leurs journaux à Elasticsearch, tout arriéré ou rejet signifie qu'il manque des parties de l'image — exactement au moment où un incident les rend le plus nécessaires. Nous détectons le goulot d'étranglement tant qu'il est petit, afin que l'historique de diagnostic de l'équipe reste complet.
Recherche pour les sites web, les applications et les fonctionnalités d'IA
Lorsque la recherche alimente un site web, une application ou une fonctionnalité d'IA, une requête lente nuit directement à l'expérience utilisateur et aux conversions. Nous surveillons les temps de réponse et la capacité afin qu'un ralentissement de la recherche puisse être corrigé avant qu'il ne devienne un problème de revenus ou de produit.
Recherche gérée sur AWS ou un autre cloud
Les fournisseurs de cloud gèrent le service pour vous, mais ils ne vous disent pas quand votre propre charge de travail le submerge ou quand vos requêtes commencent à ralentir. Nous comblons ce manque de visibilité afin que le coût et les performances restent sous votre contrôle.
Prérequis pour Elasticsearch
Assurez-vous d'avoir tout cela en place — la plupart des installations sont une affaire de 60 secondes une fois ces conditions réunies.
- Elasticsearch 7.x ou 8.x accessible sur son port REST (par défaut 9200)
- Un utilisateur de monitoring avec les privilèges cluster:monitor si la sécurité est activée
- Configuration TLS/CA disponible pour Xitogent si HTTPS est requis
Commencez par procès-verbal
Installer Xitogent sur votre serveur
Si ce n'est pas déjà fait, installez l'agent de monitoring léger Xitogent sur votre serveur.
curl -s https://xitoring.com/install.sh | sudo bash -s -- --key=YOUR_API_KEYVérifier l'accessibilité de l'API Elasticsearch
Xitogent utilise l'API REST d'Elasticsearch pour collecter les métriques. Vérifiez que le cluster est accessible :
curl -s http://localhost:9200/_cluster/health | python3 -m json.toolActiver l'intégration Elasticsearch
Utilisez le tableau de bord Xitoring ou la CLI pour activer l'intégration Elasticsearch.
sudo xitogent integrateConfigurer les seuils d'alerte (facultatif)
Définissez des seuils personnalisés pour la santé du cluster, le tas JVM ou le taux d'indexation afin d'être notifié dès que quelque chose mérite votre attention.
Vérifier que tout fonctionne
Exécutez cette commande sur le serveur pour confirmer que Xitogent a bien détecté l'intégration. De nouvelles métriques apparaîtront sur votre tableau de bord dans environ 30 secondes.
sudo xitogent statusVous envisagez des alternatives ?
Découvrez comment Xitoring se positionne face aux alternatives pour la surveillance de Elasticsearch — tarifs forfaitaires, intégrations plus poussées et un seul agent pour couvrir tout votre stack.


Souvent a posé des questions
Cette intégration nécessite-t-elle une authentification ?
Cette intégration aura-t-elle un impact sur les performances d'Elasticsearch ?
Puis-je surveiller des clusters à plusieurs nœuds ?
Puis-je surveiller OpenSearch ?
Quelles sont les versions d'Elasticsearch prises en charge ?
À quelle fréquence les indicateurs sont-ils collectés ?
Qu'est-ce qu'un thread pool search et comment surveiller les rejets ?
Monitoring Elasticsearch vs OpenSearch — qu'est-ce qui diffère ?
Quelles versions d'Elasticsearch sont prises en charge ?
Commencer à surveiller Elasticsearch aujourd'hui
Configuration en moins de 60 secondes. Aucune carte bancaire requise. Statistiques complètes dès le premier jour.
Commencer l'essai gratuitContinuez à explorer