Elasticsearch 監視
設定不要で、Elasticsearch クラスタの健全性、インデックス作成レート、JVM ヒープ使用量、検索レイテンシをリアルタイムで監視できます。
なぜ監視するのか Elasticsearch?
Elasticsearchは、世界中の何千もの組織において、検索、ロギング、分析機能を支えています。Elasticsearchの監視は、クラスタの状態を維持し、インデックス作成のスループットを最適化し、検索のレイテンシを追跡し、JVMヒープの枯渇を防ぐために不可欠です。XitoringのElasticsearch統合機能により、クラスタのあらゆる側面を詳細に把握することができます。
Elasticsearch 監視を 解説
Elasticsearch 監視は、クラスターの劣化(イエロー / レッドステータス)、未割り当てシャード、JVM ヒープ圧迫、GC ポーズの急増、スレッドプール拒否を、検索障害、取り込み失敗、データ損失を引き起こす前に検出します。ELK ログパイプライン、ベクター検索ワークロード、本番クラスターでは、ノードごとの可視性が 30 秒の自動回復とクラスター全体の障害を分けます。Xitoring は Elasticsearch を自動検出し、cluster:monitor ユーザーでネイティブ API をクエリし、Slack、PagerDuty、Telegram、既存のオンコールへアラートを配信します。
私たちが 監視するもの
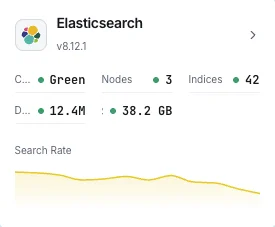
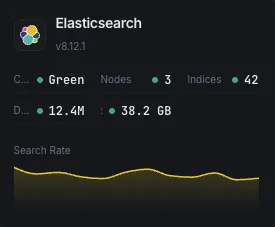
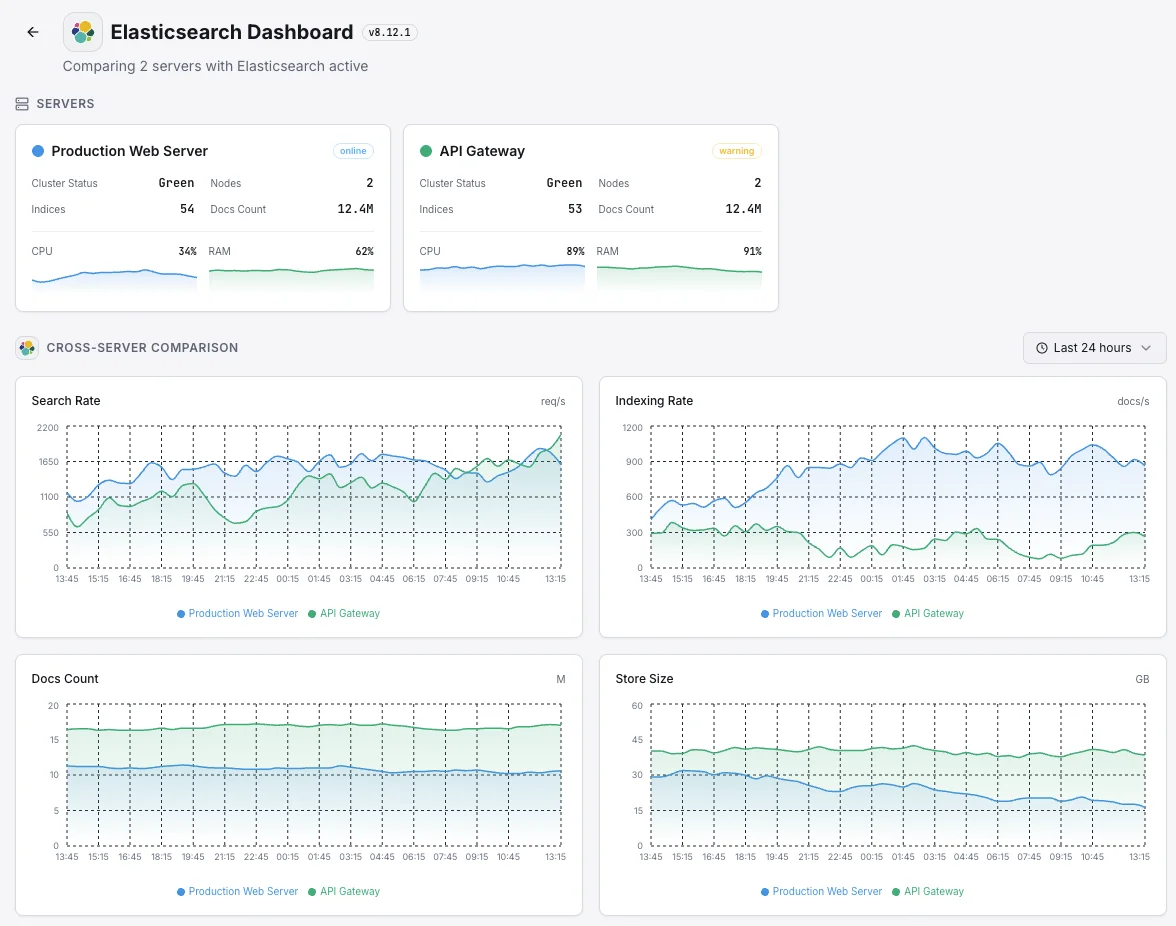
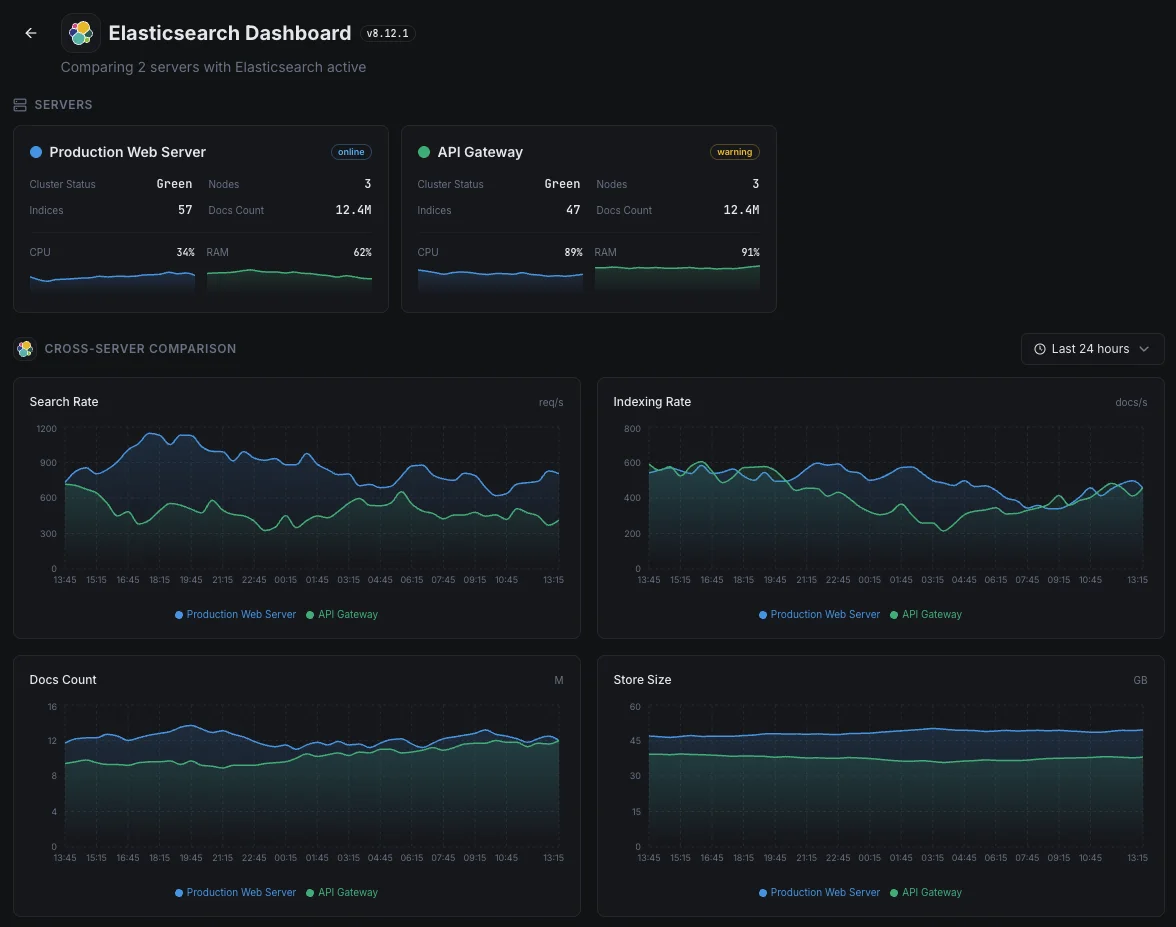
クラスタヘルス
クラスタ全体のステータス(緑/黄/赤)とアクティブなシャード数。
JVMヒープ使用量
全ノードでの使用済み、コミット済み、最大ヒープとGC統計。
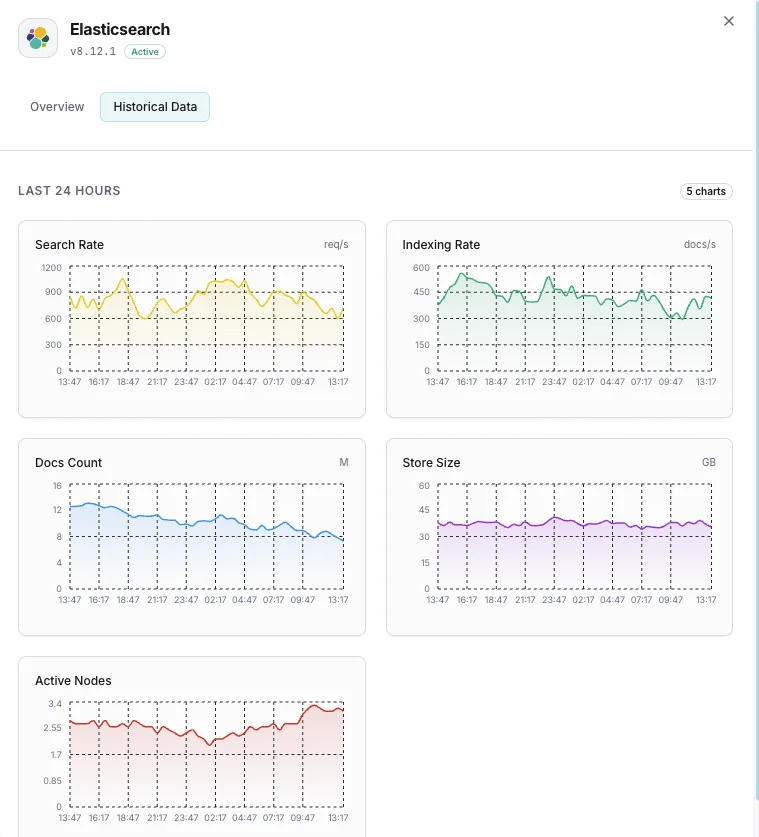
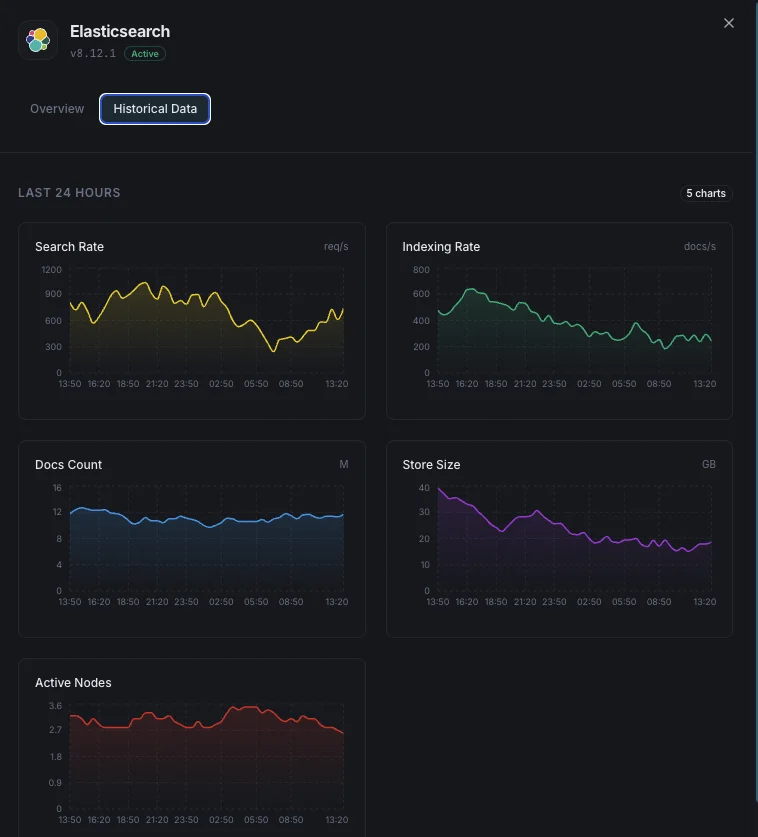
インデックス作成レート
クラスタ全体で1秒あたりにインデックスされたドキュメント数。
検索レート
1秒あたりの検索クエリ数と平均検索レイテンシ。
シャード数
アクティブ、再配置中、初期化中、未割り当てのシャード。
保留中タスク
ボトルネックを示す可能性があるクラスタレベルの保留中タスク。
CPU使用率
ノードごとのCPU使用率とOSレベルのロードアベレージ。
ディスク使用量
ノードごとのストレージ使用量と利用可能なディスク容量。
スレッドプール
各スレッドプールのアクティブ、キュー内、拒否されたタスク。
サーキットブレーカー
request/fielddata/in-flightブレーカーのメモリ推定値とトリップ数。
セグメント数
Luceneセグメント数とマージアクティビティ。
Fielddataキャッシュ
Fielddataキャッシュサイズとエビクション数。
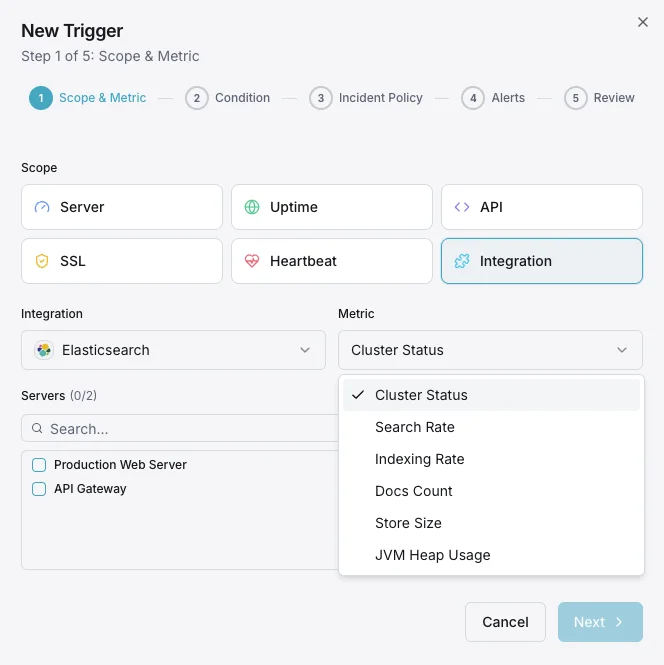
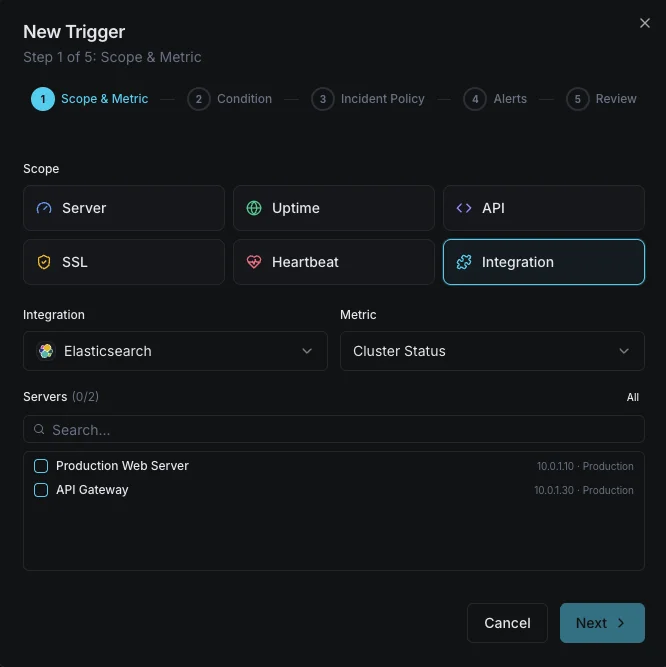
設定可能 アラートのトリガー
ダッシュボードでカスタムトリガーを設定し、Elasticsearchのメトリクスが定義した閾値を超えた瞬間に通知を受け取れるようにします。
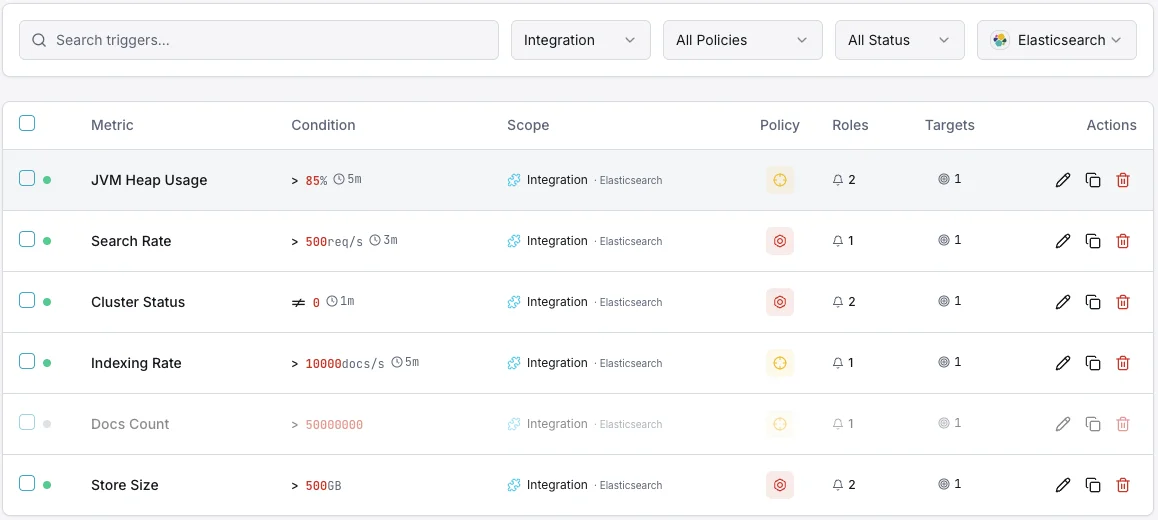
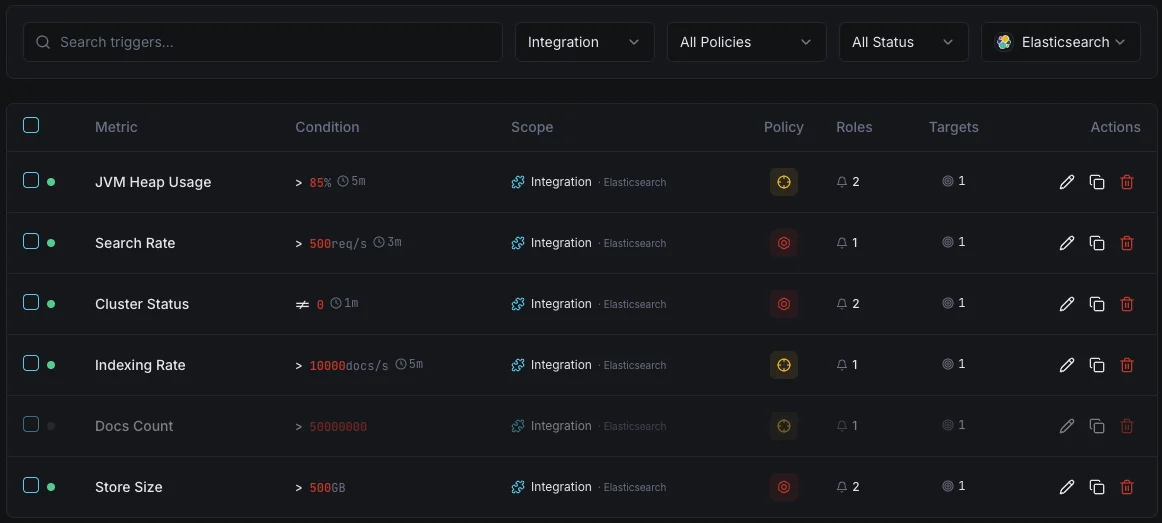
クラスタヘルス
重要なクラスタステータスが黄または赤に低下したときに発動。シャード割り当ての問題を示します。
JVMヒープ使用量
重要なJVMヒープ使用量が閾値を超えたときに発動。out-of-memoryエラーやノード不安定化のリスク。
インデックス作成レート
警告インデックススループットがベースラインを下回ったときにアラート。取り込みパイプラインの問題を示します。
検索レイテンシ
警告平均検索レイテンシが閾値を超えたときに発動。ユーザー向け検索品質を低下させます。
未割り当てシャード
重要なシャードが未割り当てのままになったときに発動。データのレプリケーション不足とリスクを示します。
スレッドプール拒否
警告スレッドプールキューがあふれてリクエストを拒否し始めたときにアラート。
の重要性: Elasticsearch監視
Elasticsearchは検索機能、ログ集約、リアルタイム分析を支えます。監視がなければ、クラスタの劣化、JVMプレッシャー、未割り当てシャードが検索障害やデータ損失に発展する可能性があります。
- クラスタヘルスの劣化が検索の可用性に影響する前に検出
- out-of-memoryクラッシュを防ぐためにJVMヒープを監視
- 取り込みパイプラインの健全性を維持するためにインデックススループットを追跡
- データレプリケーション不足を引き起こす未割り当てシャードを特定
- ユーザー向けアプリケーション向けに検索レイテンシを最適化
なぜ選ぶべきか: Xitoring
XitoringはゼロコンフィグでエンタープライズグレードのElasticsearch監視を提供します。軽量エージェントがElasticsearchノードを自動検出し、60秒以内にメトリクス収集を開始、既存の通知チャネルと統合します。
- ワンコマンドインストール — 複雑なYAMLや設定ファイルは不要
- 低遅延チェックのための15以上のグローバル監視ノード
- サーバー、検索クラスタ、稼働率を統合したダッシュボード
- Slack、PagerDuty、Telegramなどによる柔軟なアラート
- キャパシティプランニングと監査のための履歴データ保持
一般的な Elasticsearch 監視の シナリオ
Elasticsearchが今日一般的に稼働している場所 — そして誰も監視していない場合に何が問題になる可能性があるか。
ログと可観測性データ
アプリやサーバーがログをElasticsearchにストリーミングするとき、バックログや拒否が発生すると、状況の一部が欠落することを意味します。これはインシデント発生時に最も必要とされる情報です。私たちはボトルネックが小さい間にそれを捉え、チームの診断履歴が完全な状態を保つようにします。
ウェブサイト、アプリ、AI機能の検索
検索がウェブサイト、アプリ、またはAI機能を強化している場合、遅いクエリはユーザーエクスペリエンスとコンバージョンに直接悪影響を与えます。私たちは応答時間と容量を監視し、検索の速度低下が収益や製品の問題になる前に修正できるようにします。
AWSまたは他のクラウド上のマネージド検索
クラウドプロバイダーはサービスを運用してくれますが、あなたのワークロードがそれを圧倒している場合や、クエリが遅くなり始めていることを教えてくれません。私たちはその可視性のギャップを埋め、コストとパフォーマンスの両方があなたの管理下に留まるようにします。
Elasticsearch の 前提条件
これらが揃っていることを確認してください — 揃っていれば、ほとんどの導入は 60 秒で完了します。
- Elasticsearch 7.x または 8.x が REST ポート(デフォルト 9200)でアクセス可能であること
- セキュリティが有効な場合、cluster:monitor 権限を持つ監視ユーザー
- HTTPS が必要な場合、Xitogent から利用可能な TLS/CA 設定
はじめに 議事録
Xitogent をサーバーにインストール
まだの場合は、軽量な Xitogent 監視エージェントをサーバーにインストールしてください。
curl -s https://xitoring.com/install.sh | sudo bash -s -- --key=YOUR_API_KEYElasticsearch API のアクセス確認
Xitogent は Elasticsearch REST API を使用してメトリクスを収集します。クラスターが到達可能であることを確認してください:
curl -s http://localhost:9200/_cluster/health | python3 -m json.toolElasticsearch 連携を有効化
Xitoring ダッシュボードまたは CLI から Elasticsearch 連携を有効化してください。
sudo xitogent integrateアラートしきい値を設定(オプション)
クラスターヘルス、JVM ヒープ、インデックスレートにカスタムしきい値を設定し、注意が必要なときに通知を受け取れるようにします。
動作確認
サーバー上でこのコマンドを実行して、Xitogent が連携を認識していることを確認してください。約 30 秒以内に新しいメトリクスがダッシュボードに流れ始めます。
sudo xitogent status代替ツールを 検討中ですか?
Elasticsearch 監視の代替ツールと比べて Xitoring がどう優れているかをご覧ください — 定額料金、より深い統合、そしてスタック全体をカバーする 1 つのエージェント。


頻繁に 質問をした
この統合には認証が必要ですか?
この統合はElasticsearchのパフォーマンスに影響を与えますか?
マルチノードクラスタを監視することはできますか?
OpenSearchを監視することはできますか?
Elasticsearchのどのバージョンがサポートされていますか?
指標はどのくらいの頻度で収集されますか?
search スレッドプールとは何で、拒否はどう監視しますか?
Elasticsearch と OpenSearch の監視 — 何が違いますか?
対応している Elasticsearch のバージョンは?
探検を続けよう