Memcached 監視
設定不要で、Memcachedの接続状況、ヒット率、メモリ使用量、およびエヴィクションのメトリクスをリアルタイムで監視できます。
なぜ監視するのか Memcached?
Memcachedは、データベースへの負荷を軽減することで動的Webアプリケーションの処理を高速化する、高性能な分散メモリキャッシュシステムです。Memcachedを監視することで、キャッシュの最適な利用を確保し、エヴィクションストームを検知し、キャッシュ層全体でのメモリ枯渇を防ぐことができます。
Memcached 監視を、 解説
Memcached 監視は、エビクション ストーム、メモリ圧迫、コネクション飽和、ヒット率低下を、キャッシュされていないリクエストがデータベースに殺到する前に検知します。WordPress オブジェクトキャッシュ、PHP セッション、Django/Rails クエリ結果キャッシュ、AWS ElastiCache Memcached の各デプロイメントでは、ノードごとの可視性こそが、午前 3 時に DB が 100% CPU に張り付いていることを発見するのと、60 秒で届くアラートを分ける鍵です。Xitoring はあなたの Memcached を自動検出し、stats を 1 分間隔で読み取り、Slack、PagerDuty、Telegram、その他既存のオンコール体制にアラートを送信します。
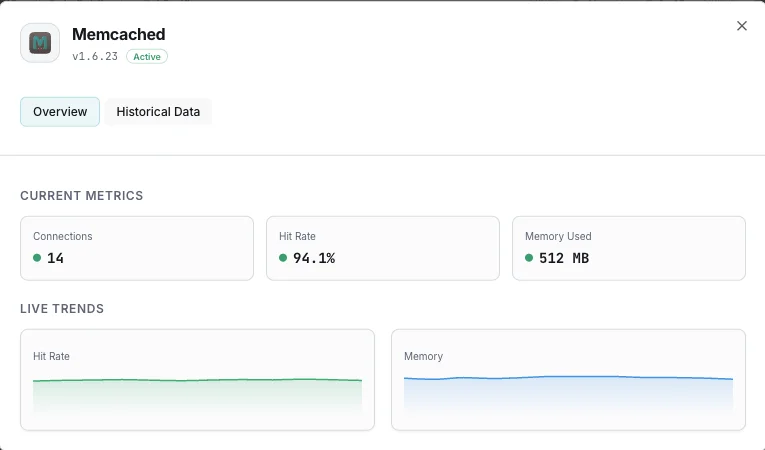
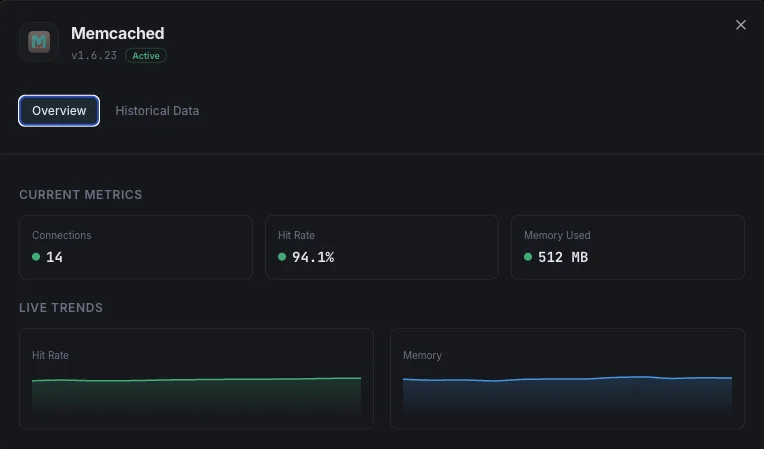
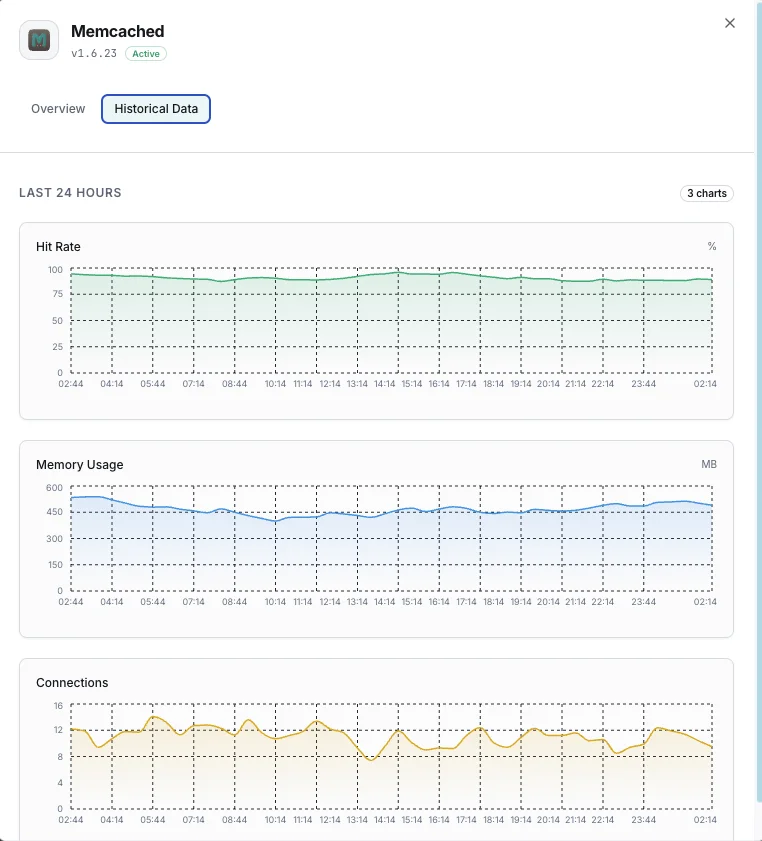
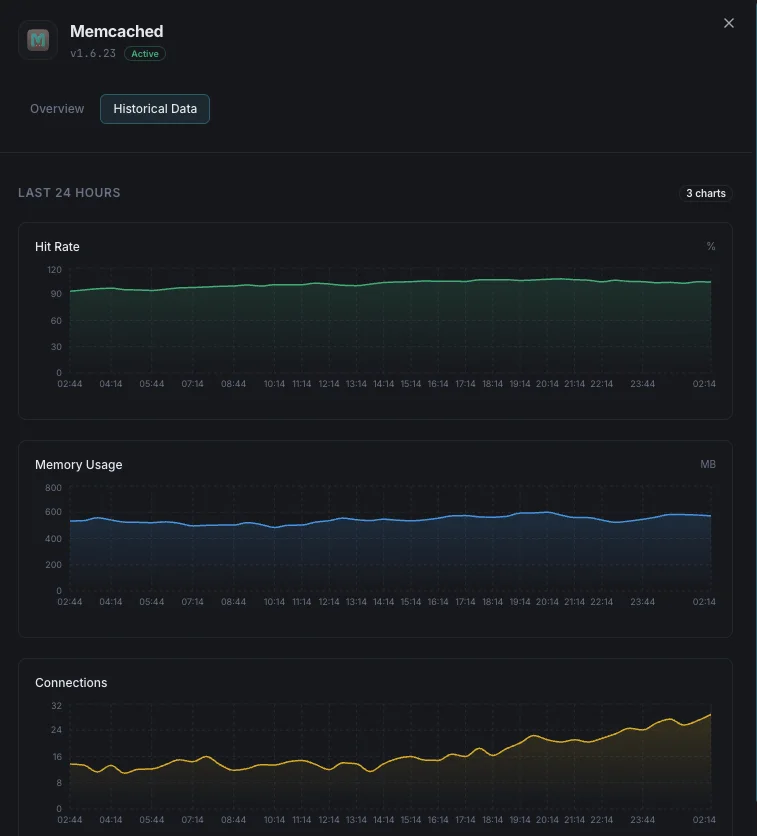
私たちが 監視するもの
使用メモリ
キャッシュアイテム用に現在割り当てられている総メモリ。
最大メモリ
Memcachedインスタンスに設定された最大メモリ上限。
ヒット率
キャッシュ検索の成功とミスの割合。キャッシュの有効性を示します。
エビクション
新しいデータのために退避されたアイテム数。
現在の接続数
現在開いているクライアント接続数。
保存アイテム
キャッシュに現在保存されているアイテムの総数。
Get/Set比率
getコマンドとsetコマンドの比率。読み書きのバランスを示します。
読み書きバイト
Memcachedインスタンスの総ネットワークスループット。
CASヒット/ミス
並行更新のためのcheck-and-set操作の成功率。
スラブ使用量
スラブクラス間のメモリ割り当て効率。
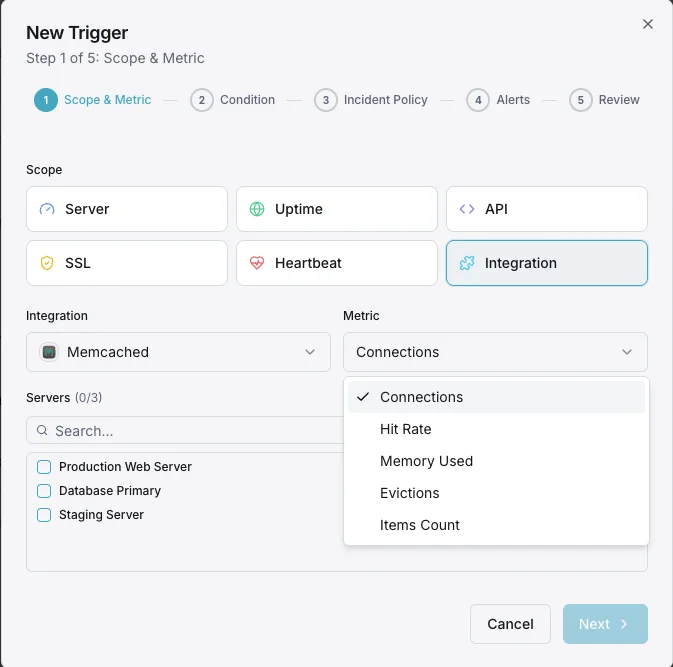
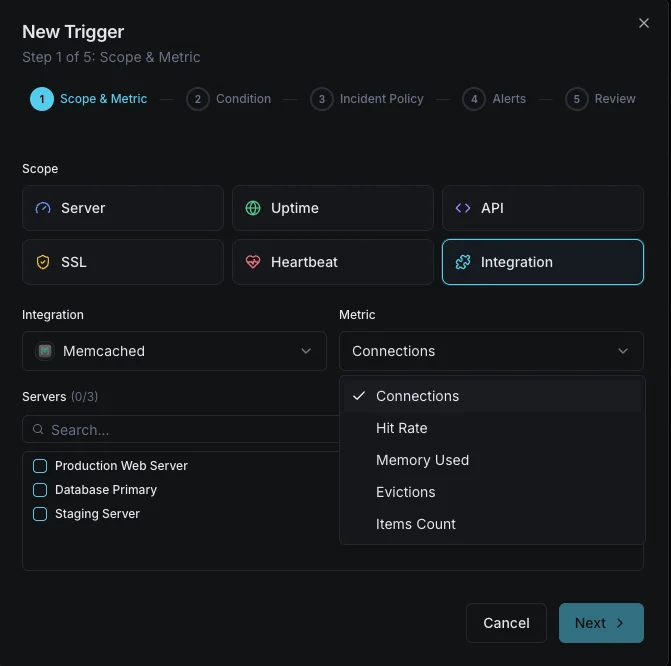
設定可能 アラートのトリガー
ダッシュボードでカスタムトリガーを設定し、Memcachedのメトリクスが定義した閾値を超えた瞬間に通知を受け取れるようにします。
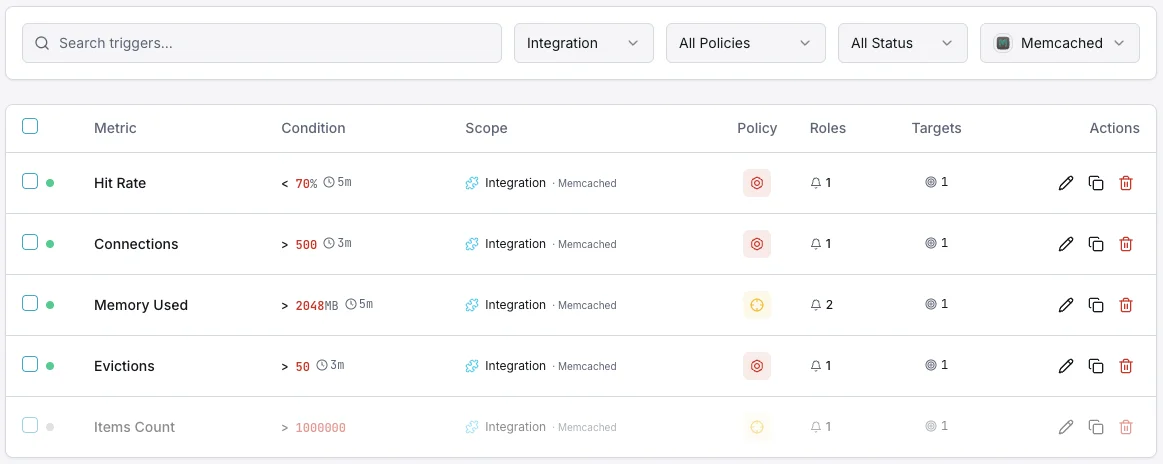
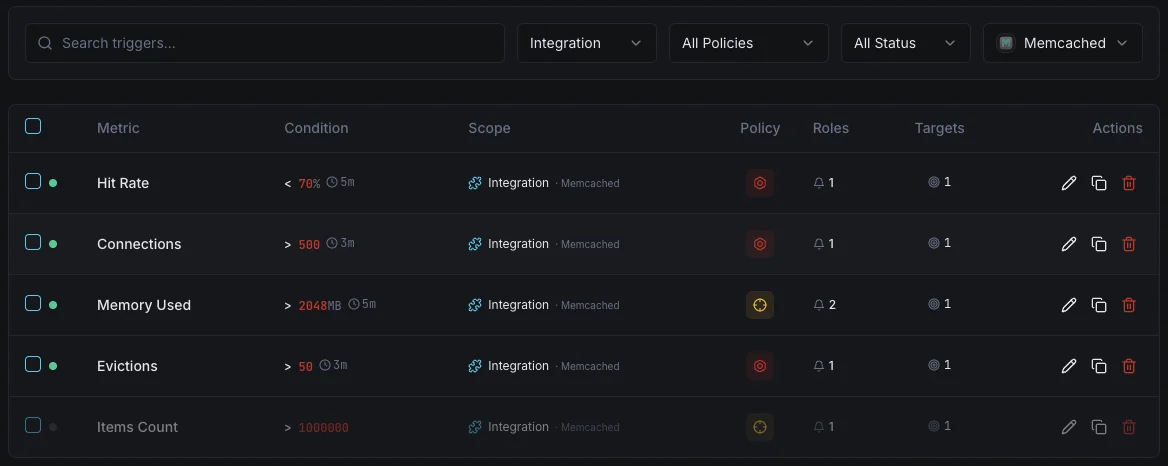
メモリ使用量
重要なMemcachedのメモリ消費が設定上限に近づいたときに発動。エビクションのリスクを示します。
ヒット率低下
警告キャッシュヒット率が閾値を下回ったときにアラート。キャッシュ非効率や作業セット変化を示します。
エビクションレート
重要なエビクションレートが急増したときに発動。Memcachedがメモリ上限内に収まるよう積極的にデータを削除していることを示します。
接続数
警告クライアント接続数が閾値を超えたときに発動。接続リークの可能性を示します。
回収アイテム
警告期限切れアイテムが高頻度で回収されたときにアラート。TTL設定ミスを示唆します。
の重要性: Memcached監視
Memcachedはアプリケーションのパフォーマンス層を静かに支えています。監視がないと、メモリ枯渇、エビクションストーム、接続リークが誰にも気付かれずアプリケーション全体を劣化させます。
- アプリケーションパフォーマンスにエビクションが影響する前にメモリ圧迫を検出
- 最適な応答時間を確保するためにキャッシュヒット率を監視
- メモリ割り当てを正しくサイジングするためにエビクションパターンを追跡
- アプリケーションクライアントからの接続リークを特定
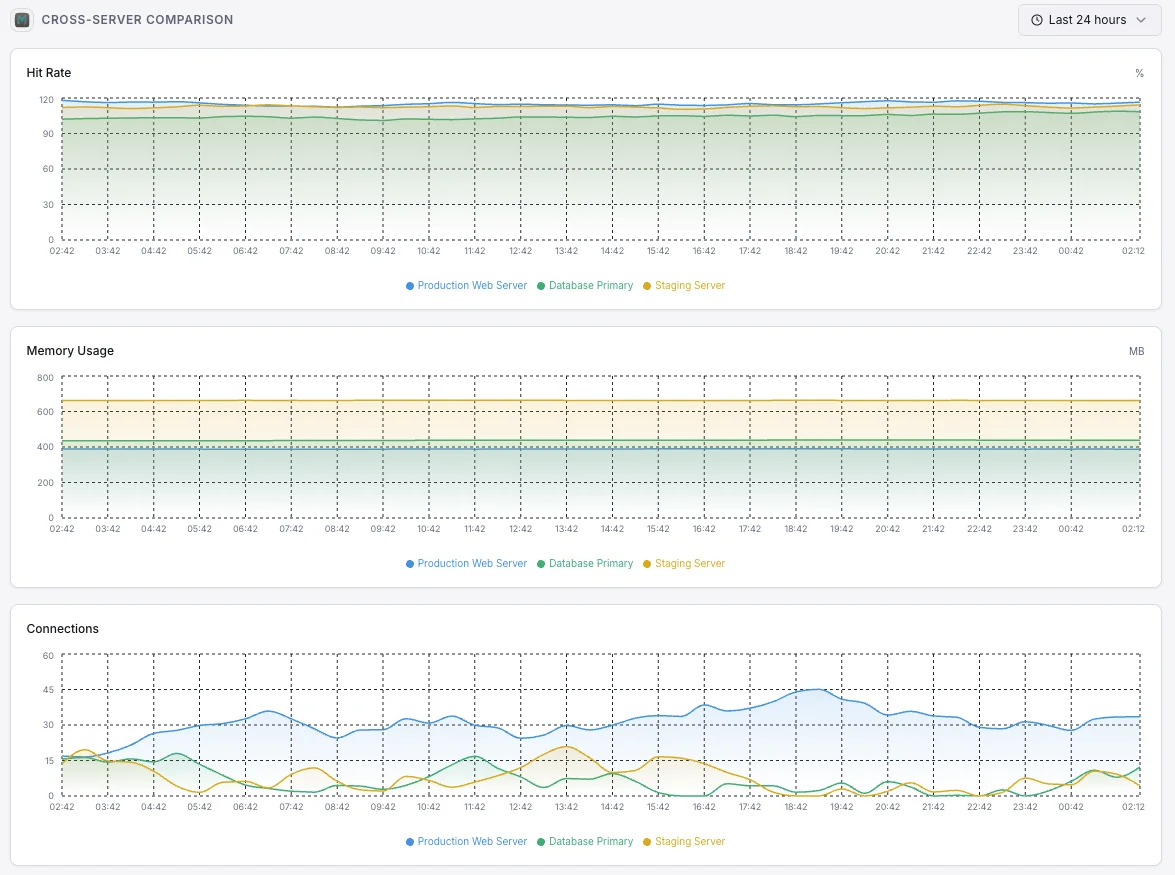
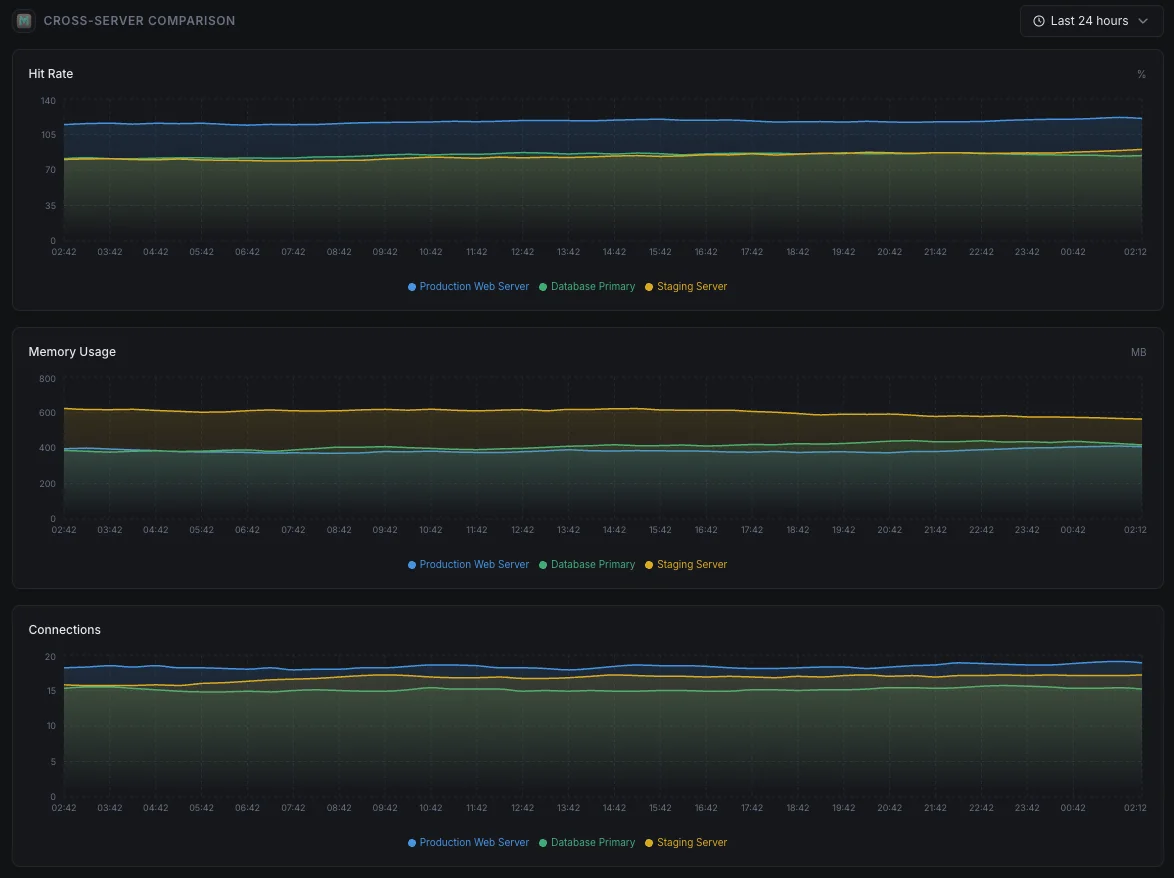
- 分散ノード全体で一貫したキャッシュパフォーマンスを確保
なぜ選ぶべきか: Xitoring
XitoringはゼロコンフィグでエンタープライズグレードのMemcached監視を提供します。軽量エージェントがMemcachedインスタンスを自動検出し、60秒以内にメトリクス収集を開始、既存の通知チャネルと統合します。
- ワンコマンドインストール — 複雑なYAMLや設定ファイルは不要
- 低遅延チェックのための15以上のグローバル監視ノード
- サーバー、キャッシュ、稼働率を統合したダッシュボード
- Slack、PagerDuty、Telegramなどによる柔軟なアラート
- キャパシティプランニングと監査のための履歴データ保持
よくある Memcached 監視 シナリオ
Memcachedが今日一般的に実行されている場所 — そして誰も監視していない場合に何が問題になる可能性があるか。
WordPressおよびPHPサイトの高速化
Memcachedは、繰り返される作業の結果を記憶することで、WordPressおよびPHPサイトを高速に保ちます。キャッシュが効果を発揮しなくなると、サイトは負荷がかかると静かに遅くなります。私たちはそれを早期に表面化させ、訪問者やコンバージョンが静かに影響を受けないようにします。
ウェブアプリとAPIの高速化
ウェブアプリは最もコストのかかる結果をキャッシュに保存するため、すべてのリクエストでそれらを計算する必要がありません。キャッシュがいっぱいになったり、スラッシングを開始したりすると、元の作業がデータベースに殺到します。私たちはキャッシュがアプリを保護しなくなった瞬間を捉え、ユーザーがそれを感じる前にチームが介入できるようにします。
クラウドで実行されるマネージドキャッシュ
クラウドプロバイダーはサーバーを管理しますが、キャッシュの利用が非効率になっている場合(メモリ不足、接続制限への到達、有用なデータの削除など)は教えてくれません。私たちはそのギャップを埋め、コストとパフォーマンスを管理できるようにします。
Memcached の 前提条件
これらが揃っていることを確認してください — 揃っていれば、ほとんどの導入は 60 秒で完了します。
- Memcached が設定済みのポートで稼働中であること(デフォルト 11211)
- Xitogent から Memcached インスタンスへのネットワーク到達性
- stats コマンドにアクセス可能(デフォルトでは AUTH 不要)
はじめに 議事録
Xitogent をサーバーにインストール
まだの場合は、軽量な Xitogent 監視エージェントをサーバーにインストールしてください。
curl -s https://xitoring.com/install.sh | sudo bash -s -- --key=YOUR_API_KEYMemcached stats が到達可能であることを確認
Xitogent は Memcached の stats コマンドを使用してメトリクスを収集します。インスタンスがローカルから到達可能であることを確認してください:
echo 'stats' | nc localhost 11211 | head -10Memcached 連携を有効化
Xitoring ダッシュボードまたは CLI から Memcached 連携を有効化してください。Xitogent がインスタンスを自動検出します。
sudo xitogent integrateアラートしきい値を設定(オプション)
メモリ使用量、ヒット率、エビクション数などのメトリクスにカスタムしきい値を設定し、注意が必要なときに通知を受け取れるようにします。
動作確認
サーバー上でこのコマンドを実行して、Xitogent が連携を認識していることを確認してください。約 30 秒以内に新しいメトリクスがダッシュボードに流れ始めます。
sudo xitogent status代替ツールを 検討中ですか?
Memcached 監視の代替ツールと比べて Xitoring がどう優れているかをご覧ください — 定額料金、より深い統合、そしてスタック全体をカバーする 1 つのエージェント。


