MSSQL Suivi
Surveillez en temps réel les performances des requêtes Microsoft SQL Server, les statistiques d'attente, le cache tampon et l'état du journal des transactions, sans aucune configuration.
Pourquoi surveiller ? MSSQL?
Microsoft SQL Server est au cœur des applications d'entreprise, des entrepôts de données et des plateformes de veille stratégique dans le monde entier. La surveillance de MSSQL est essentielle pour optimiser les plans d'exécution des requêtes, suivre les statistiques d'attente, gérer l'efficacité du cache tampon et détecter les blocages. L'intégration MSSQL de Xitoring offre une visibilité complète sur vos instances SQL Server.
La supervision SQL Server, expliquée
La supervision SQL Server détecte les chaînes de blocage, les tempêtes de deadlocks, la dérive des Always On AG, la pression mémoire et les régressions de plans du Query Store avant qu'elles ne provoquent des lenteurs visibles par les utilisateurs ou des événements de failover HA. Pour Dynamics 365, SharePoint, les ERP et toute charge SQL d'entreprise, la visibilité par base sur les wait stats et le Query Store fait la différence entre une correction de tuning propre et une chasse à la cause racine de plusieurs jours. Xitoring détecte automatiquement votre SQL Server, lit les DMV natives avec la permission VIEW SERVER STATE et achemine les alertes vers Slack, PagerDuty, Telegram ou votre rotation d'astreinte existante.
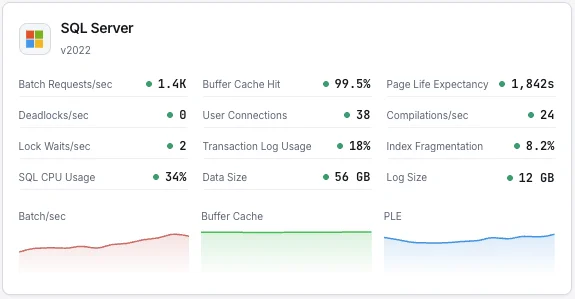
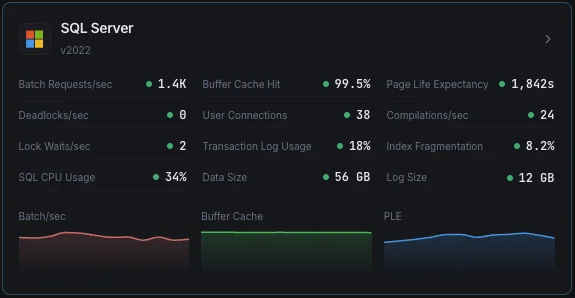
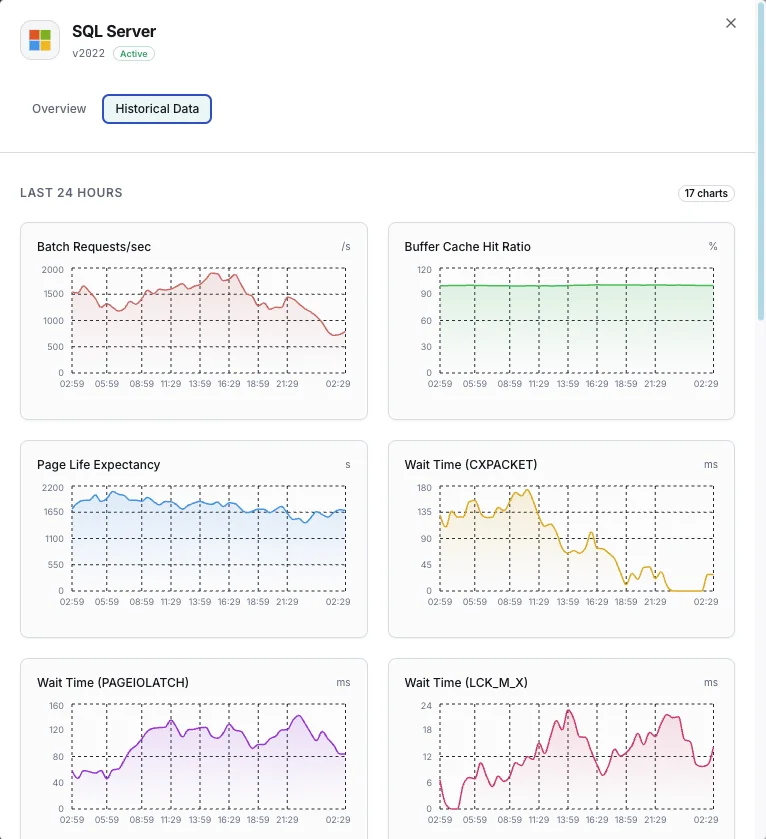
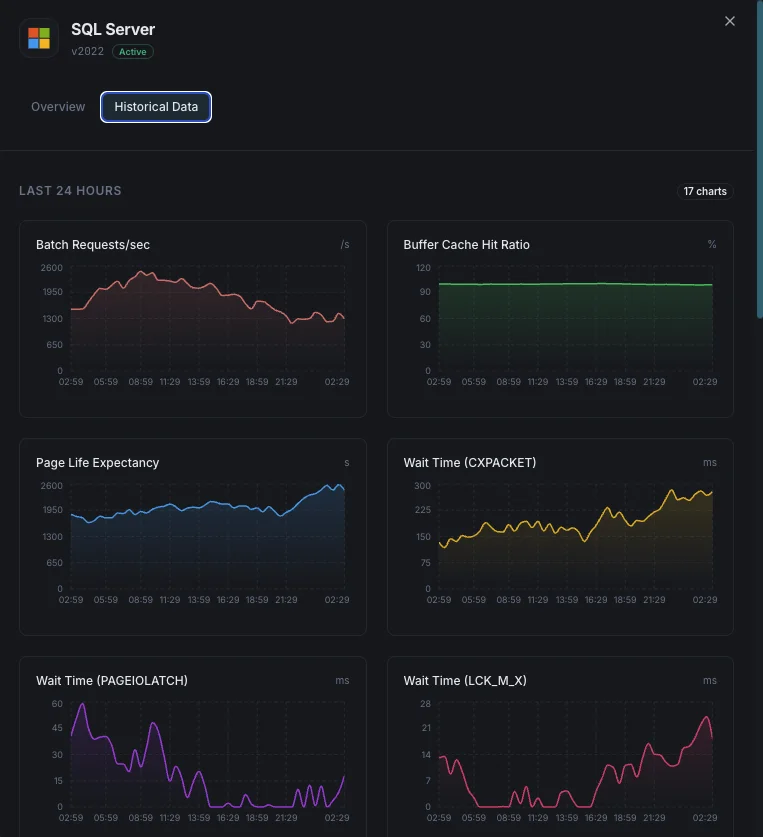
Ce que nous surveillons
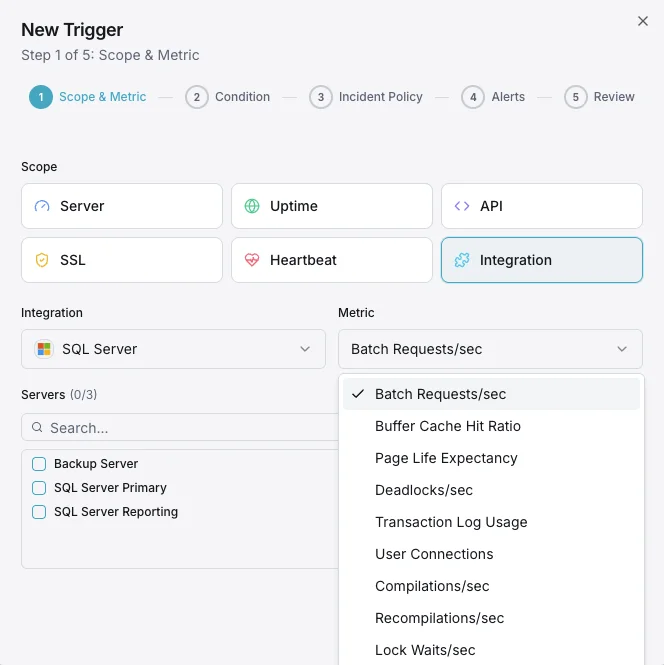
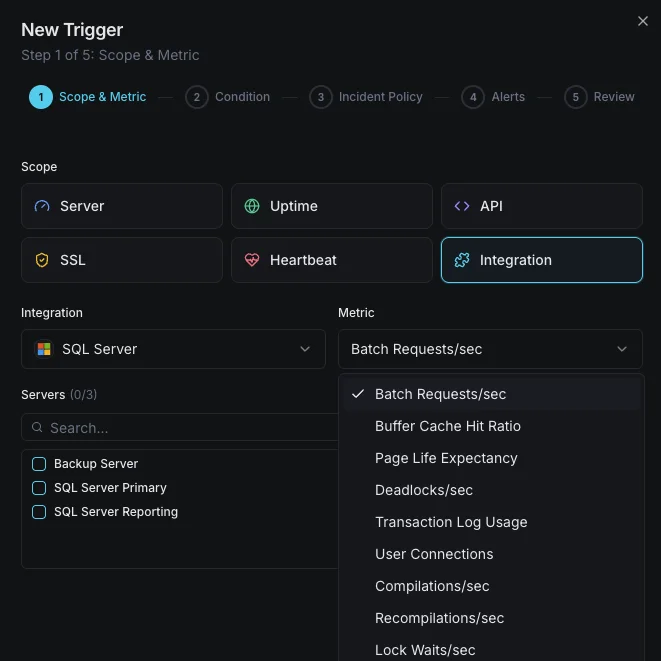
Batch Requests/sec
Nombre de batch requests SQL reçues par seconde.
Ratio de hit du buffer cache
Pourcentage de lectures de pages satisfaites depuis le buffer pool vs lectures disque physiques.
Page Life Expectancy
Temps moyen (en secondes) qu'une page reste dans le buffer pool — des valeurs basses indiquent une pression mémoire.
Statistiques d'attente
Top types d'attente et durées indiquant les goulets d'étranglement de ressources.
Deadlocks/sec
Nombre de demandes de verrous ayant abouti à des deadlocks.
Utilisation du transaction log
Pourcentage d'espace de transaction log utilisé par base de données.
Connexions utilisateur
Nombre de connexions utilisateur actives à l'instance SQL Server.
Compilations/sec
Nombre de compilations et recompilations SQL par seconde.
Lock Waits/sec
Nombre de demandes de verrous ayant nécessité une attente de l'appelant.
Fragmentation des index
Niveau de fragmentation des index entre bases de données.
Utilisation CPU
Utilisation CPU du processus SQL Server vs CPU système total.
Taille de la base de données
Tailles des fichiers de données et de log pour chaque base de données.
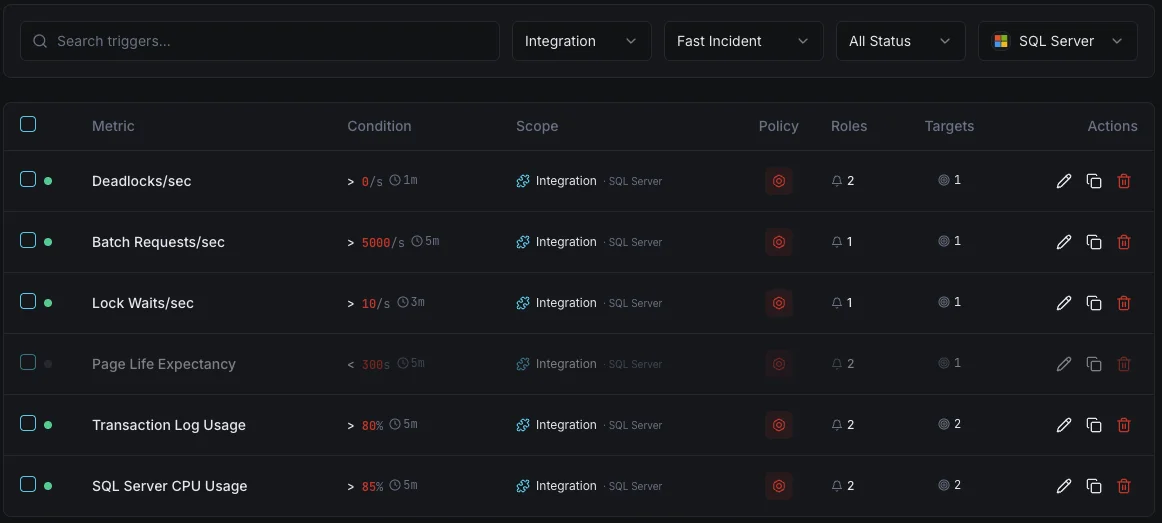
Configurables déclencheurs d'alerte
Configurez des déclencheurs personnalisés dans votre tableau de bord pour être averti dès que les indicateurs d{name}s dépassent les seuils que vous avez définis.
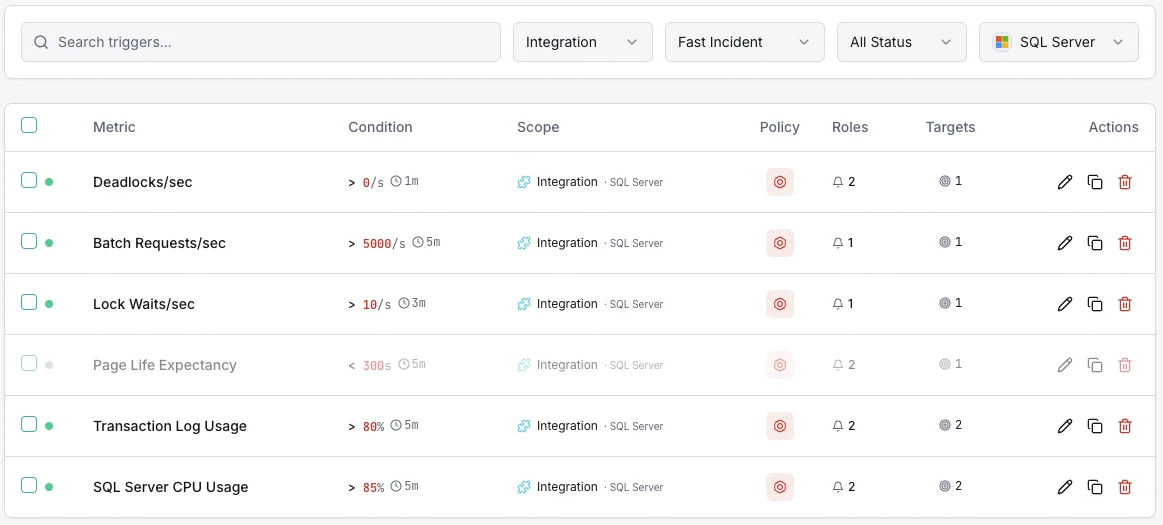
Ratio de hit du buffer cache
crucialSe déclenche lorsque le ratio de hit du cache tombe sous le seuil, indiquant une mémoire insuffisante pour la charge de travail.
Page Life Expectancy
avertissementSe déclenche lorsque le PLE tombe sous le seuil, signifiant que les pages sont expulsées trop rapidement de la mémoire.
Verrous mortels
crucialAlerte lorsque le taux de deadlocks dépasse le seuil, indiquant une contention de verrous dans les requêtes applicatives.
Utilisation du transaction log
crucialSe déclenche lorsque l'utilisation du transaction log dépasse le seuil, risquant des échecs d'écriture.
Connexions utilisateur
avertissementSe déclenche lorsque le nombre de connexions approche les limites, risquant des erreurs de connexion refusée.
Statistiques d'attente
avertissementAlerte lorsque des types d'attente spécifiques s'envolent, indiquant des goulets d'étranglement de ressources (CPU, I/O, mémoire, verrous).
Importance de la surveillance MSSQL
SQL Server exécute des charges de travail d'entreprise critiques — des systèmes ERP et bases de données financières aux plateformes e-commerce. Sans surveillance, la pression sur les buffers, les deadlocks et le gonflement des transaction logs peuvent provoquer des pannes et la corruption des données.
- Détectez la pression mémoire via les métriques de buffer cache et PLE
- Surveillez les statistiques d'attente pour identifier la cause racine des ralentissements
- Suivez les deadlocks pour corriger les problèmes de verrouillage au niveau applicatif
- Garantissez l'espace transaction log pour des opérations d'écriture ininterrompues
- Optimisez l'utilisation des index pour maintenir les performances des requêtes au fil du temps
Pourquoi choisir Xitoring
Xitoring offre une surveillance SQL Server de qualité entreprise avec une configuration zéro-config. Notre agent léger détecte automatiquement vos instances MSSQL, commence à collecter des métriques en moins de 60 secondes et s'intègre à vos canaux de notification existants.
- Prise en charge native de Windows Server avec installateur facile
- 15+ nœuds de surveillance mondiaux pour des contrôles à faible latence
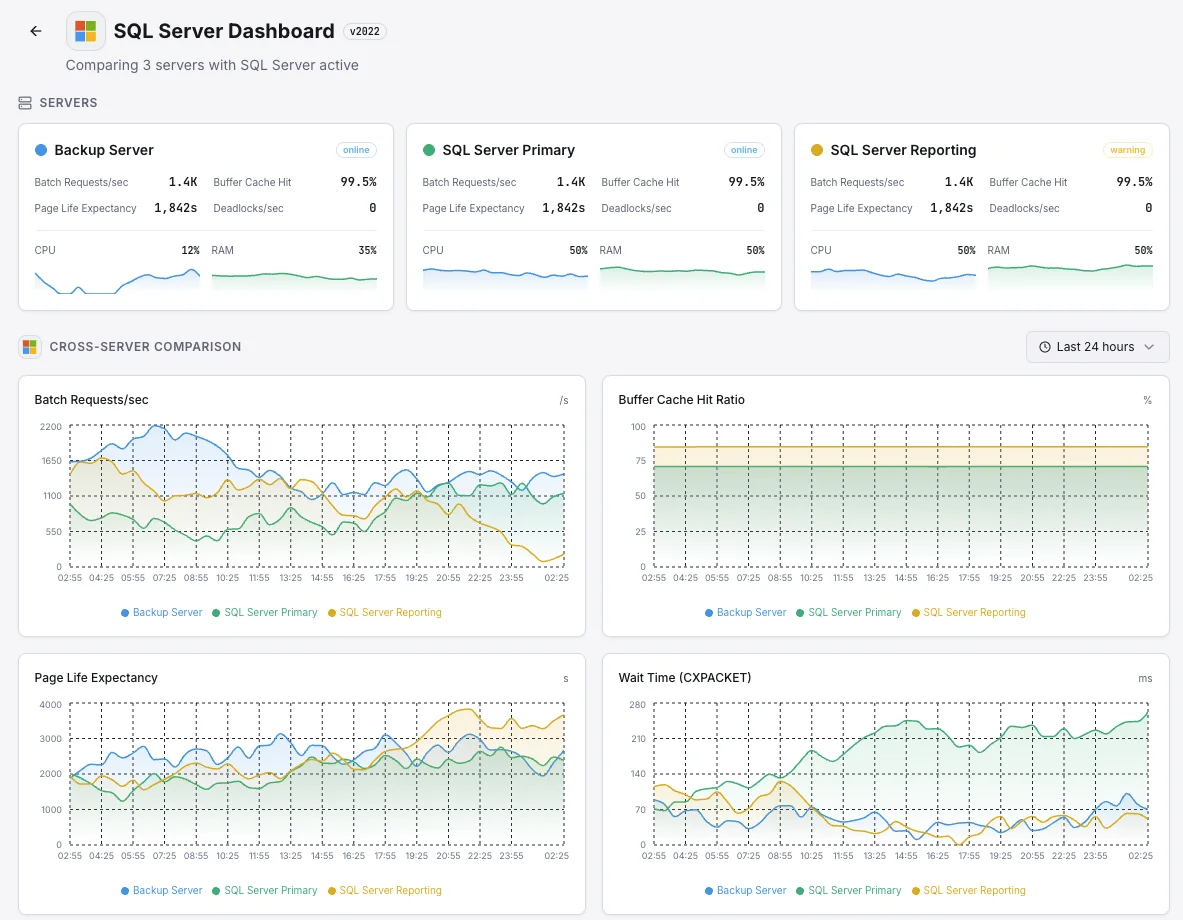
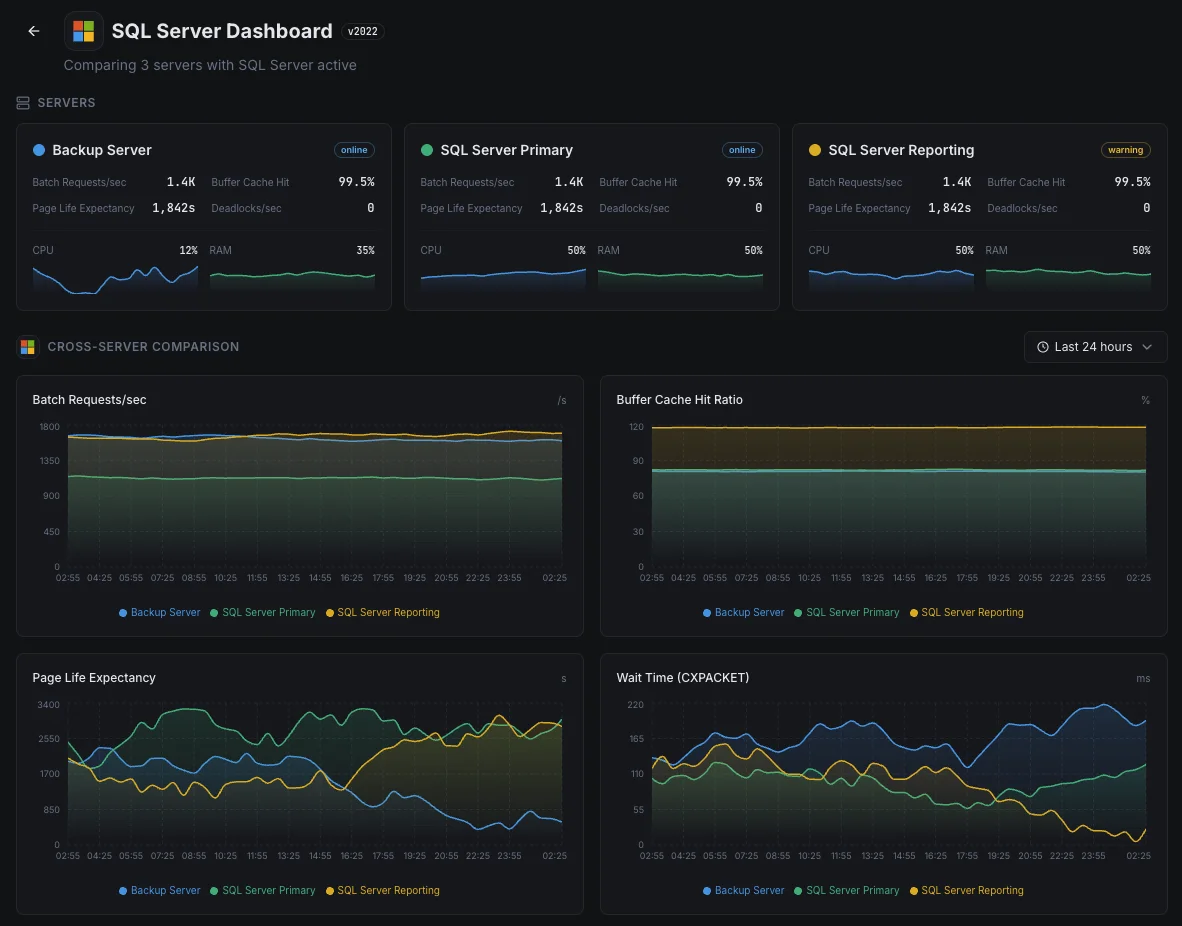
- Tableau de bord unifié pour serveurs, bases de données et uptime
- Alerting flexible via Slack, PagerDuty, Telegram et plus
- Conservation de l'historique pour la planification de capacité et les audits
Scénarios courants de supervision SQL Server
Où SQL Server fonctionne généralement aujourd'hui — et ce qui pourrait mal tourner si personne ne surveille.
Applications métier et systèmes ERP
Lorsque SQL Server exécute des applications métier critiques — finance, RH, ventes — une base de données lente devient une entreprise lente. Nous surveillons les signaux qui indiquent quand la base de données commence à avoir des difficultés afin que l'équipe puisse la corriger avant que le personnel ne commence à appeler le service informatique.
Bases de données de sauvegarde pour la reprise après sinistre
Les entreprises exécutent des copies supplémentaires de leur base de données — souvent dans une autre région — afin qu'une seule panne ne mette pas l'entreprise hors ligne. Lorsque ces copies prennent du retard, la récupération perdrait plus de données que prévu. Nous surveillons chaque copie afin que le plan de reprise après sinistre fonctionne toujours le jour où vous en avez réellement besoin.
SQL Server dans le cloud ou sur Linux
Que SQL Server fonctionne dans Azure, sur Linux ou quelque part entre les deux, la visibilité que vous obtenez de la plateforme seule est rarement suffisante. Nous mettons en évidence les ralentissements de requêtes et d'autres problèmes internes afin que les coûts et les performances restent sous votre contrôle.
Prérequis pour MSSQL
Assurez-vous d'avoir tout cela en place — la plupart des installations sont une affaire de 60 secondes une fois ces conditions réunies.
- Microsoft SQL Server 2012 ou plus récent (2022+ pour la métrique size_on_disk_bytes)
- Un login SQL avec les permissions CONNECT ANY DATABASE, VIEW SERVER STATE, VIEW ANY DEFINITION et SELECT
- TCP/IP activé sur l'instance, avec le port accessible depuis Xitogent
Commencez par procès-verbal
Installer Xitogent sur votre serveur Windows
Téléchargez et installez l'agent Xitogent sur votre serveur Windows qui héberge SQL Server.
# Download from https://xitoring.com/xitogent
# Run the installer as AdministratorConfigurer l'accès à SQL Server
Créez un login dédié pour le monitoring avec des privilèges minimaux :
CREATE LOGIN xitoring WITH PASSWORD = 'your_password';
CREATE USER xitoring FOR LOGIN xitoring;
GRANT CONNECT ANY DATABASE TO xitoring;
GRANT VIEW SERVER STATE TO xitoring;
GRANT VIEW ANY DEFINITION TO xitoring;
GRANT SELECT TO xitoring;Activer l'intégration MSSQL
Utilisez le tableau de bord Xitoring ou la CLI pour activer l'intégration MSSQL.
xitogent integrateConfigurer les seuils d'alerte (facultatif)
Définissez des seuils personnalisés pour le taux de hit du buffer cache, la durée de vie des pages ou le nombre de deadlocks afin d'être notifié dès que quelque chose mérite votre attention.
Vérifier que tout fonctionne
Exécutez cette commande sur le serveur pour confirmer que Xitogent a bien détecté l'intégration. De nouvelles métriques apparaîtront sur votre tableau de bord dans environ 30 secondes.
sudo xitogent statusVous envisagez des alternatives ?
Découvrez comment Xitoring se positionne face aux alternatives pour la surveillance de MSSQL — tarifs forfaitaires, intégrations plus poussées et un seul agent pour couvrir tout votre stack.


Souvent a posé des questions
Cette intégration prend-elle en charge SQL Server sous Linux ?
Cette intégration aura-t-elle un impact sur les performances de SQL Server ?
Puis-je surveiller plusieurs instances ?
Puis-je surveiller Azure SQL Database ?
Quelles versions de SQL Server sont prises en charge ?
À quelle fréquence les indicateurs sont-ils collectés ?
Comment détecter les deadlocks dans SQL Server ?
Comment superviser la santé des sauvegardes SQL Server ?
Quelles versions de SQL Server sont prises en charge ?
Commencer à surveiller MSSQL aujourd'hui
Configuration en moins de 60 secondes. Aucune carte bancaire requise. Statistiques complètes dès le premier jour.
Commencer l'essai gratuitContinuez à explorer