MSSQL 監視
設定作業を一切行わずに、Microsoft SQL Server のクエリパフォーマンス、待機統計、バッファキャッシュ、およびトランザクションログの状態をリアルタイムで監視できます。
なぜ監視するのか MSSQL?
Microsoft SQL Serverは、世界中のエンタープライズアプリケーション、データウェアハウス、ビジネスインテリジェンスプラットフォームを支えています。クエリ実行プランの最適化、待機統計の追跡、バッファキャッシュの効率管理、デッドロックの検出を行うためには、MSSQLの監視が不可欠です。XitoringのMSSQL統合機能により、SQL Serverインスタンスの状況を包括的に把握することができます。
SQL Server 監視を、 解説
SQL Server 監視は、ブロッキング チェーン、デッドロック ストーム、Always On AG のドリフト、メモリ圧迫、Query Store のプラン リグレッションを、ユーザーから見える低速化や HA フェイルオーバー イベントを引き起こす前に検知します。Dynamics 365、SharePoint、ERP、あらゆるエンタープライズ SQL ワークロードにおいて、データベースごとの wait-stats と Query Store の可視性こそが、クリーンなチューニング修正と数日にわたる根本原因追跡とを分ける鍵です。Xitoring は SQL Server を自動検出し、VIEW SERVER STATE 権限でネイティブの DMV を読み取り、Slack、PagerDuty、Telegram、その他既存のオンコール体制にアラートを送信します。
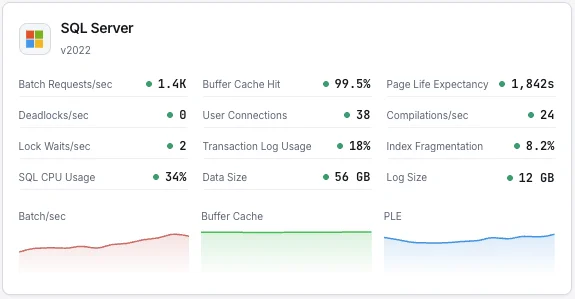
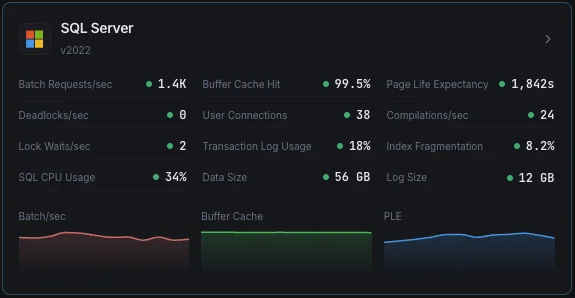
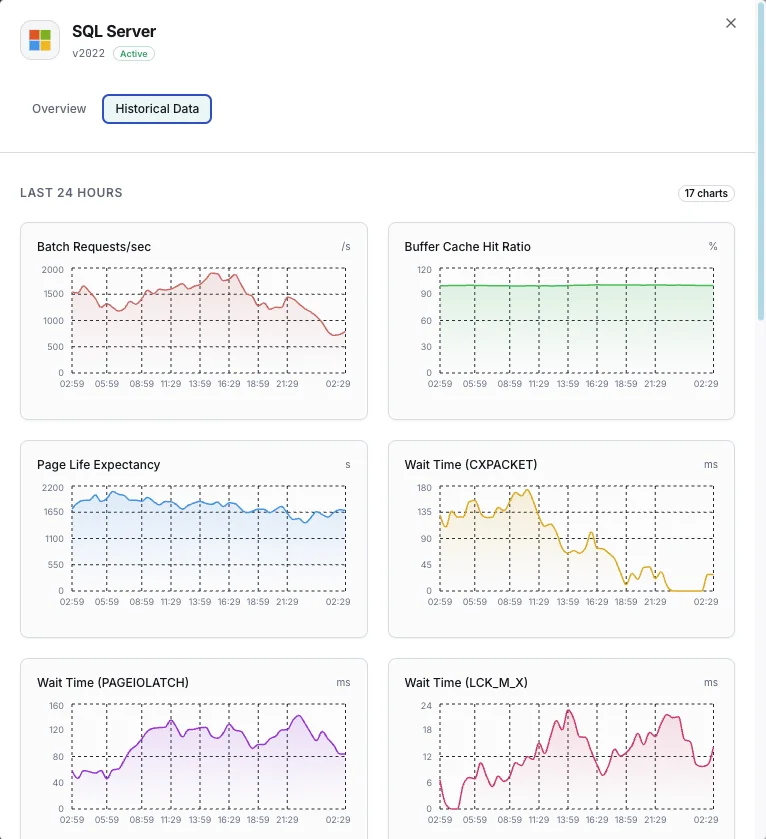
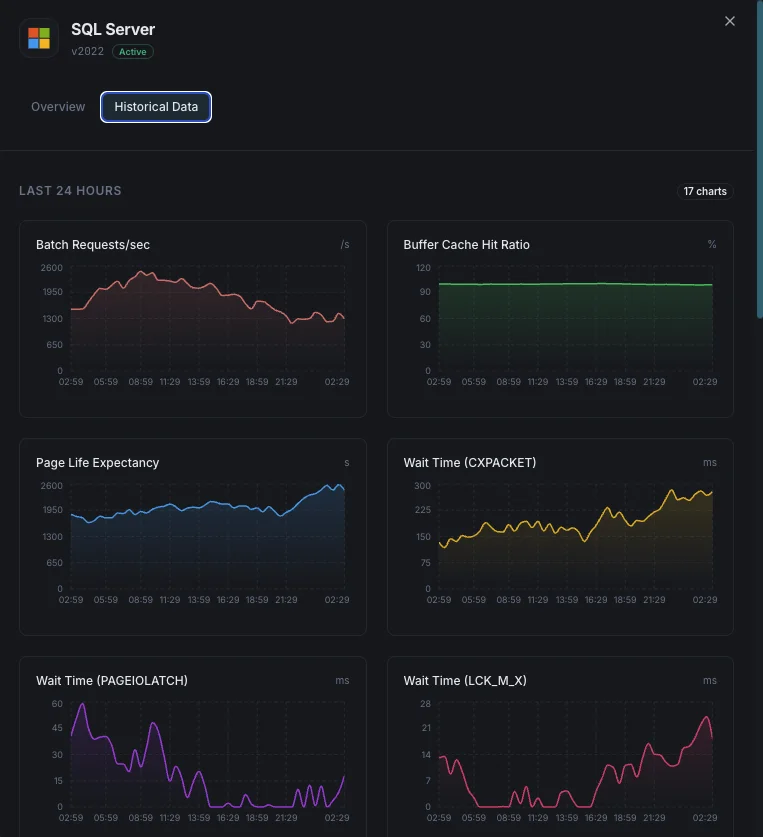
私たちが 監視するもの
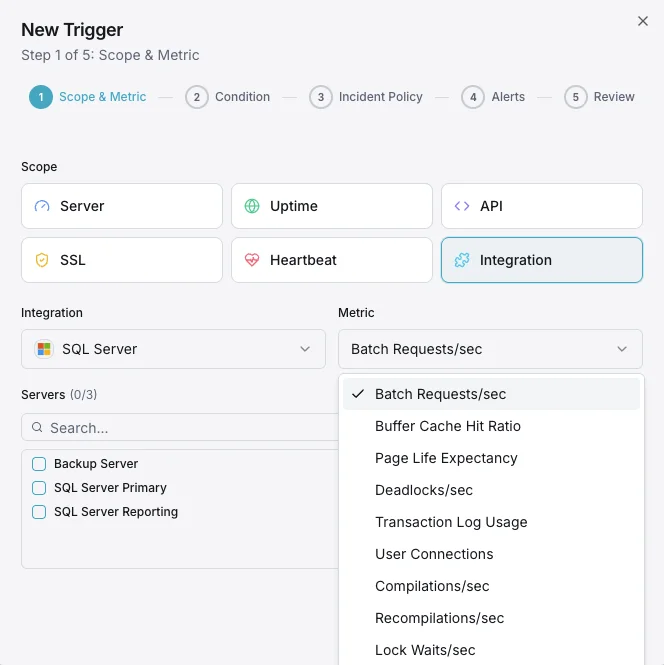
バッチリクエスト/秒
1秒あたりに受信するSQLバッチリクエスト数。
バッファキャッシュヒット率
物理ディスク読み取りに対してバッファプールから満たされたページ読み取りの割合。
ページライフエクスペクタンシー
ページがバッファプールに留まる平均時間(秒)。値が低いとメモリ圧迫を示します。
待機統計
リソースボトルネックを示す主要な待機タイプと時間。
デッドロック/秒
デッドロックに発展したロック要求数。
トランザクションログ使用量
データベースごとのトランザクションログ容量使用率。
ユーザー接続
SQL Serverインスタンスへのアクティブなユーザー接続数。
コンパイル/秒
1秒あたりのSQLコンパイル数と再コンパイル数。
ロック待機/秒
呼び出し元が待機する必要があったロック要求数。
インデックス断片化
データベース全体でのインデックス断片化レベル。
CPU使用率
システム全体のCPUに対するSQL ServerプロセスのCPU使用率。
データベースサイズ
各データベースのデータファイルとログファイルのサイズ。
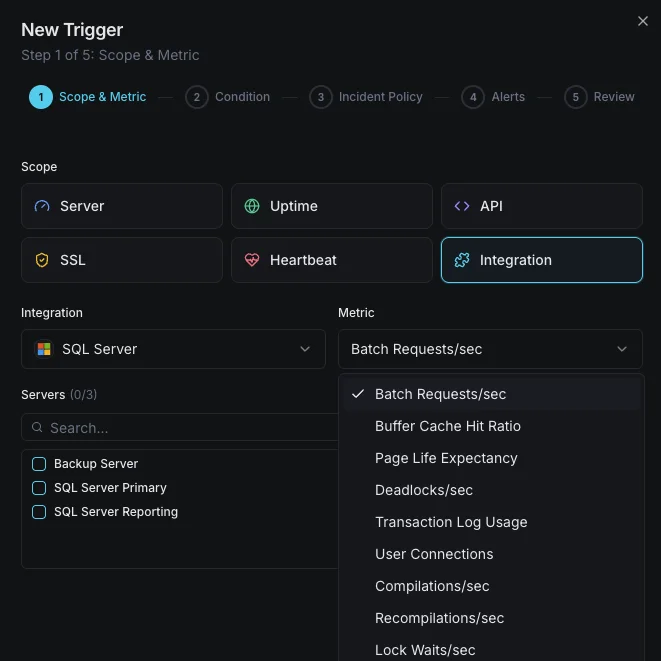
設定可能 アラートのトリガー
ダッシュボードでカスタムトリガーを設定し、MSSQLのメトリクスが定義した閾値を超えた瞬間に通知を受け取れるようにします。
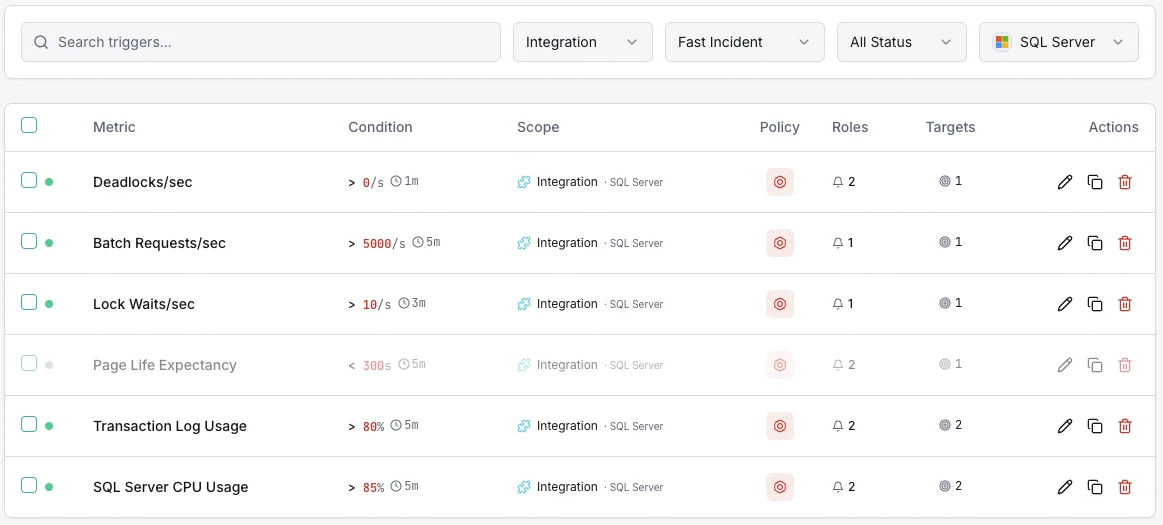
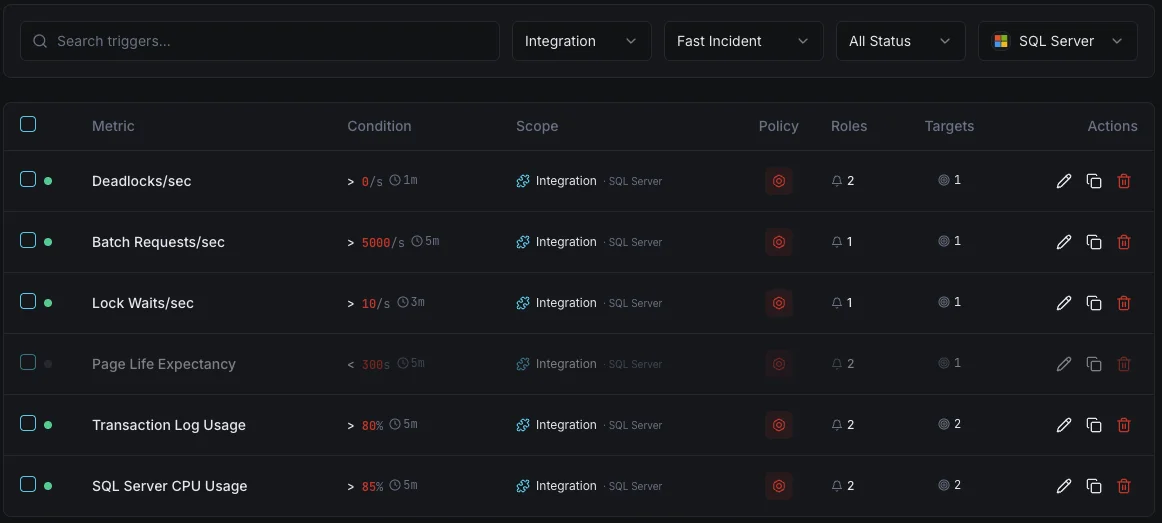
バッファキャッシュヒット率
重要なキャッシュヒット率が閾値を下回ったときに発動。ワークロードに対するメモリ不足を示します。
ページライフエクスペクタンシー
警告PLEが閾値を下回ったときに発動。ページがメモリから急速に追い出されていることを示します。
デッドロック
重要なデッドロックレートが閾値を超えたときにアラート。アプリケーションクエリでのロック競合を示します。
トランザクションログ使用量
重要なトランザクションログ使用量が閾値を超えたときに発動。書き込み失敗のリスクを示します。
ユーザー接続
警告接続数が上限に近づいたときに発動。connection refusedエラーのリスクを示します。
待機統計
警告特定の待機タイプが急増したときにアラート。リソースボトルネック(CPU、I/O、メモリ、ロック)を示します。
の重要性: MSSQL監視
SQL ServerはERPシステム、金融データベースからEコマースプラットフォームまで、ミッションクリティカルなエンタープライズワークロードを実行します。監視がないと、バッファ圧迫、デッドロック、トランザクションログ肥大化が障害やデータ破損を引き起こします。
- バッファキャッシュとPLEメトリクスを通じてメモリ圧迫を検出
- 速度低下の根本原因を特定するために待機統計を監視
- アプリケーションレベルのロック問題を解決するためにデッドロックを追跡
- 中断のない書き込み操作のためにトランザクションログ容量を確保
- 時間とともにクエリパフォーマンスを維持するためにインデックス使用を最適化
なぜ選ぶべきか: Xitoring
XitoringはゼロコンフィグでエンタープライズグレードのSQL Server監視を提供します。軽量エージェントがMSSQLインスタンスを自動検出し、60秒以内にメトリクス収集を開始、既存の通知チャネルと統合します。
- 簡単インストーラ付きWindows Serverのネイティブサポート
- 低遅延チェックのための15以上のグローバル監視ノード
- サーバー、データベース、稼働率を統合したダッシュボード
- Slack、PagerDuty、Telegramなどによる柔軟なアラート
- キャパシティプランニングと監査のための履歴データ保持
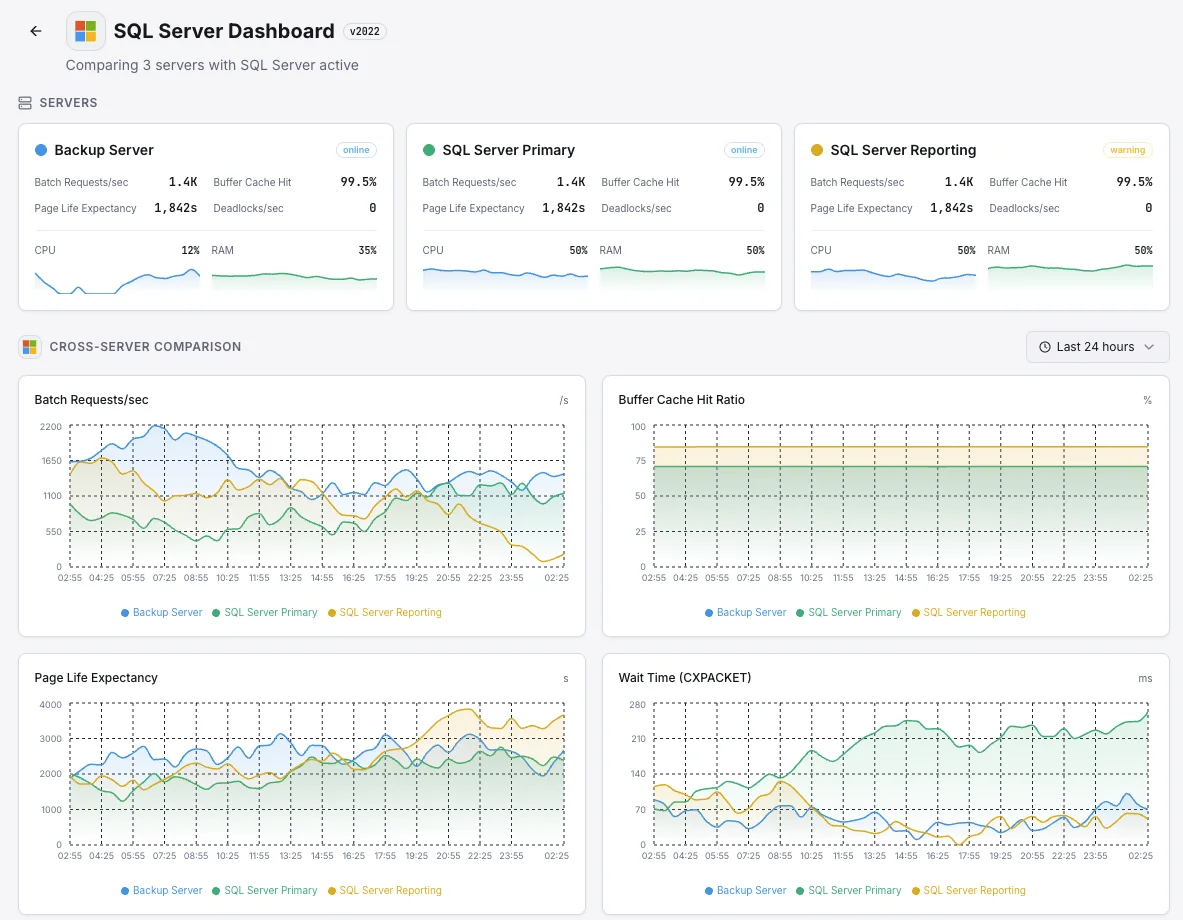
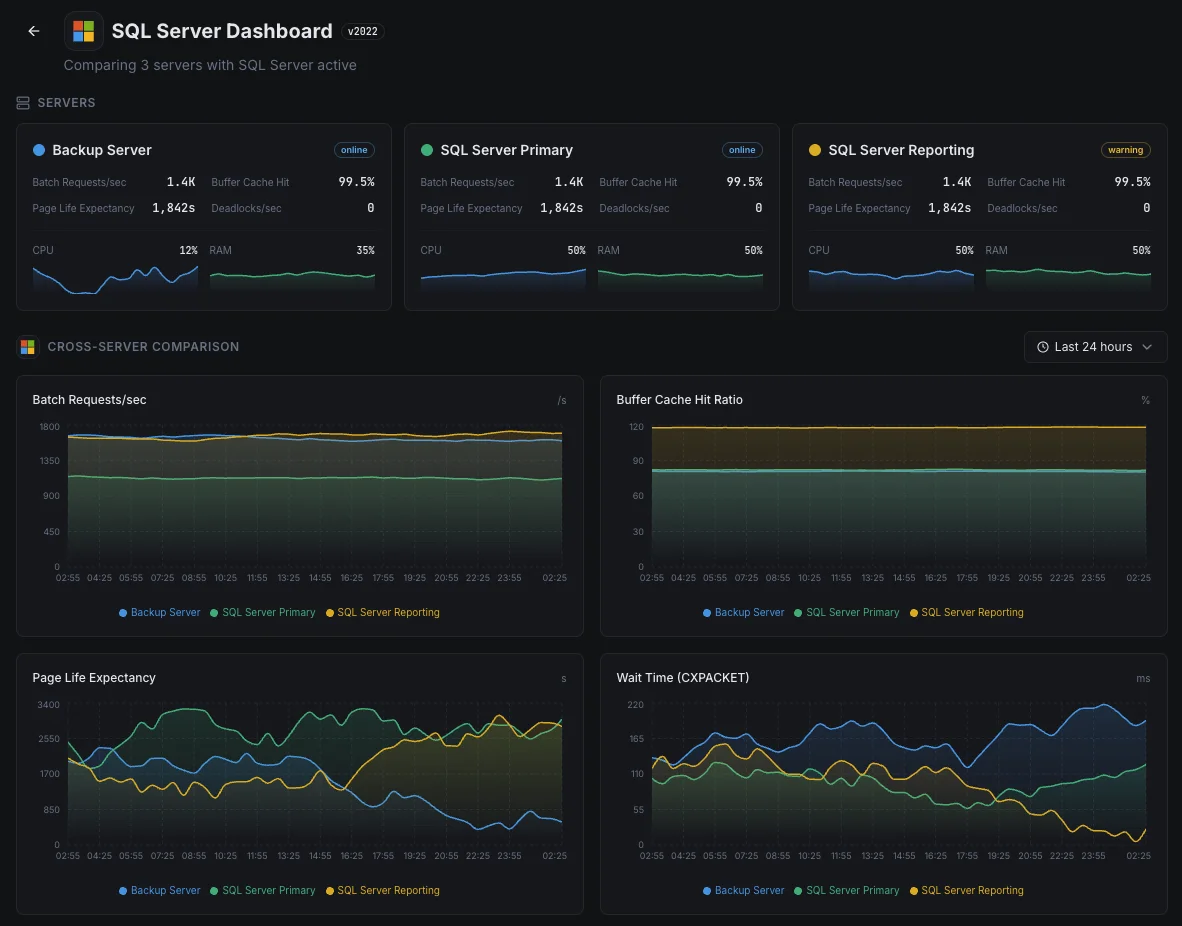
よくある SQL Server 監視 シナリオ
SQL Serverが今日一般的に実行されている場所 — そして誰も監視していない場合に何が問題になる可能性があるか。
ビジネスアプリとERPシステム
SQL Serverが財務、人事、営業などの重要なビジネスアプリを実行している場合、遅いデータベースは遅い会社になります。私たちはデータベースが苦戦し始めている兆候を示すシグナルを監視し、スタッフがIT部門に電話をかけ始める前にチームがそれを修正できるようにします。
災害復旧のためのバックアップデータベース
企業はデータベースの追加コピーを(多くの場合、別のリージョンで)実行し、単一の障害でビジネスがオフラインにならないようにします。これらのコピーが遅れをとると、復旧時に予想よりも多くのデータが失われる可能性があります。私たちはすべてのコピーを監視し、実際に必要となる日に災害復旧計画が機能するようにします。
クラウドまたはLinux上のSQL Server
SQL ServerがAzure、Linux、またはその中間で実行されているかどうかにかかわらず、プラットフォーム単独で得られる可視性では不十分なことがほとんどです。私たちはクエリの遅延やその他の内部的な問題を表面化させ、コストとパフォーマンスの両方を管理できるようにします。
MSSQL の 前提条件
これらが揃っていることを確認してください — 揃っていれば、ほとんどの導入は 60 秒で完了します。
- Microsoft SQL Server 2012 以上(size_on_disk_bytes メトリクスには 2022+ が必要)
- CONNECT ANY DATABASE、VIEW SERVER STATE、VIEW ANY DEFINITION、SELECT 権限を持つ SQL ログイン
- インスタンス上で TCP/IP が有効化され、ポートが Xitogent から到達可能であること
はじめに 議事録
Windows サーバーに Xitogent をインストール
SQL Server をホストしている Windows Server に Xitogent エージェントをダウンロードしてインストールしてください。
# Download from https://xitoring.com/xitogent
# Run the installer as AdministratorSQL Server へのアクセスを設定
最小限の権限を持つ監視用の専用ログインを作成します:
CREATE LOGIN xitoring WITH PASSWORD = 'your_password';
CREATE USER xitoring FOR LOGIN xitoring;
GRANT CONNECT ANY DATABASE TO xitoring;
GRANT VIEW SERVER STATE TO xitoring;
GRANT VIEW ANY DEFINITION TO xitoring;
GRANT SELECT TO xitoring;MSSQL 連携を有効化
Xitoring ダッシュボードまたは CLI から MSSQL 連携を有効化してください。
xitogent integrateアラートしきい値を設定(オプション)
バッファキャッシュヒット率、Page Life Expectancy、デッドロック数にカスタムしきい値を設定し、注意が必要なときに通知を受け取れるようにします。
動作確認
サーバー上でこのコマンドを実行して、Xitogent が連携を認識していることを確認してください。約 30 秒以内に新しいメトリクスがダッシュボードに流れ始めます。
sudo xitogent status代替ツールを 検討中ですか?
MSSQL 監視の代替ツールと比べて Xitoring がどう優れているかをご覧ください — 定額料金、より深い統合、そしてスタック全体をカバーする 1 つのエージェント。


頻繁に 質問をした
この統合機能は、Linux上のSQL Serverに対応していますか?
この統合はSQL Serverのパフォーマンスに影響を与えますか?
複数のインスタンスを監視することはできますか?
Azure SQL Database を監視することはできますか?
どのバージョンのSQL Serverがサポートされていますか?
指標はどのくらいの頻度で収集されますか?
SQL Server でデッドロックを検出する方法は?
SQL Server バックアップの健全性を監視する方法は?
サポートされている SQL Server バージョンは何ですか?
探検を続けよう