Elasticsearch Seguimiento
Supervisa el estado del clúster de Elasticsearch, las tasas de indexación, el uso del montón de la JVM y la latencia de búsqueda en tiempo real sin necesidad de configuración.
¿Por qué realizar un seguimiento? Elasticsearch?
Elasticsearch gestiona las funciones de búsqueda, registro y análisis de miles de organizaciones en todo el mundo. La supervisión de Elasticsearch es fundamental para mantener el buen estado del clúster, optimizar el rendimiento de la indexación, controlar la latencia de las búsquedas y evitar el agotamiento del montón de la JVM. La integración de Elasticsearch de Xitoring ofrece una visibilidad detallada de todos los aspectos de su clúster.
Monitoreo de Elasticsearch, explicado
El monitoreo de Elasticsearch detecta la degradación del clúster (estado amarillo / rojo), los shards sin asignar, la presión sobre el heap de la JVM, los picos de pausas del GC y los rechazos de los thread pools antes de que provoquen interrupciones de búsqueda, fallos de ingesta o pérdida de datos. Para pipelines de logs ELK, cargas de trabajo de búsqueda vectorial y cualquier clúster en producción, la visibilidad por nodo es lo que separa una autorecuperación de 30 segundos de una interrupción en todo el clúster. Xitoring detecta automáticamente su Elasticsearch, consulta las APIs nativas con un usuario cluster:monitor y envía las alertas a Slack, PagerDuty, Telegram o su sistema de guardias existente.
Lo que monitorizamos
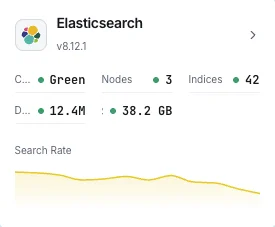
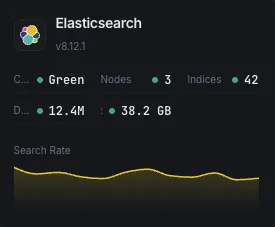
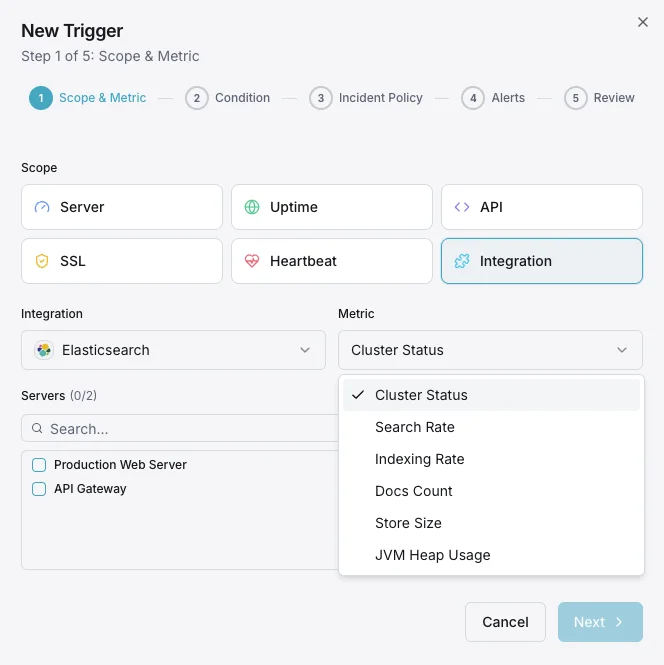
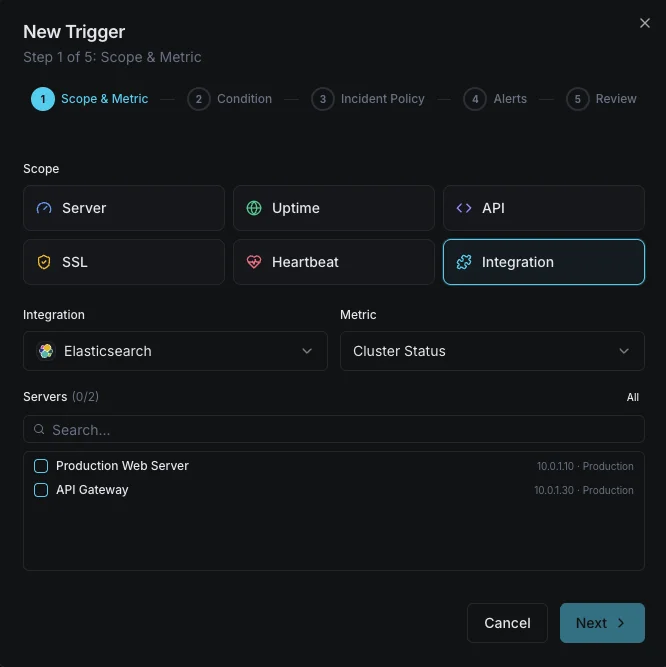
Salud del clúster
Estado global del clúster (verde/amarillo/rojo) y número de shards activos.
Uso de heap JVM
Heap usado, asignado y máximo en todos los nodos con estadísticas de GC.
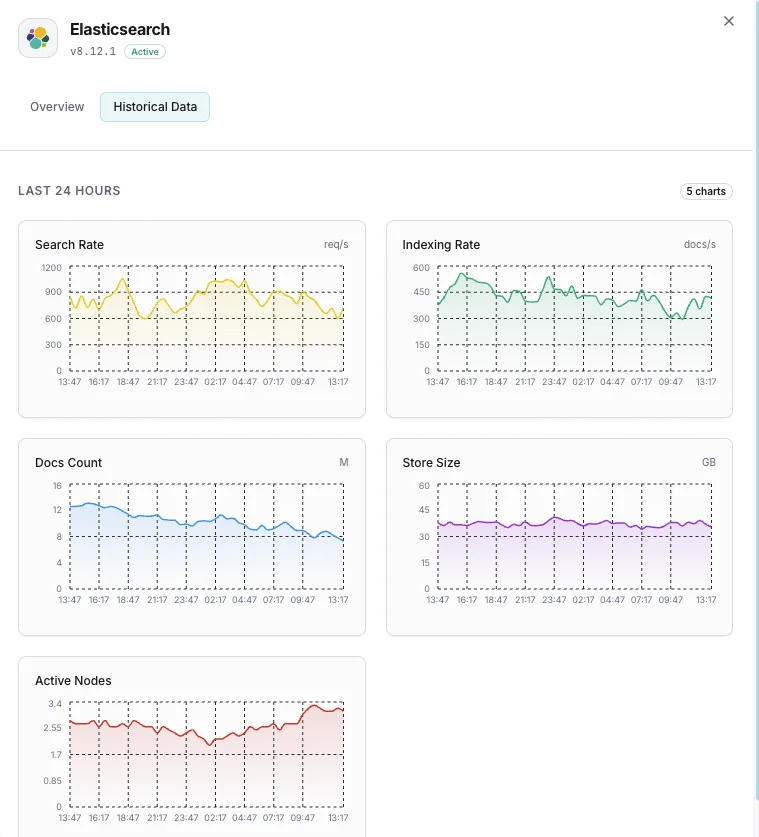
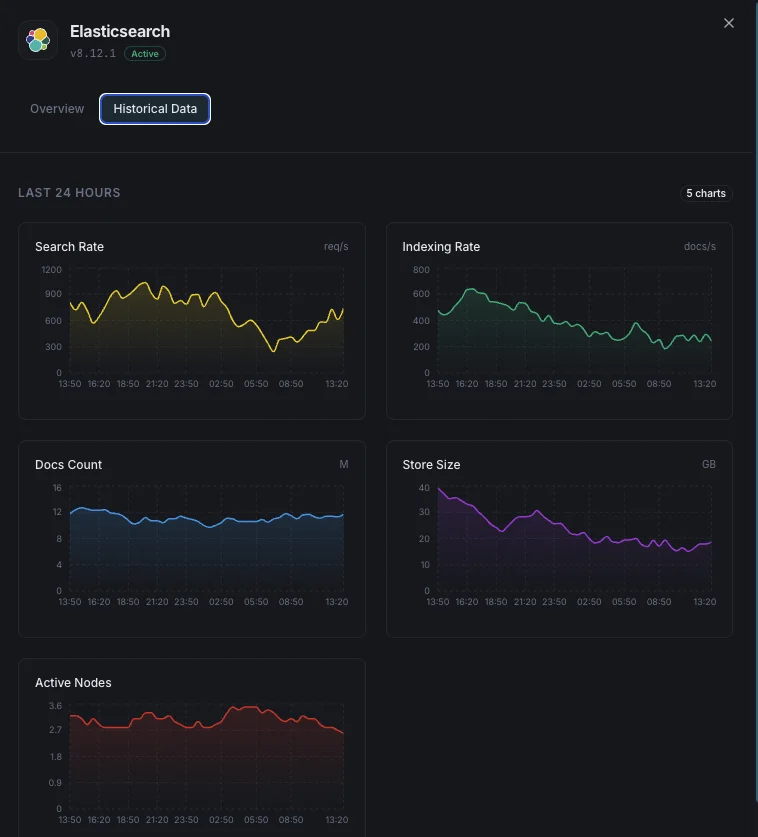
Tasa de indexación
Documentos indexados por segundo en todo el clúster.
Tasa de búsquedas
Consultas de búsqueda por segundo y latencia media de búsqueda.
Número de shards
Shards activos, reubicándose, inicializándose y no asignados.
Tareas pendientes
Tareas pendientes a nivel de clúster que pueden indicar cuellos de botella.
Uso de CPU
Uso de CPU por nodo y promedios de carga del SO.
Uso de disco
Almacenamiento usado por nodo y espacio disponible.
Pool de hilos
Tareas activas, en cola y rechazadas en cada pool de hilos.
Circuit breakers
Estimaciones de memoria y conteos de disparos para los breakers request/fielddata/in-flight.
Número de segmentos
Número de segmentos Lucene y actividad de fusión.
Caché fielddata
Tamaño de la caché fielddata y conteo de evicciones.
Configurables condiciones de activación de alertas
Configura alertas personalizadas en tu panel de control para recibir una notificación en cuanto las métricas de «Elasticsearch» superen los umbrales que hayas definido.
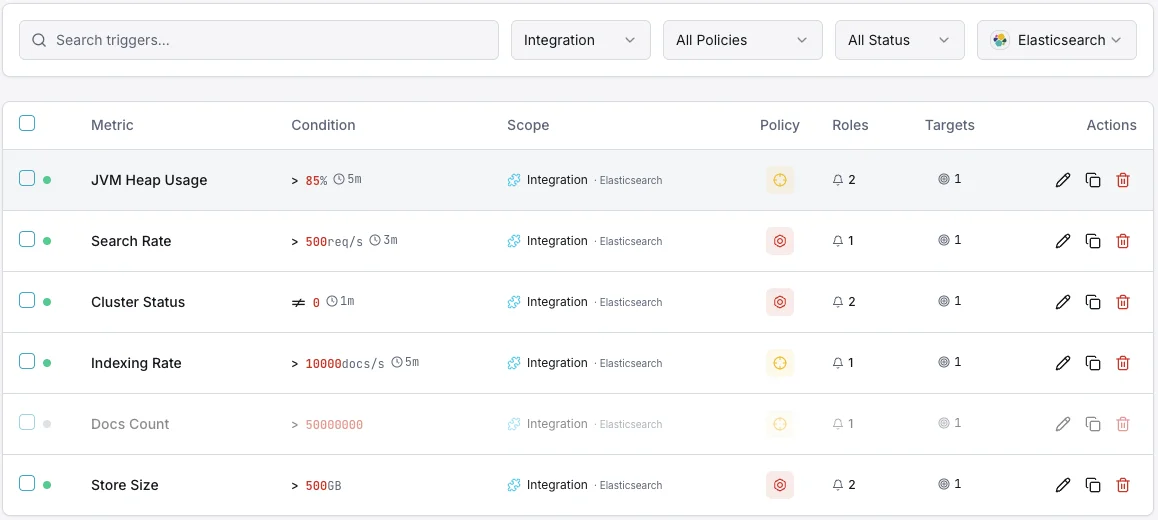
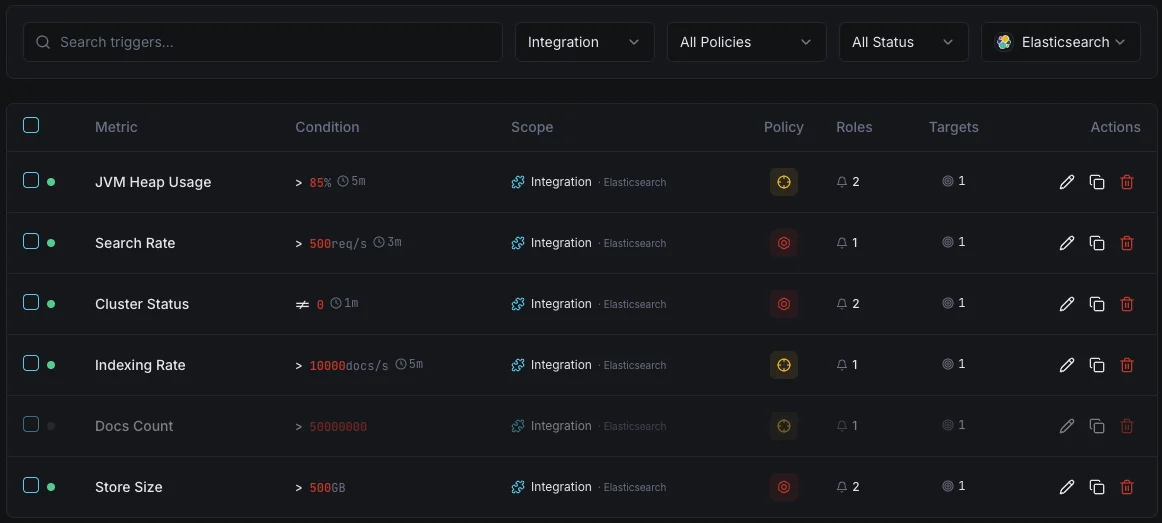
Salud del clúster
críticoSe dispara cuando el estado del clúster se degrada a amarillo o rojo, indicando problemas de asignación de shards.
Uso de heap JVM
críticoSe activa cuando el uso del heap JVM supera el umbral, con riesgo de errores out-of-memory e inestabilidad de nodos.
Tasa de indexación
advertenciaAlerta cuando el throughput de indexación cae por debajo de la línea base, indicando problemas en la pipeline de ingestión.
Latencia de búsqueda
advertenciaSe dispara cuando la latencia media de búsqueda supera el umbral, degradando la calidad de búsqueda para los usuarios.
Shards no asignados
críticoSe activa cuando los shards permanecen sin asignar, dejando datos subreplicados y en riesgo.
Rechazos del pool de hilos
advertenciaAlerta cuando las colas del pool de hilos se desbordan y empiezan a rechazar solicitudes.
Importancia de la monitorización de Elasticsearch
Elasticsearch sustenta la funcionalidad de búsqueda, la agregación de logs y la analítica en tiempo real. Sin monitorización, la degradación del clúster, la presión sobre la JVM y los shards no asignados pueden derivar en caídas de búsqueda y pérdida de datos.
- Detecte la degradación de salud del clúster antes de que afecte la disponibilidad de búsqueda
- Monitorice el heap JVM para evitar caídas por out-of-memory
- Realice un seguimiento del throughput de indexación para asegurar pipelines de ingestión saludables
- Identifique los shards no asignados que dejan los datos subreplicados
- Optimice la latencia de búsqueda para aplicaciones orientadas al usuario
Por qué elegir Xitoring
Xitoring ofrece monitorización de Elasticsearch de nivel empresarial con configuración zero-config. Nuestro agente ligero detecta automáticamente sus nodos Elasticsearch, empieza a recopilar métricas en menos de 60 segundos e se integra con sus canales de notificación existentes.
- Instalación con un solo comando: sin YAML complejo ni archivos de configuración
- Más de 15 nodos de monitorización globales para comprobaciones de baja latencia
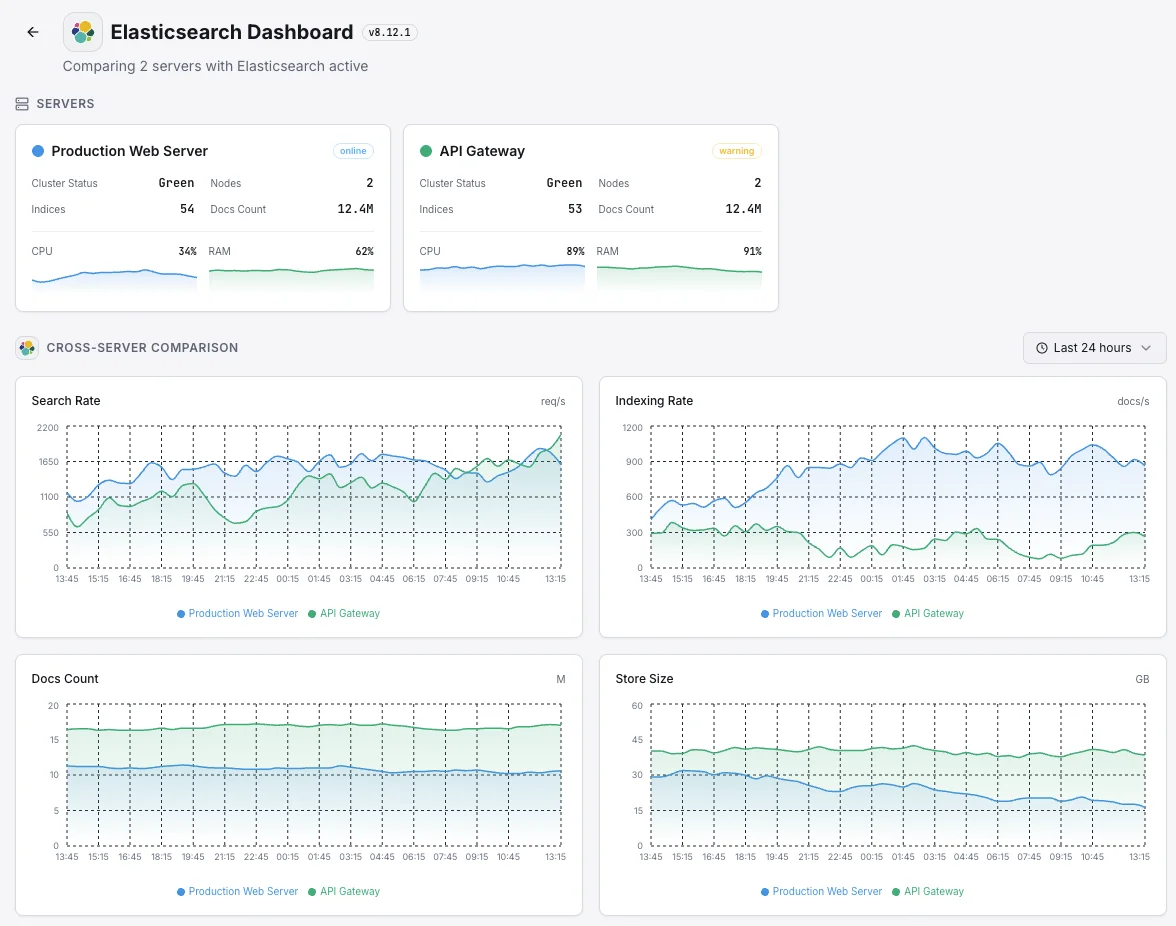
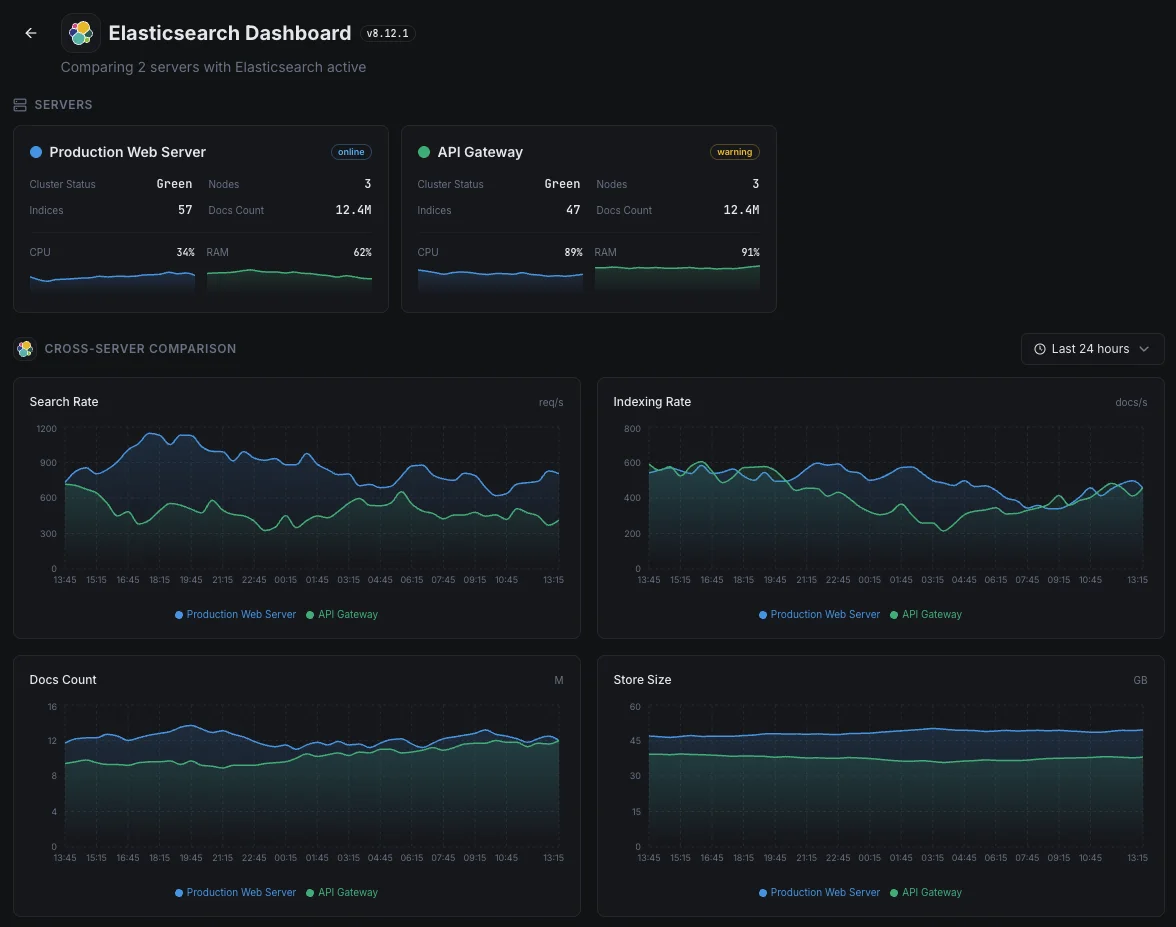
- Panel unificado para servidores, clústeres de búsqueda y uptime
- Alertas flexibles vía Slack, PagerDuty, Telegram y más
- Retención histórica para planificación de capacidad y auditorías
Escenarios habituales de monitoreo de Elasticsearch
Dónde suele ejecutarse Elasticsearch hoy en día — y qué podría salir mal si nadie está vigilando.
Registros y datos de observabilidad
Cuando las aplicaciones y los servidores transmiten sus registros a Elasticsearch, cualquier acumulación o rechazo significa que faltan partes de la imagen — exactamente cuando un incidente las hace más necesarias. Detectamos el cuello de botella mientras es pequeño, para que el historial de diagnóstico del equipo permanezca completo.
Búsqueda para sitios web, aplicaciones y funciones de IA
Cuando la búsqueda impulsa un sitio web, una aplicación o una función de IA, una consulta lenta perjudica directamente la experiencia del usuario y las conversiones. Vigilamos los tiempos de respuesta y la capacidad para que una ralentización de la búsqueda pueda solucionarse antes de que se convierta en un problema de ingresos o de producto.
Búsqueda gestionada en AWS u otra nube
Los proveedores de la nube ejecutan el servicio por ti, pero no te dicen cuándo tu propia carga de trabajo lo está abrumando o tus consultas están empezando a ralentizarse. Cerramos esa brecha de visibilidad para que tanto el costo como el rendimiento permanezcan bajo tu control.
Requisitos previos para Elasticsearch
Asegúrate de tener todo esto en su sitio — la mayoría de las instalaciones tardan 60 segundos una vez listo.
- Elasticsearch 7.x u 8.x accesible en su puerto REST (predeterminado 9200)
- Un usuario de monitorización con privilegios cluster:monitor si la seguridad está habilitada
- Configuración TLS/CA disponible para Xitogent si se requiere HTTPS
Empieza con minutos
Instalar Xitogent en tu servidor
Si aún no lo has hecho, instala el agente de monitorización ligero Xitogent en tu servidor.
curl -s https://xitoring.com/install.sh | sudo bash -s -- --key=YOUR_API_KEYVerificar la accesibilidad de la API de Elasticsearch
Xitogent utiliza la API REST de Elasticsearch para recolectar métricas. Verifica que el clúster es accesible:
curl -s http://localhost:9200/_cluster/health | python3 -m json.toolHabilitar la integración de Elasticsearch
Usa el panel de Xitoring o la CLI para habilitar la integración de Elasticsearch.
sudo xitogent integrateConfigurar umbrales de alerta (opcional)
Define umbrales personalizados para salud del clúster, heap de JVM o tasa de indexación para recibir notificaciones cuando algo requiera atención.
Verifica que funciona
Ejecuta este comando en el servidor para confirmar que Xitogent ha detectado la integración. En unos 30 segundos comenzarán a llegar métricas nuevas a tu panel.
sudo xitogent status¿Estás considerando alternativas?
Mira cómo se compara Xitoring frente a las alternativas para la supervisión de Elasticsearch: precios planos, integraciones más profundas y un solo agente que cubre todo tu stack.


Con frecuencia preguntas formuladas
¿La integración requiere autenticación?
¿Afectará esta integración al rendimiento de Elasticsearch?
¿Puedo supervisar clústeres de varios nodos?
¿Puedo supervisar OpenSearch?
¿Qué versiones de Elasticsearch son compatibles?
¿Con qué frecuencia se recopilan los datos?
¿Qué es un thread pool de búsqueda y cómo monitoreo los rechazos?
Monitoreo de Elasticsearch vs. OpenSearch: ¿qué cambia?
¿Qué versiones de Elasticsearch son compatibles?
Empieza a seguir a Elasticsearch hoy
Se configura en menos de 60 segundos. No se necesita tarjeta de crédito. Estadísticas completas desde el primer día.
Empieza tu prueba gratuitaSigue explorando