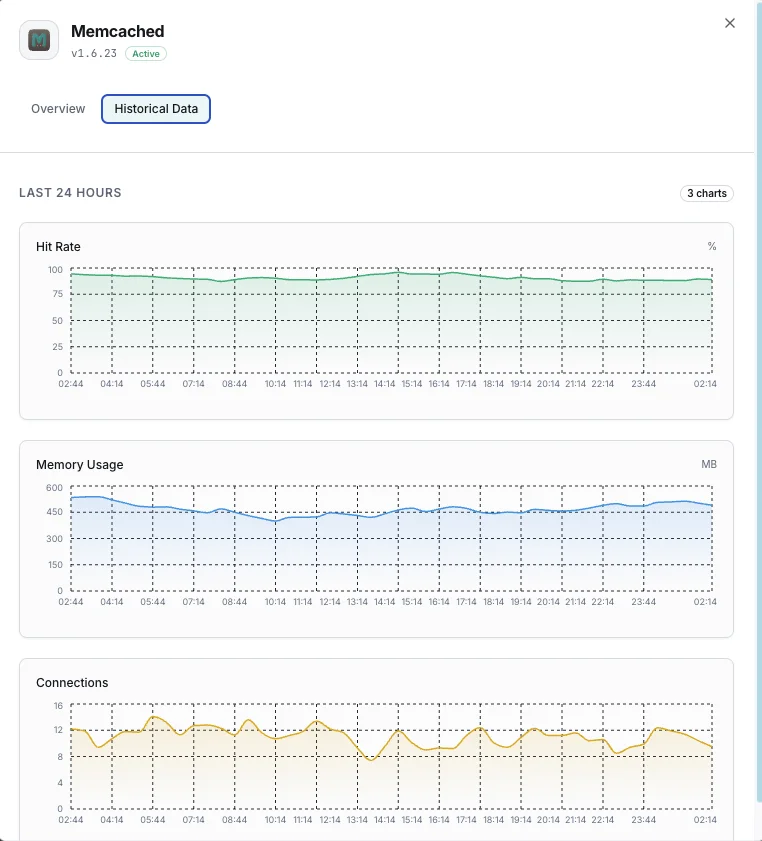
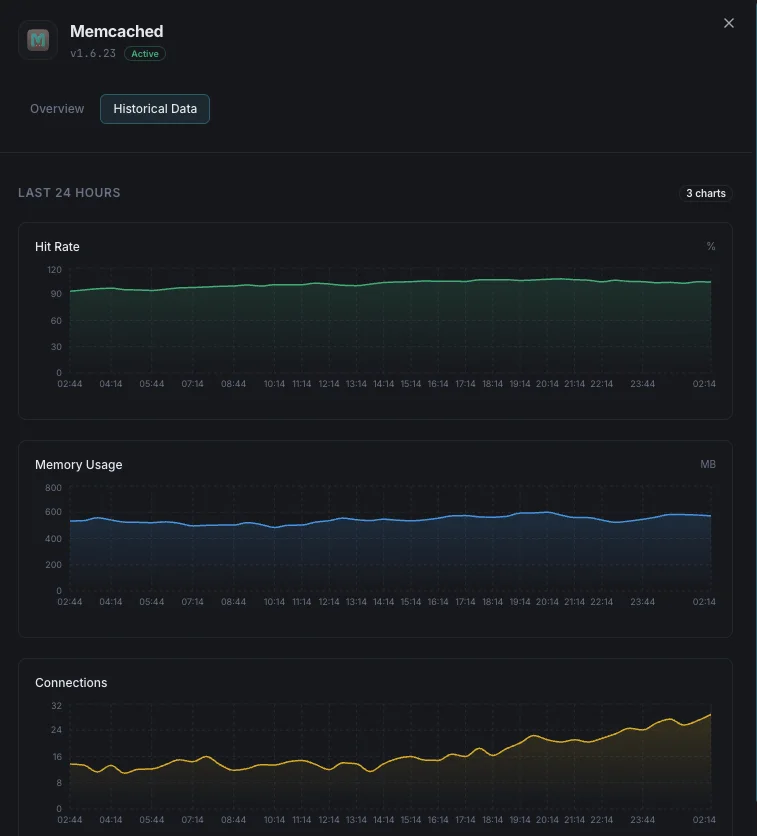
Memcached Seguimiento
Supervisa las conexiones de Memcached, las tasas de aciertos, el uso de memoria y las métricas de expulsión en tiempo real sin necesidad de configuración.
¿Por qué realizar un seguimiento? Memcached?
Memcached es un sistema de almacenamiento en caché de memoria distribuida de alto rendimiento que se utiliza para acelerar las aplicaciones web dinámicas al reducir la carga de la base de datos. La supervisión de Memcached garantiza un uso óptimo de la caché, detecta las «tormentas de expulsión» y evita el agotamiento de la memoria en toda la capa de almacenamiento en caché.
Monitoreo de Memcached, explicado
El monitoreo de Memcached detecta tormentas de evicción, presión de memoria, saturación de conexiones y caídas del hit ratio antes de que las peticiones sin caché saturen su base de datos. Para el object cache de WordPress, las sesiones PHP, el cacheo de resultados de consultas en Django/Rails y los despliegues de Memcached en AWS ElastiCache, la visibilidad por nodo es lo que diferencia una alerta en 60 segundos de encontrar su BD al 100 % de CPU a las 3 de la mañana. Xitoring detecta automáticamente su Memcached, lee stats cada minuto y enruta las alertas a Slack, PagerDuty, Telegram o su rotación de guardias existente.
Lo que monitorizamos
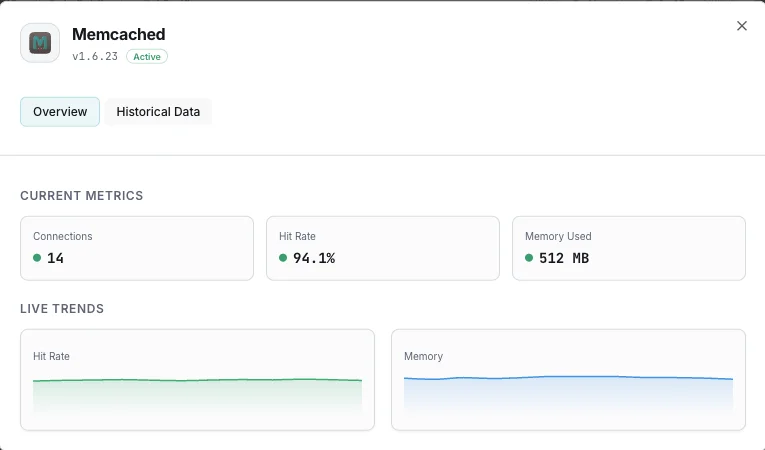
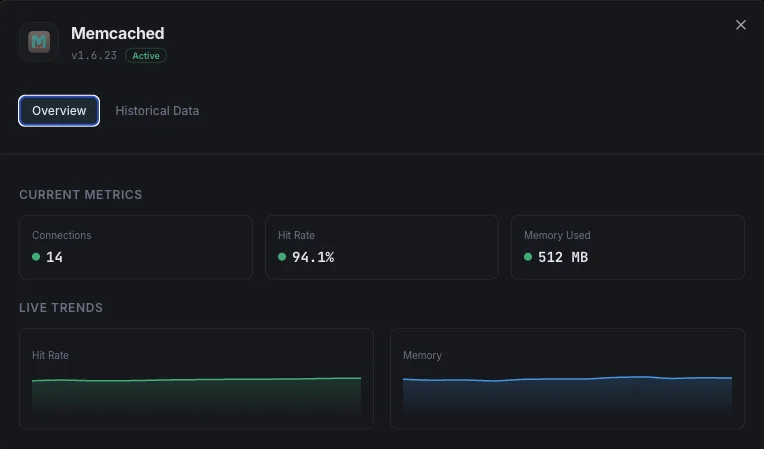
Memoria usada
Memoria total actualmente asignada para elementos cacheados.
Memoria máxima
Límite máximo de memoria configurado para la instancia Memcached.
Tasa de aciertos
Porcentaje de búsquedas exitosas en caché frente a fallos, indicando la efectividad de la caché.
Evicciones
Número de elementos expulsados para dejar espacio a nuevos datos.
Conexiones actuales
Número de conexiones de cliente actualmente abiertas.
Elementos almacenados
Número total de elementos actualmente almacenados en caché.
Ratio Get/Set
Ratio de comandos get frente a set, indicando el equilibrio lectura/escritura.
Bytes leídos/escritos
Throughput de red total para la instancia Memcached.
CAS Hits/Misses
Tasas de éxito de operaciones check-and-set para actualizaciones concurrentes.
Utilización de slabs
Eficiencia de asignación de memoria entre clases de slab.
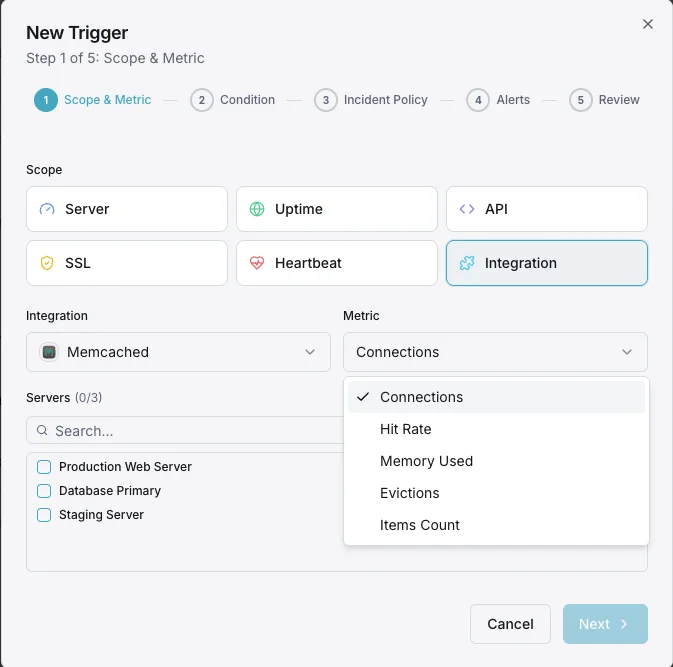
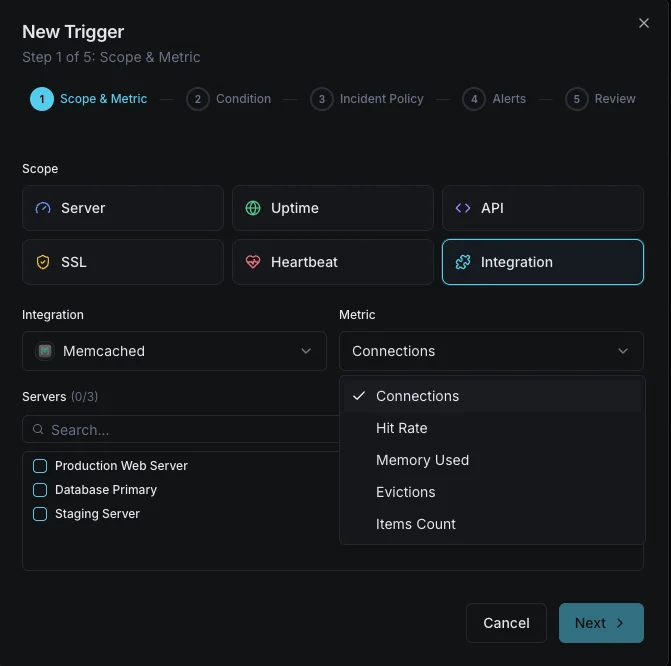
Configurables condiciones de activación de alertas
Configura alertas personalizadas en tu panel de control para recibir una notificación en cuanto las métricas de «Memcached» superen los umbrales que hayas definido.
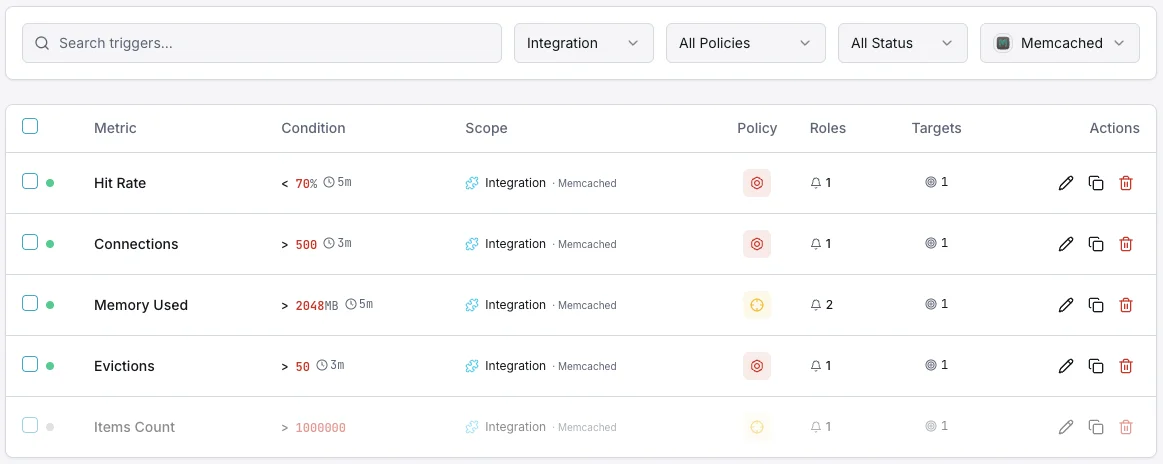
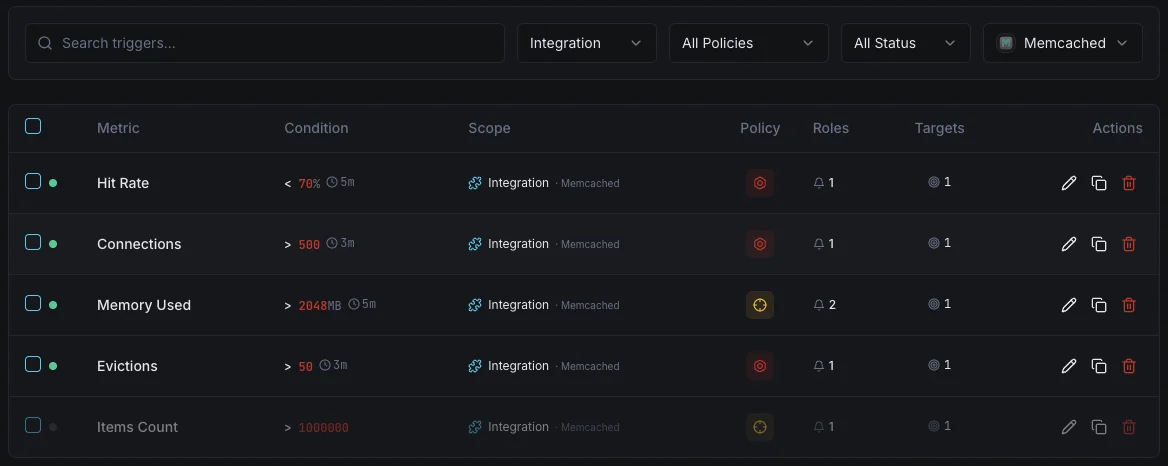
Uso de memoria
críticoSe dispara cuando el consumo de memoria de Memcached se acerca al límite configurado, con riesgo de evicciones.
Caída de la tasa de aciertos
advertenciaAlerta cuando la tasa de aciertos cae por debajo del umbral, indicando ineficiencia de caché o cambios de working set.
Tasa de eviction
críticoSe dispara cuando la tasa de eviction se dispara, lo que significa que Memcached está eliminando activamente datos para mantenerse dentro de los límites de memoria.
Número de conexiones
advertenciaSe activa cuando las conexiones de cliente superan el umbral, indicando posibles fugas de conexión.
Elementos reclamados
advertenciaAlerta cuando los elementos expirados se reclaman a un ritmo elevado, sugiriendo configuración errónea de TTL.
Importancia de la monitorización de Memcached
Memcached impulsa silenciosamente la capa de rendimiento de su aplicación. Sin monitorización, el agotamiento de memoria, las tormentas de evicciones y las fugas de conexión pueden degradar toda su pila de aplicaciones antes de que nadie lo note.
- Detecte la presión de memoria antes de que las evicciones afecten el rendimiento de la aplicación
- Monitorice las tasas de aciertos de caché para asegurar tiempos de respuesta óptimos
- Realice un seguimiento de los patrones de eviction para dimensionar correctamente la asignación de memoria
- Identifique fugas de conexión provenientes de clientes de aplicación
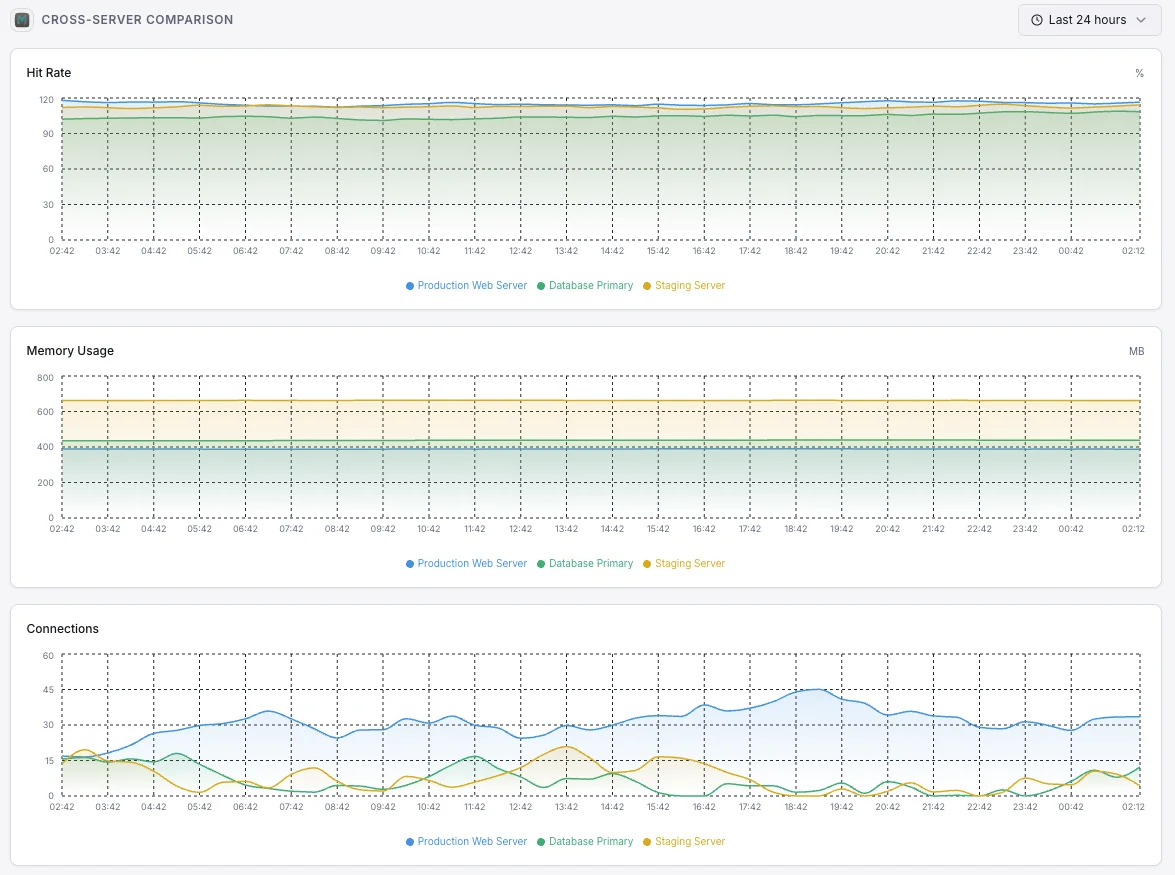
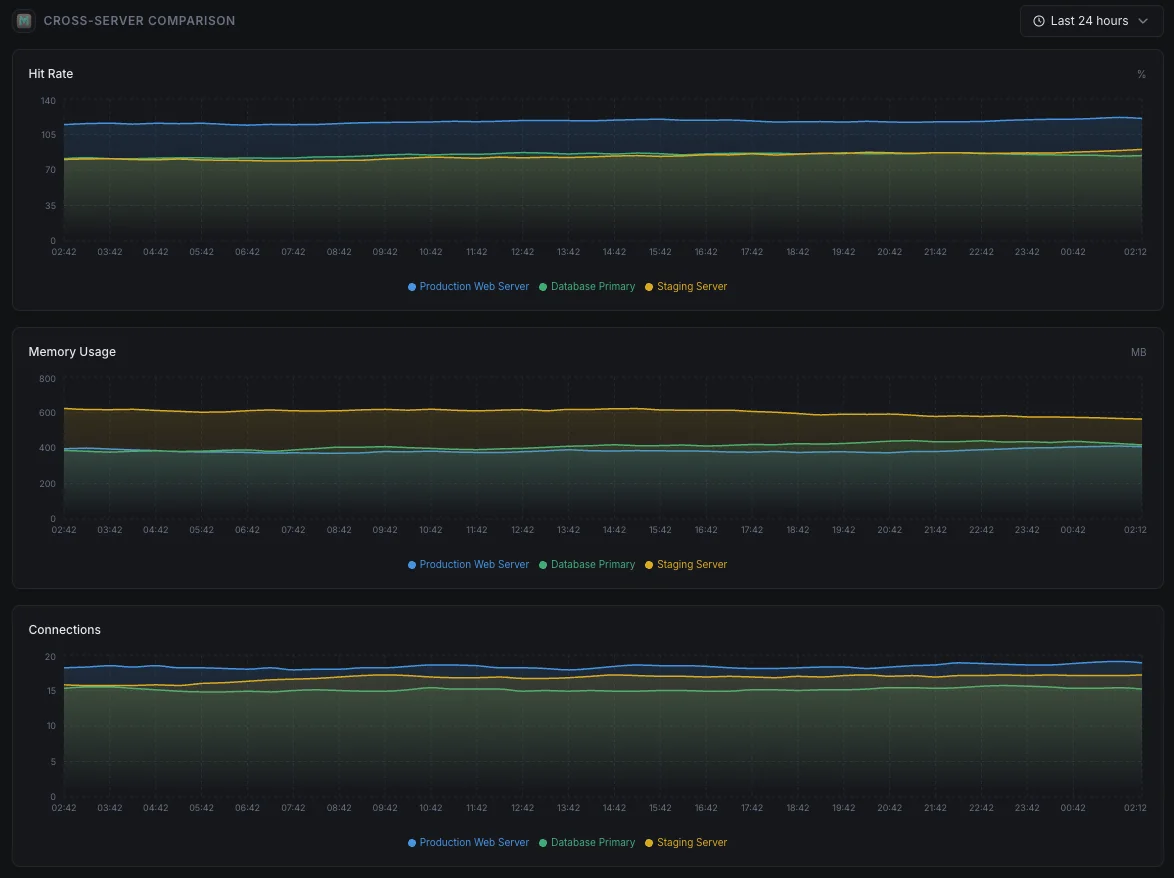
- Garantice un rendimiento de caché constante en nodos distribuidos
Por qué elegir Xitoring
Xitoring ofrece monitorización de Memcached de nivel empresarial con configuración zero-config. Nuestro agente ligero detecta automáticamente sus instancias Memcached, empieza a recopilar métricas en menos de 60 segundos e se integra con sus canales de notificación existentes.
- Instalación con un solo comando: sin YAML complejo ni archivos de configuración
- Más de 15 nodos de monitorización globales para comprobaciones de baja latencia
- Panel unificado para servidores, cachés y uptime
- Alertas flexibles vía Slack, PagerDuty, Telegram y más
- Retención histórica para planificación de capacidad y auditorías
Monitoreo común de Memcached escenarios
Dónde suele ejecutarse Memcached hoy en día, y qué podría salir mal si nadie está vigilando.
Acelerando sitios de WordPress y PHP
Memcached mantiene rápidos los sitios de WordPress y PHP al recordar los resultados de trabajos repetidos. Cuando la caché deja de ser efectiva, el sitio se ralentiza silenciosamente bajo carga. Lo detectamos a tiempo para que los visitantes y las conversiones no se vean afectados en silencio.
Acelerando aplicaciones web y APIs
Las aplicaciones web colocan sus resultados más costosos en la caché para no tener que computarlos en cada solicitud. Cuando la caché se llena o empieza a saturarse, el trabajo original vuelve a inundar la base de datos. Capturamos el momento en que la caché deja de proteger tu aplicación para que el equipo pueda intervenir antes de que los usuarios lo noten.
Caché gestionada ejecutándose en la nube
Los proveedores de la nube gestionan los servidores, pero no te dicen cuándo tu propio uso de la caché se está volviendo ineficiente — agotando la memoria, alcanzando límites de conexión o expulsando datos útiles. Cerramos esa brecha para que mantengas el control del coste y el rendimiento.
Requisitos previos para Memcached
Asegúrate de tener todo esto en su sitio — la mayoría de las instalaciones tardan 60 segundos una vez listo.
- Memcached ejecutándose en su puerto configurado (predeterminado 11211)
- Conectividad de red desde Xitogent hacia la instancia Memcached
- Comando stats accesible (no se requiere AUTH por defecto)
Empieza con minutos
Instalar Xitogent en tu servidor
Si aún no lo has hecho, instala el agente de monitorización ligero Xitogent en tu servidor.
curl -s https://xitoring.com/install.sh | sudo bash -s -- --key=YOUR_API_KEYAsegurar que las stats de Memcached son accesibles
Xitogent usa el comando stats de Memcached para recolectar métricas. Verifica que tu instancia es accesible localmente:
echo 'stats' | nc localhost 11211 | head -10Habilitar la integración de Memcached
Usa el panel de Xitoring o la CLI para habilitar la integración de Memcached. Xitogent detectará automáticamente tu instancia.
sudo xitogent integrateConfigurar umbrales de alerta (opcional)
Define umbrales personalizados para métricas como uso de memoria, tasa de aciertos o número de evictions para recibir notificaciones cuando algo requiera atención.
Verifica que funciona
Ejecuta este comando en el servidor para confirmar que Xitogent ha detectado la integración. En unos 30 segundos comenzarán a llegar métricas nuevas a tu panel.
sudo xitogent status¿Estás considerando alternativas?
Mira cómo se compara Xitoring frente a las alternativas para la supervisión de Memcached: precios planos, integraciones más profundas y un solo agente que cubre todo tu stack.


Con frecuencia preguntas formuladas
¿La integración con Memcached requiere autenticación?
¿Afectará esta integración al rendimiento de Memcached?
¿Puedo supervisar varias instancias de Memcached?
¿Qué versiones de Memcached son compatibles?
¿Con qué frecuencia se recopilan los datos?
Memcached frente a Redis: ¿cuál elegir?
¿Cómo ejecuto `stats` contra Memcached?
¿Cómo monitorizo un clúster de Memcached?
¿Qué versiones de Memcached son compatibles?
Empieza a seguir a Memcached hoy
Se configura en menos de 60 segundos. No se necesita tarjeta de crédito. Estadísticas completas desde el primer día.
Empieza tu prueba gratuita