Varnish Seguimiento
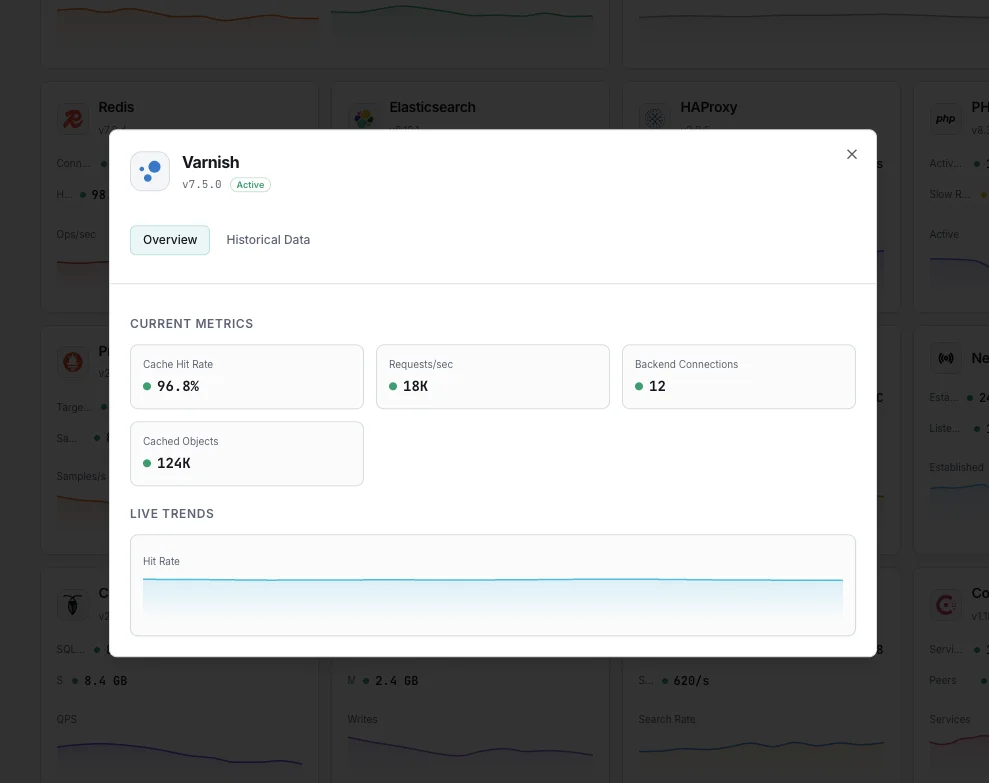
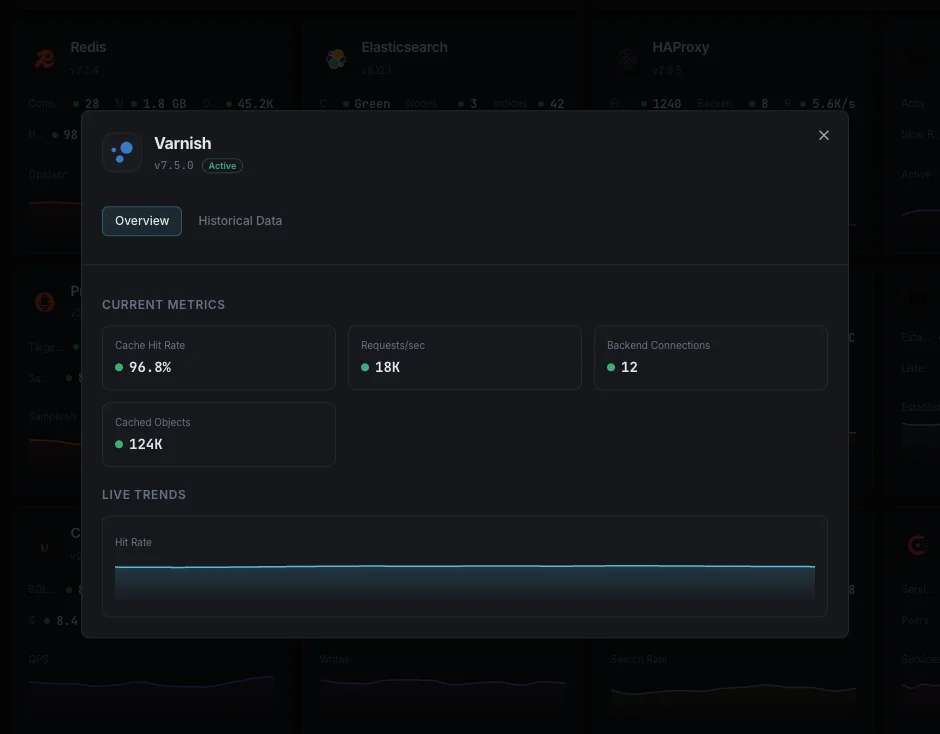
Supervisa en tiempo real los índices de aciertos de la caché de Varnish, el estado del backend, el almacenamiento de objetos y el rendimiento de las solicitudes sin necesidad de configuración.
¿Por qué realizar un seguimiento? Varnish?
Varnish Cache es un potente acelerador HTTP que se utiliza para acelerar considerablemente las aplicaciones web. La supervisión de Varnish es fundamental para garantizar altos índices de aciertos en la caché, detectar fallos en el backend, realizar un seguimiento de las eliminaciones de objetos y mantener un rendimiento óptimo en la distribución de contenidos.
Monitoreo de Varnish, explicado
El monitoreo de Varnish detecta caídas en el ratio de aciertos de caché, fallos en la salud del backend y agotamiento del pool de hilos antes de que se conviertan en latencia visible para el usuario o interrupciones. Como Varnish suele situarse frente a WordPress, Magento o su capa de origen, un problema de Varnish suele ser un problema para todo el sitio — monitorearlo bien significa detectar la mayoría de los incidentes de la capa de caché en su primer minuto. Xitoring detecta automáticamente su Varnish, lee desde varnishstat y enruta las alertas a Slack, PagerDuty, Telegram o su rotación de guardia existente.
Lo que monitorizamos
Ratio de aciertos de caché
Porcentaje de solicitudes servidas desde caché.
Salud del backend
Estado de salud de los servidores de origen.
Evicciones de objetos
Tasa de objetos expulsados del caché.
Solicitudes/s
Throughput total de solicitudes.
Uso del pool de hilos
Hilos activos frente a disponibles.
Conexiones backend
Conexiones a los servidores de origen.
Tamaño del caché
Uso actual del almacenamiento de objetos en caché.
Longitud de la lista de bans
Número de bans de caché activos.
MAIN.n_object
Objetos actualmente en caché. Se rastrea junto con `n_objectcore`/`n_objecthead` para conocer la sobrecarga de objetos al ajustar la caché.
SMA.s0.g_bytes / g_space
Almacenamiento en uso frente al disponible para el backend de almacenamiento por defecto. Cuando `g_bytes / (g_bytes + g_space)` se acerca al 100%, Varnish empieza a desalojar.
MAIN.s_pipe / s_pass
Peticiones piped (túnel TCP) vs pasadas (directamente al origen, sin cacheo). Tasas altas de `s_pass` suelen revelar reglas VCL `return(pass)` que deberían ser `return(hash)`.
Longitud de la ban list
Bans VCL activos aún no desalojados. Una ban list creciente ralentiza las búsquedas en caché — debería converger a casi cero a medida que el hilo ban-lurker desaloja los objetos baneados.
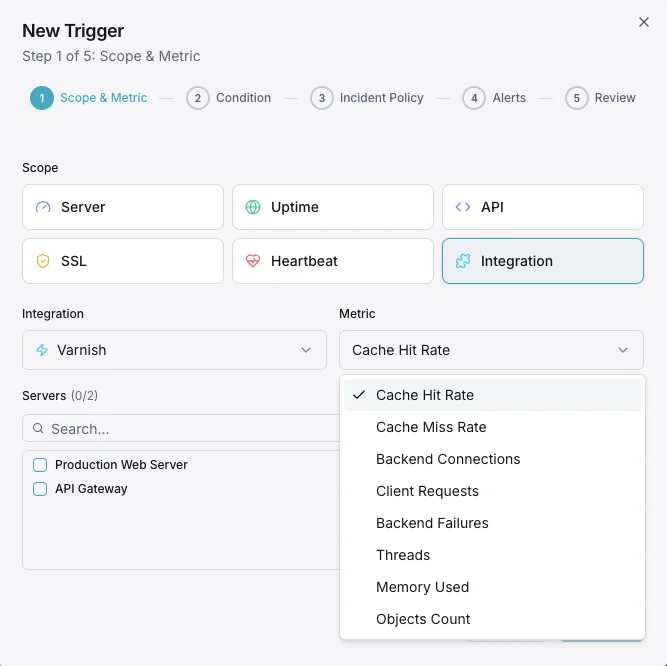
Configurables condiciones de activación de alertas
Configura alertas personalizadas en tu panel de control para recibir una notificación en cuanto las métricas de «Varnish» superen los umbrales que hayas definido.
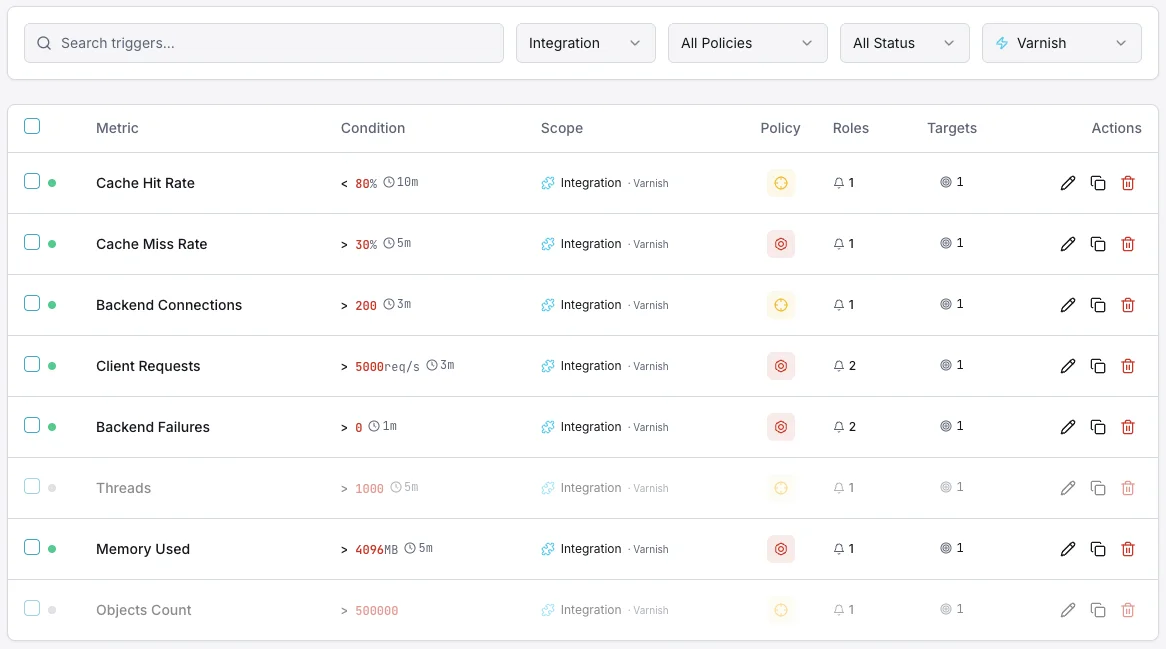
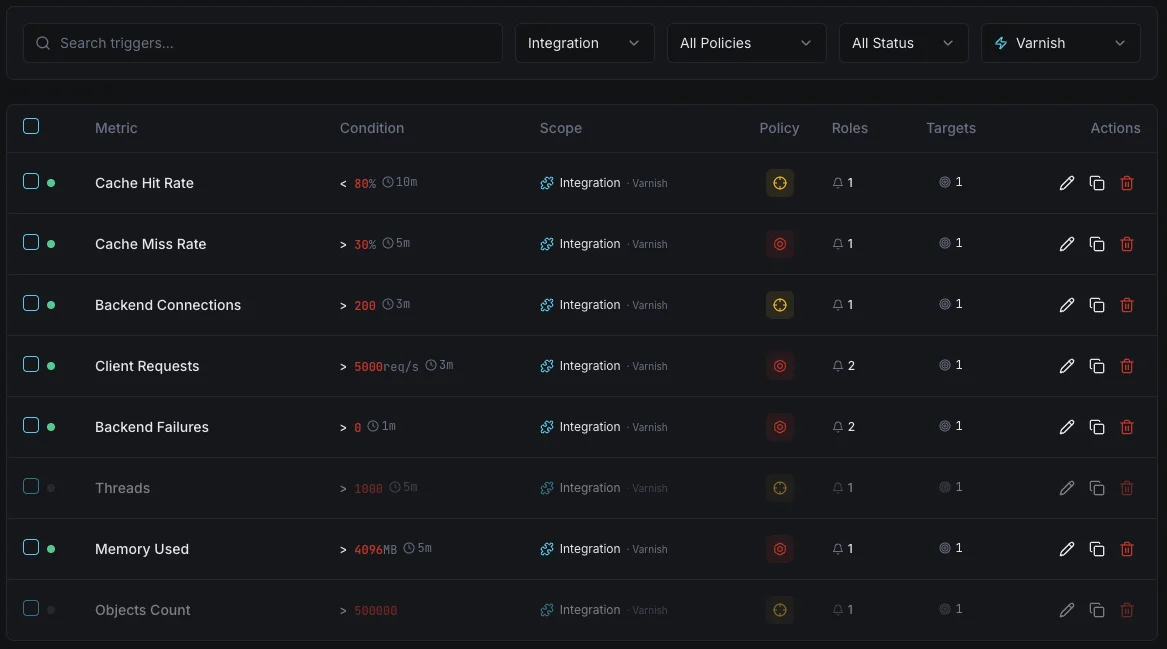
Ratio de aciertos de caché
advertenciaSe dispara cuando el ratio de aciertos cae por debajo del umbral.
Backend caído
críticoAlerta cuando un servidor backend falla las health checks.
Evicciones de objetos
advertenciaSe activa ante una alta tasa de evicciones que indica presión sobre la caché.
Pool de hilos
críticoSe dispara cuando el pool de hilos se agota.
Tasa de solicitudes
advertenciaAlerta ante un throughput de solicitudes inusual.
Importancia de la monitorización de Varnish
Varnish Cache puede servir contenido 300 veces más rápido que los servidores de origen. Sin monitorización, los cache miss y los fallos de backend anulan estas ventajas.
- Mantenga ratios de aciertos de caché altos para una velocidad óptima
- Detecte inmediatamente los fallos de los backends
- Realice un seguimiento de las evicciones para dimensionar correctamente el almacenamiento de caché
- Monitorice los pools de hilos para evitar pérdidas de solicitudes
Por qué elegir Xitoring
Monitorización Varnish de nivel empresarial con configuración zero-config.
- Instalación con un solo comando
- Más de 15 nodos de monitorización globales
- Panel unificado
- Alertas multicanal
- Retención de datos históricos

Escenarios habituales de monitoreo de Varnish
Dónde suele ejecutarse Varnish hoy en día, y qué podría salir mal si nadie está vigilando.
Acelerar WordPress y sitios de contenido
Varnish mantiene los sitios de contenido cargando casi instantáneamente al recordar las páginas terminadas. Cuando ese efecto deja de funcionar, el sitio se ralentiza silenciosamente y las clasificaciones de búsqueda comienzan a caer. Detectamos la caída en el momento en que comienza para que el tráfico y el SEO no se vean afectados silenciosamente.
Tiendas online en el momento del pago
Las tiendas en línea necesitan mantenerse rápidas durante los momentos exactos en que los clientes están comprando, incluso cuando el tráfico se dispara. Observamos las señales que muestran si la tienda puede absorber una avalancha, para que las promociones y ventas no se conviertan en ingresos perdidos.
Almacenamiento en caché para APIs y microservicios
Cuando Varnish almacena en caché los resultados de una API interna, evita que las aplicaciones subyacentes se vean abrumadas por solicitudes repetidas. Observamos el momento en que comienza a tener dificultades bajo una carga de ráfaga para que la capacidad pueda aumentarse antes de que las aplicaciones detrás de ella comiencen a fallar.
Requisitos previos para Varnish
Asegúrate de tener todo esto en su sitio — la mayoría de las instalaciones tardan 60 segundos una vez listo.
- Varnish Cache 6.x o más reciente
- Binario varnishstat disponible en el PATH del sistema
- Acceso de lectura al log de memoria compartida de Varnish (/var/lib/varnish — concedido por defecto a root)
Empieza con minutos
Instalar Xitogent en tu host Varnish
Instala el agente de monitorización ligero Xitogent en el host que ejecuta Varnish Cache. Xitogent corre como root, por lo que puede leer la memoria compartida de Varnish directamente sin necesidad de pertenencia a grupos adicionales.
curl -s https://xitoring.com/install.sh | sudo bash -s -- --key=YOUR_API_KEYVerificar la disponibilidad de varnishstat
Confirma que el binario `varnishstat` está en el PATH y devuelve contadores. Ejecuta `varnishstat -1` en el host — deberías ver un snapshot de métricas de caché, backends y sesiones.
varnishstat -1Habilitar la integración de Varnish
Ejecuta `sudo xitogent integrate` y selecciona Varnish. Xitogent prueba la conexión y detecta automáticamente tu instancia de Varnish y los backends configurados — el resto se configura automáticamente.
sudo xitogent integrateConfigurar umbrales de alerta (opcional)
Define umbrales personalizados para ratio de aciertos de caché, eventos Backend Down o evictions de objetos para detectar regresiones de caché y problemas de capacidad antes de que los usuarios vean respuestas no cacheadas.
Verifica que funciona
Ejecuta este comando en el servidor para confirmar que Xitogent ha detectado la integración. En unos 30 segundos comenzarán a llegar métricas nuevas a tu panel.
sudo xitogent status¿Estás considerando alternativas?
Mira cómo se compara Xitoring frente a las alternativas para la supervisión de Varnish: precios planos, integraciones más profundas y un solo agente que cubre todo tu stack.


Con frecuencia preguntas formuladas
¿Qué versiones de Varnish son compatibles?
¿Utiliza esto varnishstat?
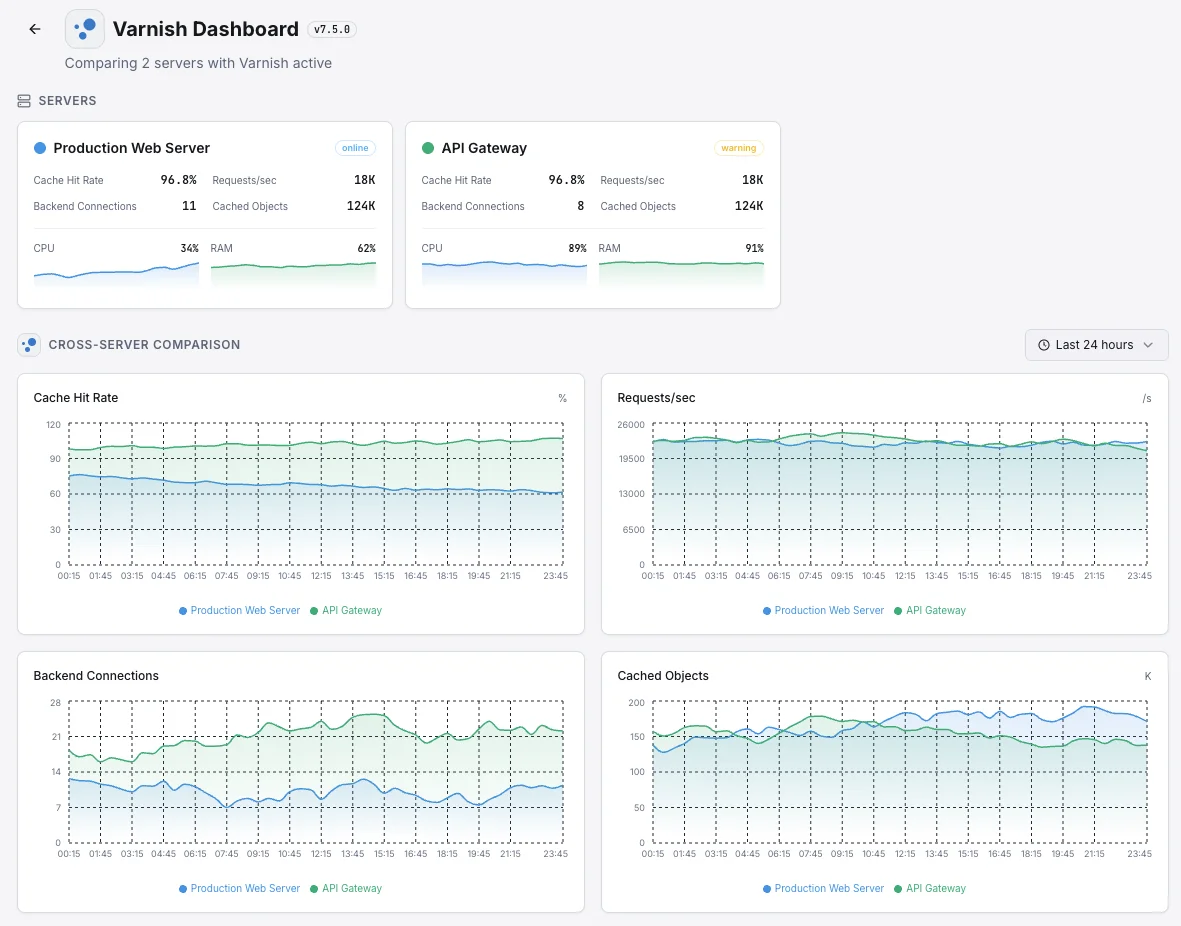
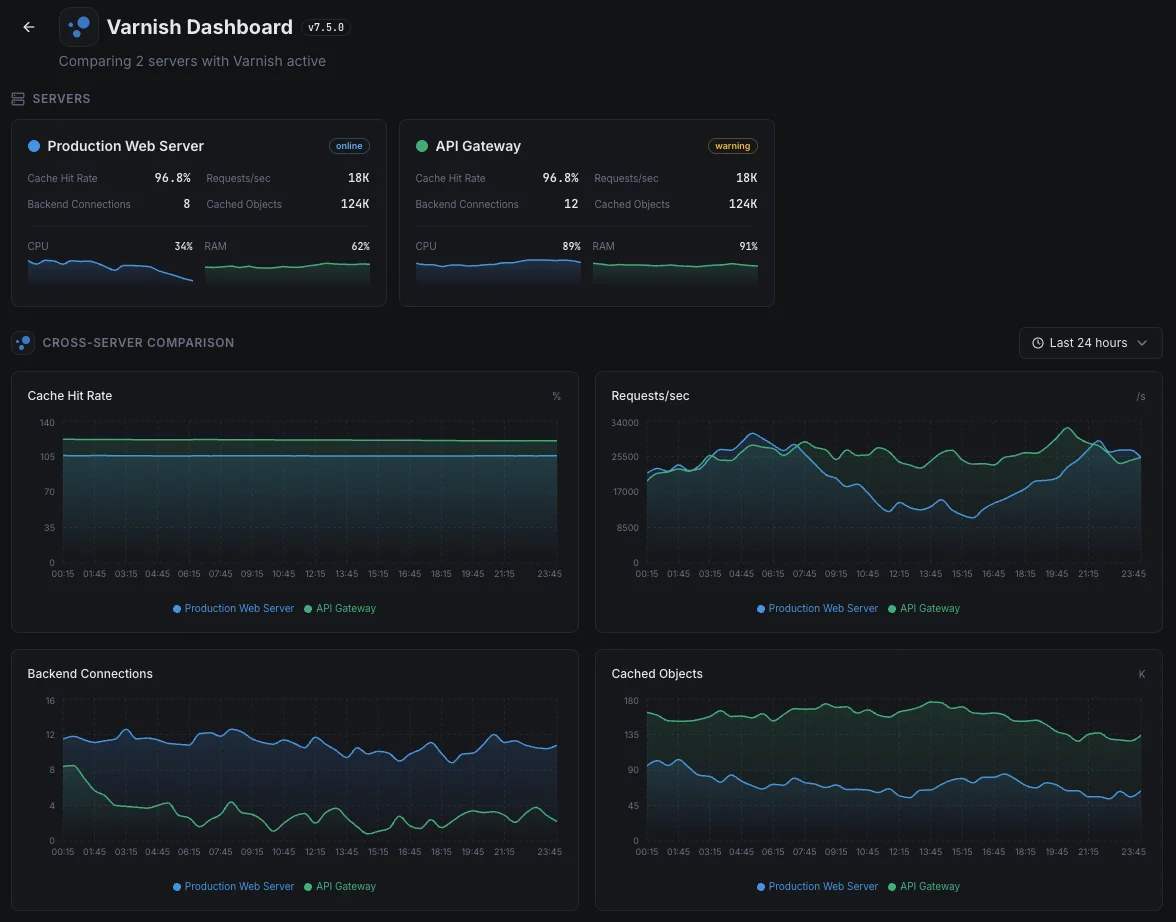
¿Puedo supervisar varias instancias de Varnish?
¿Cuánto cuesta cada servidor Varnish Cache?
¿Cuánto tiempo se tarda en configurar la monitorización de Varnish Cache?
¿Cómo monitorizo un servidor Varnish de forma gratuita?
¿Qué tipo de alertas recibo para la monitorización de Varnish Cache?
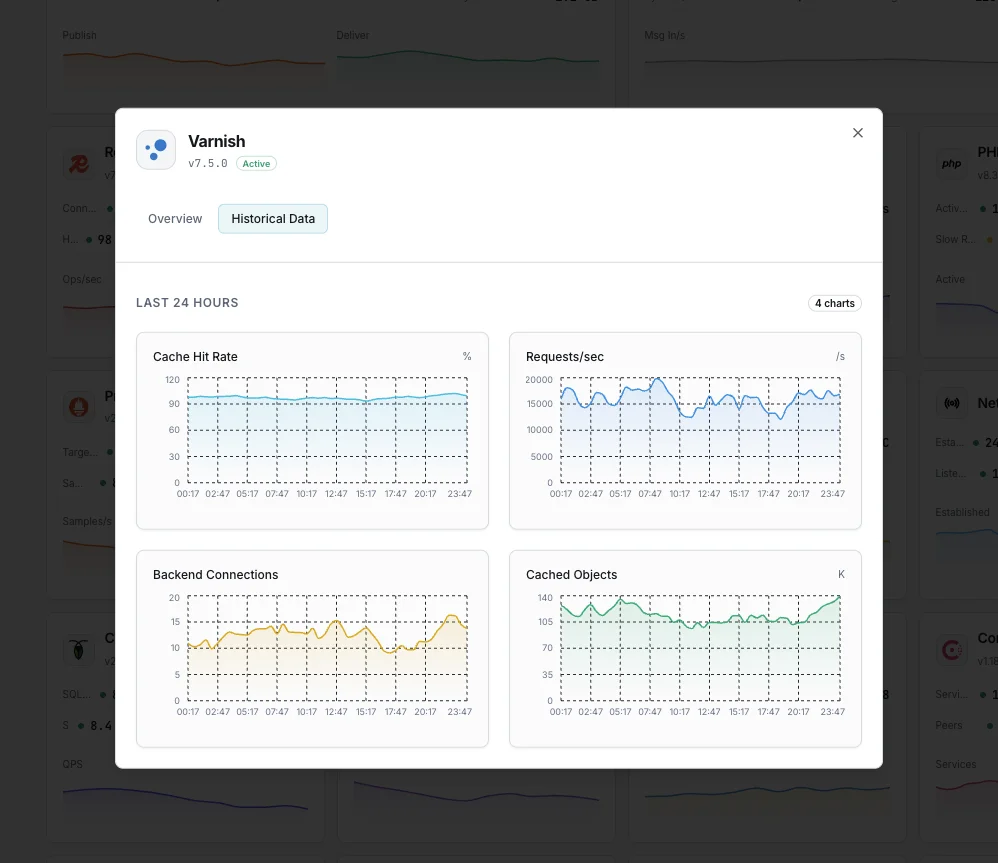
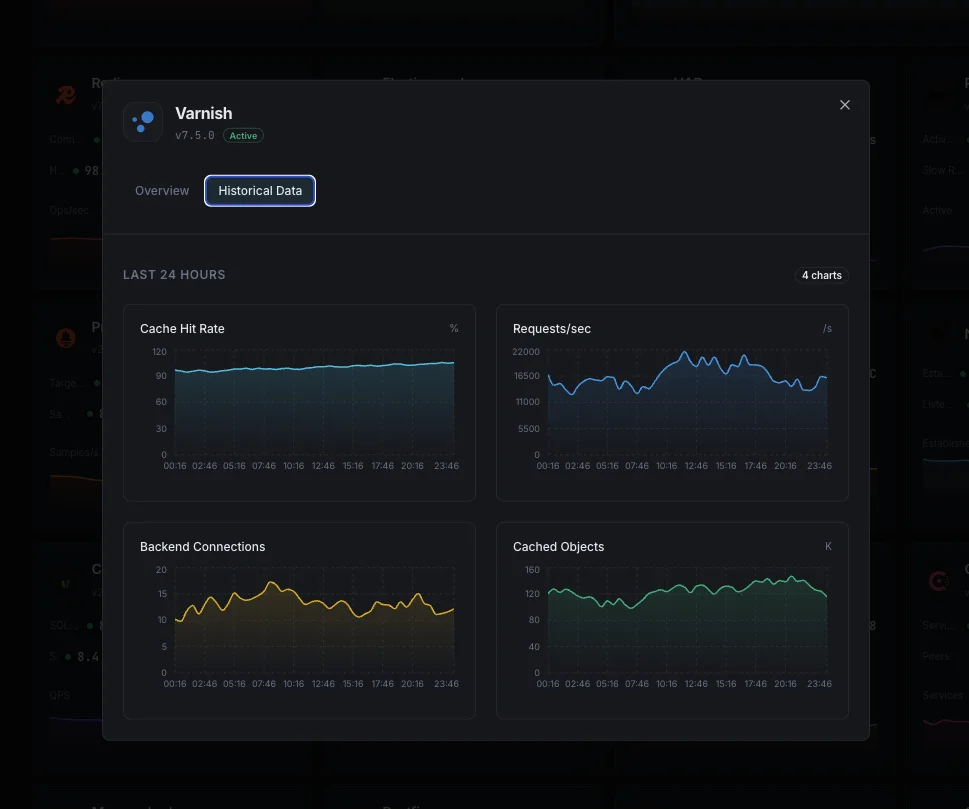
¿Qué gráficos ofrecen para la monitorización de Varnish Cache?
¿Puedo monitorear múltiples instancias de Varnish en un mismo servidor?
Empieza a seguir a Varnish hoy
Se configura en menos de 60 segundos. No se necesita tarjeta de crédito. Estadísticas completas desde el primer día.
Empieza tu prueba gratuita