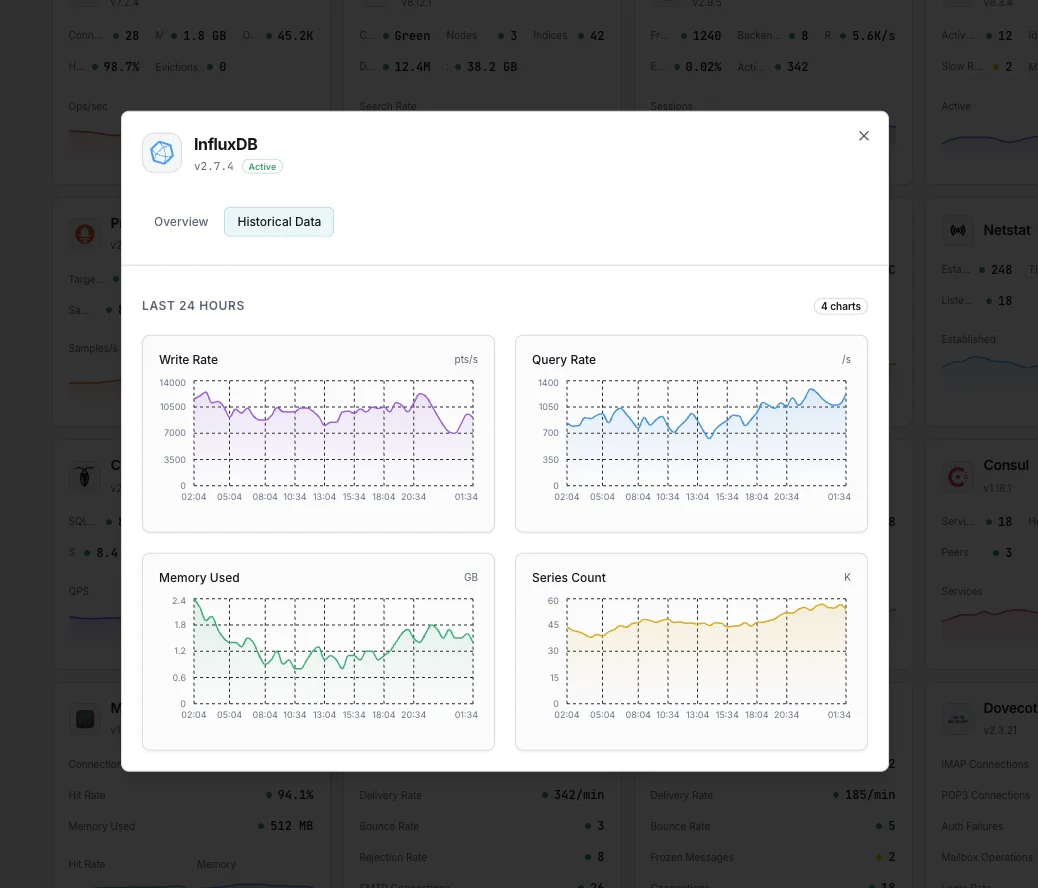
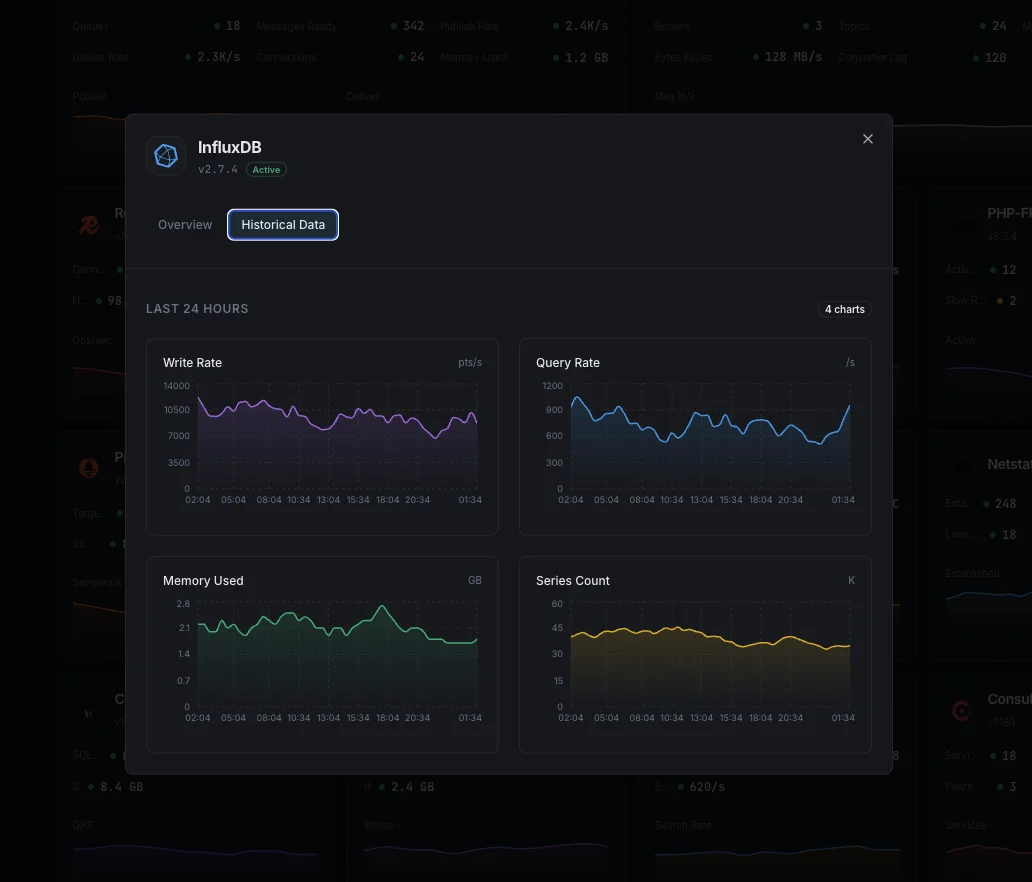
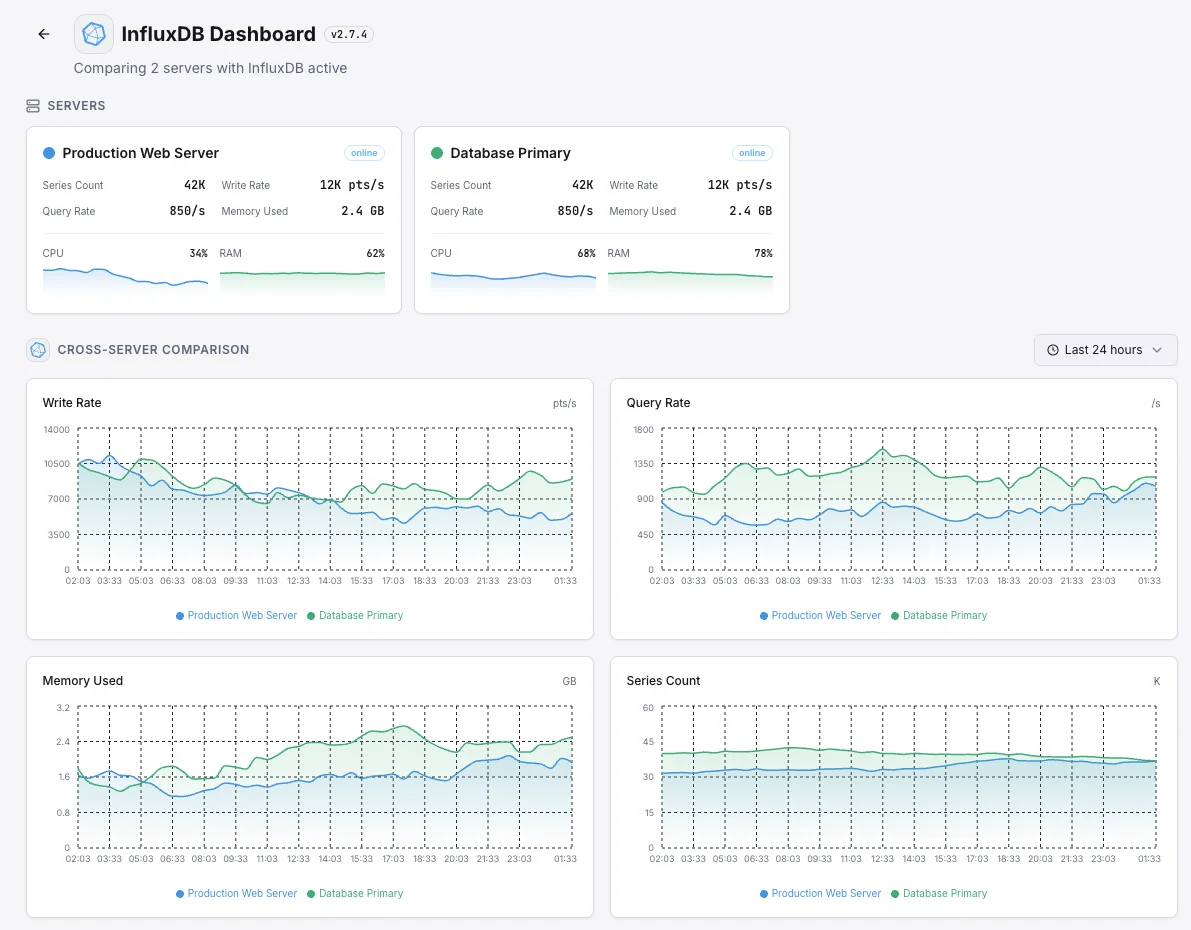
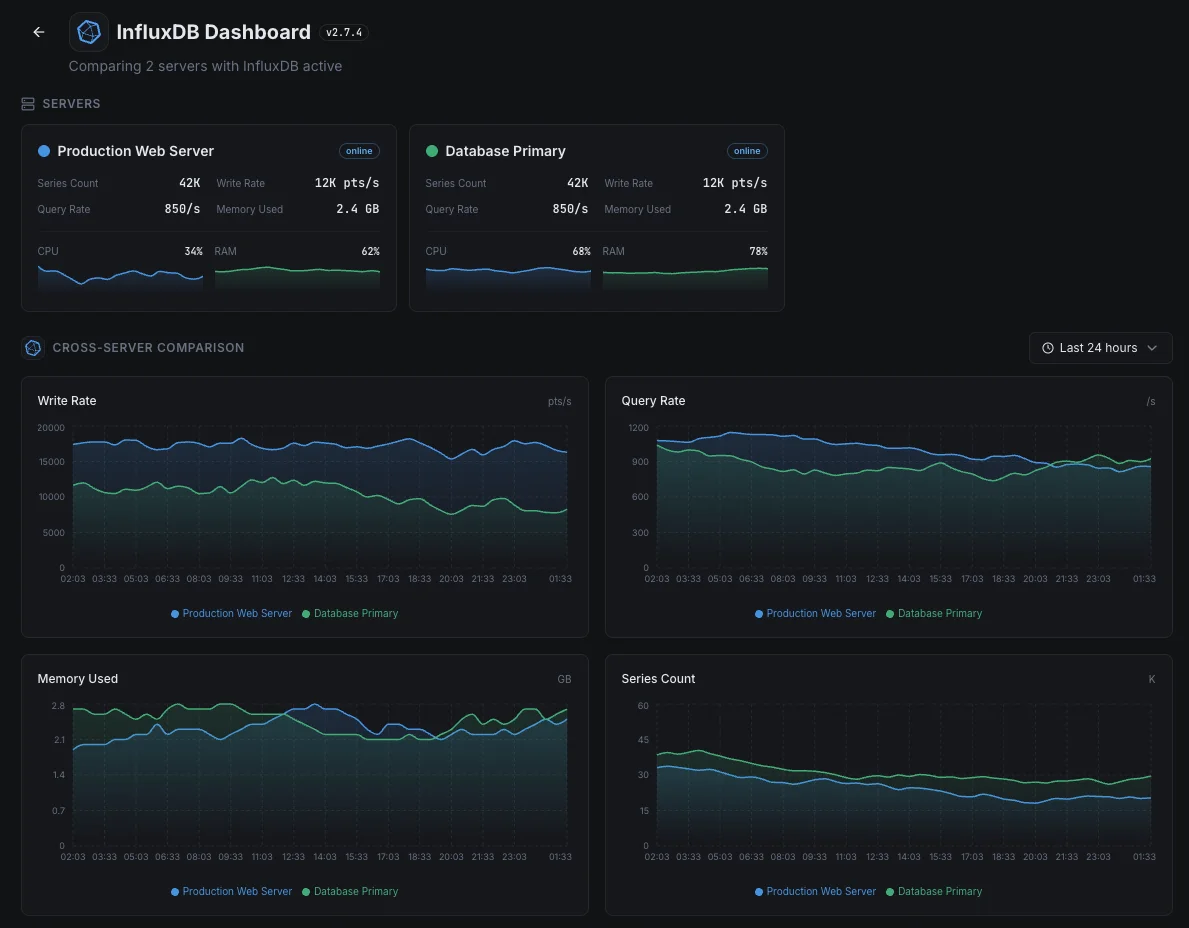
InfluxDB Monitoring
Monitor InfluxDB write throughput, query duration, series cardinality, TSM compaction queue, WAL size, and HTTP error rate in real time — via the native `/metrics` Prometheus endpoint, `_internal` (1.x), or `_monitoring` bucket (2.x).
Why monitor InfluxDB?
InfluxDB is the time-series database behind Grafana dashboards, IoT pipelines, and any TICK-stack deployment. When series cardinality explodes, compactions back up, or queries slow down, dashboards stop loading and alerts go silent. Monitoring catches the failure mode before the gap in graphs makes it obvious.
InfluxDB monitoring, explained
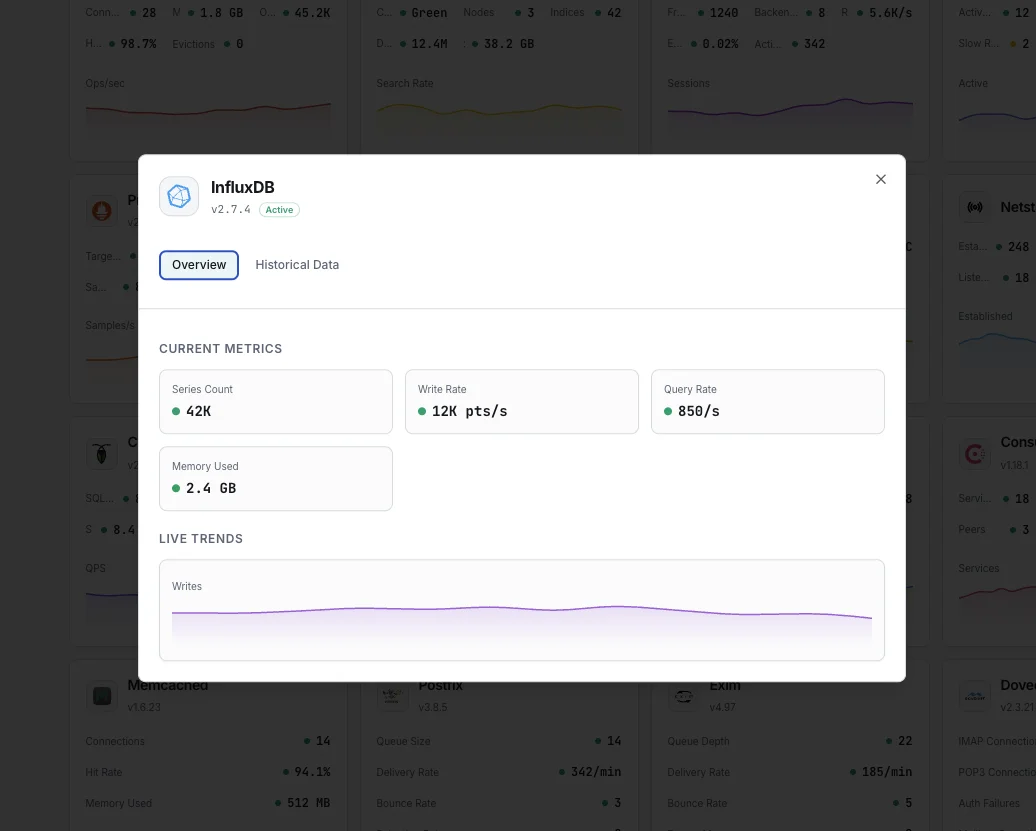
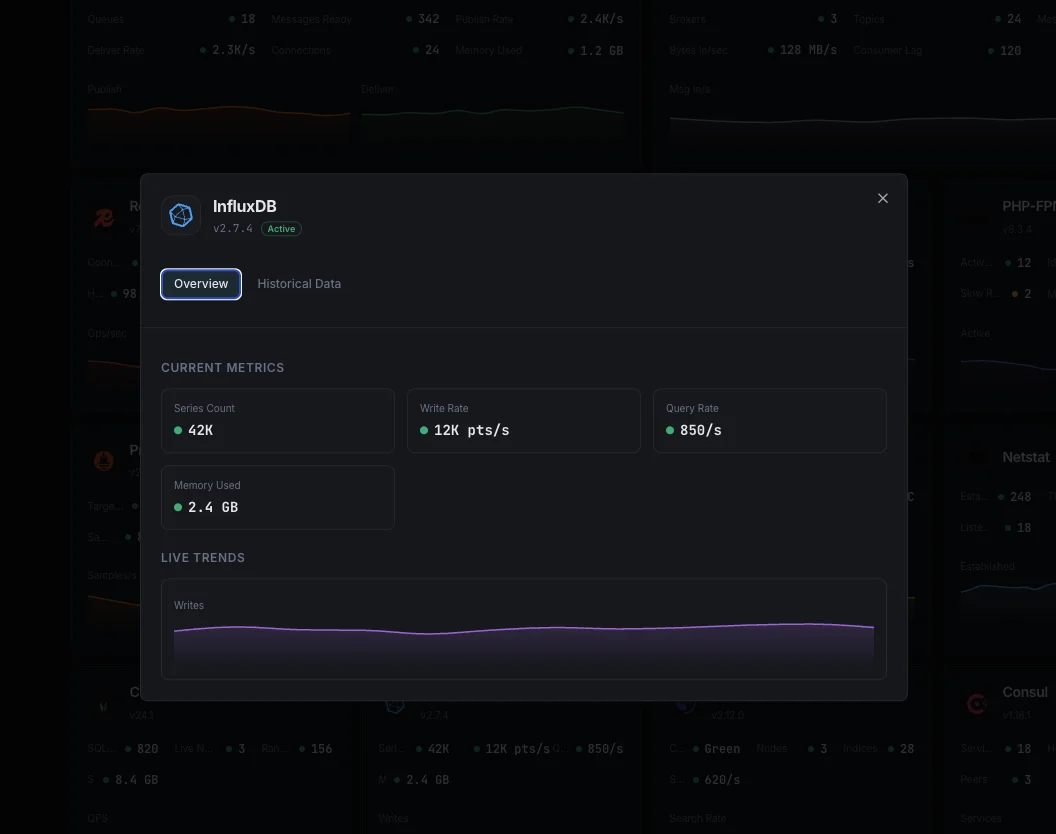
InfluxDB monitoring catches write-throughput stalls, runaway series cardinality (the classic InfluxDB 1.x/2.x failure mode), TSM compaction backlogs, query slowdowns, and WAL growth before they cause ingest loss or query timeouts on your Grafana dashboards. For IoT sensor pipelines, application metrics backends, and any TICK-stack deployment, per-database visibility is what separates a 60-second alert from a multi-hour incident chasing missing data points. Xitoring auto-discovers your InfluxDB, reads the native /metrics Prometheus endpoint, and routes alerts to Slack, PagerDuty, Telegram, or your existing on-call.
What we monitor
Write Points / sec
Rate of data points written, derived from `write.pointReq`. Spikes flag IoT/Telegraf storms; sudden drops flag broken collection pipelines.
Write Errors & Drops
`write.writeReqErr` (write requests failing) and `write.writeDropped` (points dropped server-side, often from cardinality or schema errors). Any non-zero rate = ingest is losing data.
Query Duration / Active Queries
`queryExecutor.queryDurationNs` (mean query time) and `queriesActive` (concurrent queries in flight). Both spike together during dashboard refresh storms.
Series Cardinality
`database.numSeries` per DB (1.x/2.x). The single most important InfluxDB health metric — runaway cardinality causes OOM, slow queries, and full storage exhaustion. Alert above your baseline + 50%.
TSM Compaction Queue
`storage.tsm1.compactions.*` Level 1/2/3/Full queue depths. Sustained non-zero queues mean writes are outpacing compactions — query performance degrades as small files accumulate.
TSM Cache
`storage.tsm1.cache.cachedBytes` (in-memory write buffer), `snapshotCount` (pending flushes), `WALCompactionTimeMs`. Cache growth without snapshot drain = compactor falling behind.
WAL Disk Bytes
`storage.tsm1.wal.currentSegmentDiskBytes` + `oldSegmentsDiskBytes`. WAL growth without TSM consolidation means recovery time will balloon on restart.
Storage Size on Disk
`storage.tsm1.filestore.diskBytes` + numFiles per shard. Track against your retention policy — high file counts at the same data size flag fragmentation.
HTTP 4xx / 5xx Rate
`httpd.clientError` + `httpd.serverError` (or Prometheus `http_api_request_errors_total`). 4xx spikes flag client schema/auth bugs; 5xx flags server-side failures.
Connections / Auth Failures
`httpd.req` (total HTTP requests), `httpd.authFail` (failed auth attempts), `httpd.pingReq`. Auth failure spikes signal misconfigured Telegraf or credential rotation gone wrong.
Runtime — Goroutines & GC
Go runtime stats: `runtime.NumGoroutine` (goroutine leak detection), `runtime.HeapAlloc` (live heap), `runtime.NumGC`/`PauseTotalNs` (GC pressure). Catch leaks and pause-time regressions before OOM.
Subscription Writes
`subscriber.pointsWritten` and `subscriber.writeFailures` — when Kapacitor or downstream pipelines consume via subscriptions, this is how you catch their backpressure.
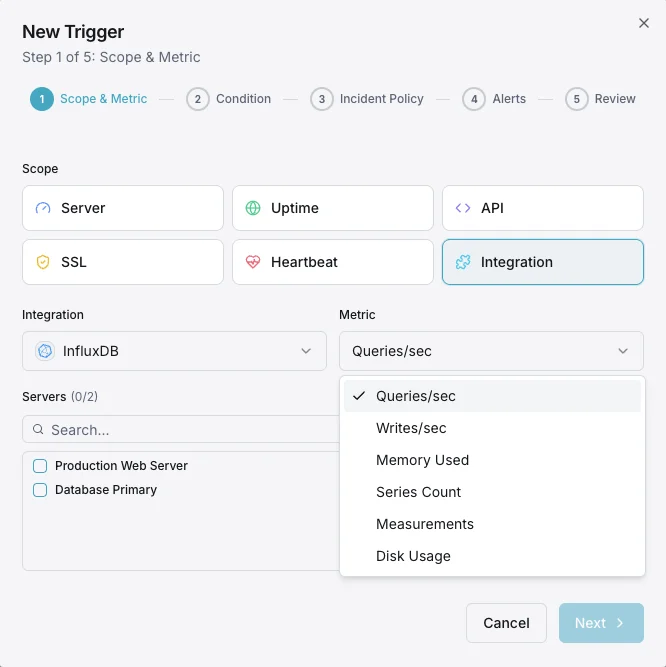
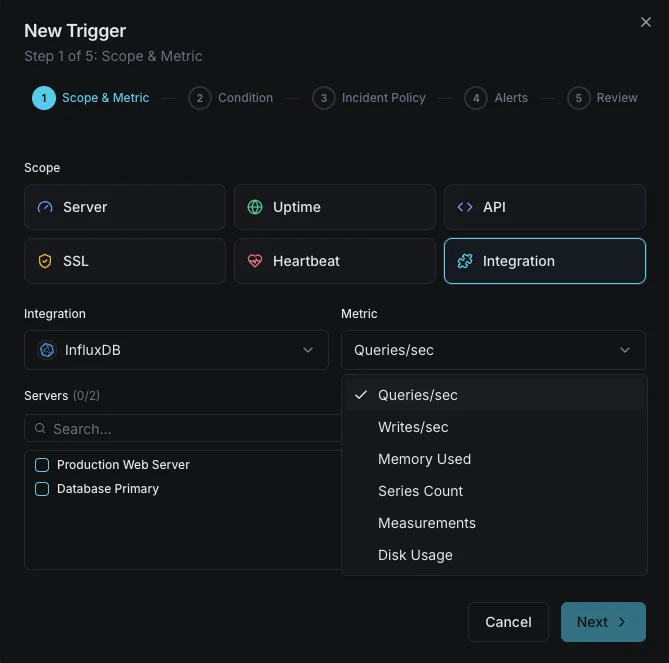
Configurable alert triggers
Set up custom triggers in your dashboard to get notified the moment InfluxDB metrics cross your defined thresholds.
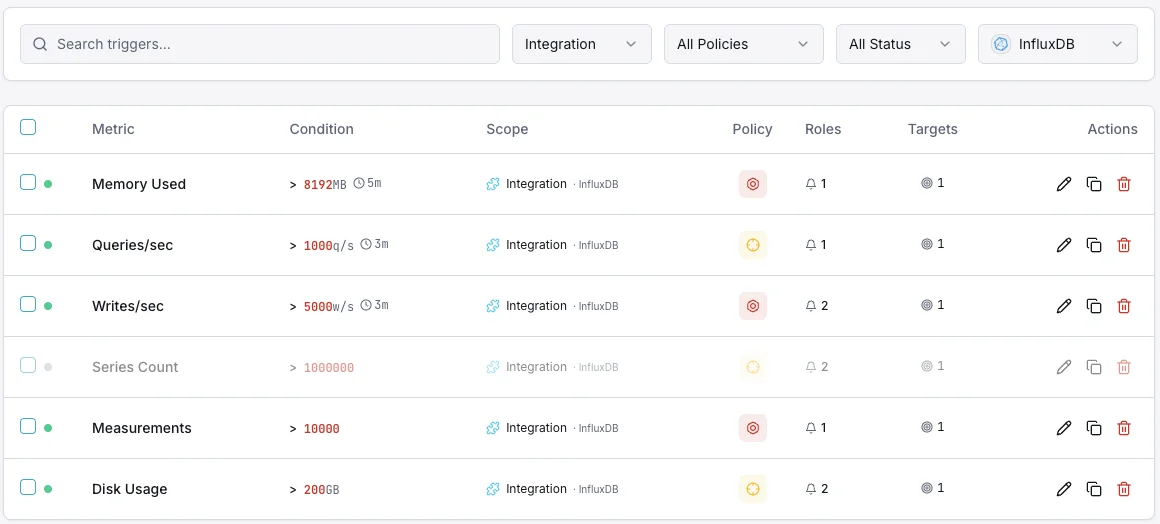
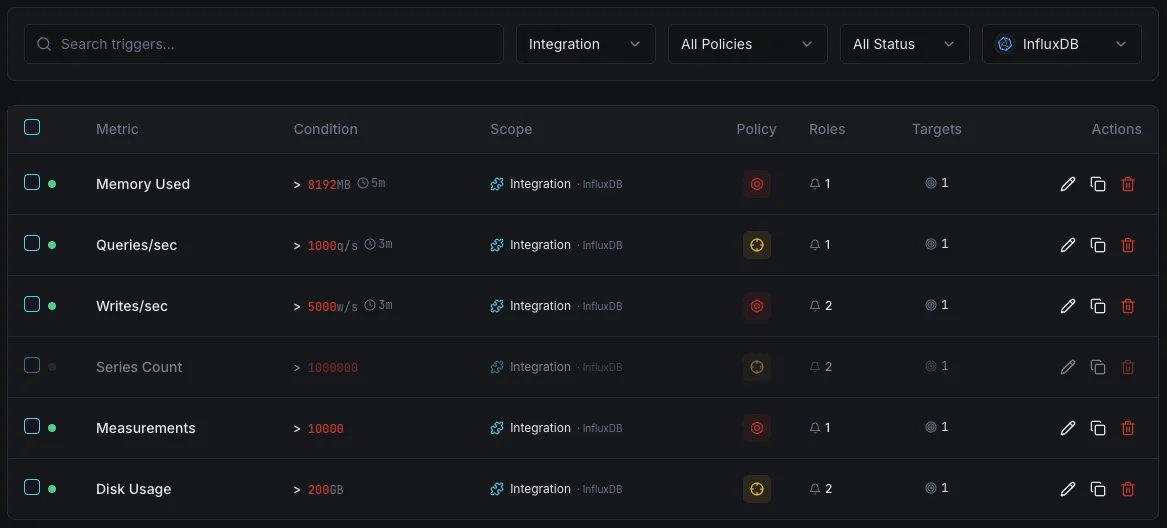
Write Throughput
warningFires on write rate anomalies.
Query Duration
warningAlerts on slow queries.
Series Cardinality
criticalTriggers when cardinality is too high.
Storage Size
criticalFires when storage exceeds threshold.
Importance of InfluxDB Monitoring
InfluxDB handles high-velocity time-series data. High cardinality, write pressure, and compaction delays can degrade performance.
- Track write throughput for ingestion health
- Monitor series cardinality to prevent OOM
- Detect slow queries early
- Ensure compaction keeps up
Why Choose Xitoring
Zero-config InfluxDB monitoring.
- One-command install
- Global nodes
- Unified dashboard
- Multi-channel alerts
- Historical retention
Common InfluxDB monitoring scenarios
Where InfluxDB typically runs today — and what could go wrong if no one's watching.
The database behind your team's dashboards
When dashboards in Grafana or another tool feel slow, the cause is often the database underneath — not the dashboard itself. We surface where the slowness actually lives so the team fixes the right thing instead of chasing the symptom.
Data flowing in from sensors and devices
Connected devices, factory equipment, and IoT sensors send measurements every second of every day. A silent backup in the pipeline means lost data — and lost data is gone forever. We watch the flow end to end so a single dropped reading raises the alarm.
App and infrastructure metrics in one place
When the same database holds both app metrics and server metrics, a problem with the database hides every signal at once. We watch the database itself so the team's own monitoring never goes dark during an incident.
Prerequisites for InfluxDB
Make sure you've got these in place — most installs are a 60-second job once they are.
- InfluxDB 1.x, 2.x, or 3.0 (FDAP) running on the server
- InfluxDB HTTP port reachable from Xitogent (default 8086, or 8181 on InfluxDB 3.0 Core)
- Optional: a read-only token if InfluxDB 2.x/3.0 authentication is enabled (operator or all-access scopes both work for
/metrics)
Get started in minutes
Install Xitogent on your InfluxDB host
Install the lightweight Xitogent monitoring agent on the host running InfluxDB.
curl -s https://xitoring.com/install.sh | sudo bash -s -- --key=YOUR_API_KEYConfirm InfluxDB is reachable
Verify InfluxDB is listening on its HTTP port (default 8086) and reachable from the host running Xitogent. Xitogent will prompt for host and port during integrate — no extra config edits or endpoint exposure are required.
sudo xitogent integrateEnable the InfluxDB integration
Use the Xitoring dashboard or CLI to enable the InfluxDB integration. Xitogent auto-detects your InfluxDB version and starts collecting write, query, and storage metrics.
Configure alert thresholds (optional)
Set custom thresholds for Write Throughput, Query Duration, or Series Cardinality to catch ingest pressure and runaway tag growth before queries slow down.
Verify it's working
Run this command on the server to confirm Xitogent picked up the integration. Fresh metrics will start streaming to your dashboard within ~30 seconds.
sudo xitogent statusConsidering alternatives?
See how Xitoring stacks up against the alternatives for InfluxDB monitoring — flat pricing, deeper integrations, and one agent that covers your whole stack.


Frequently asked questions
What is InfluxDB monitoring?
How do I monitor InfluxDB write throughput?
How do I detect InfluxDB cardinality issues?
What is the _internal database in InfluxDB?
How do I monitor InfluxDB compactions?
What's the difference between InfluxDB 1.x, 2.x, and 3.0 monitoring?
How do I detect InfluxDB query slowness?
How do I monitor InfluxDB TSM storage?
Will this integration affect InfluxDB performance?
Start monitoring InfluxDB today
Set up in under 60 seconds. No credit card required. Full metrics from day one.
Start Free TrialKeep exploring