
PHP-FPM Monitoring
Monitor PHP-FPM accepted conn, listen queue depth, active vs idle processes, slow requests, and `max_children_reached` per pool in real time — agent-based via the native `/fpm/status` endpoint.
Why monitor PHP-FPM?
PHP-FPM sits between Nginx (or Apache) and your application code — every PHP request flows through it. When pools saturate, workers leak, or queries slow down, every page on the site feels it. Per-pool monitoring is the most useful signal between user-reported slowness and root cause.
PHP-FPM monitoring, explained
PHP-FPM monitoring catches pool exhaustion, slow queries, and worker leaks before they slow every PHP request on the server. For WordPress, Laravel, Magento, and any Nginx + PHP-FPM stack, per-pool visibility is the single most useful signal between user-reported slowness and root cause. Xitoring auto-discovers every pool on the host, polls the native /fpm/status endpoint on a 1-minute interval, and routes alerts to your existing on-call rotation.
What we monitor
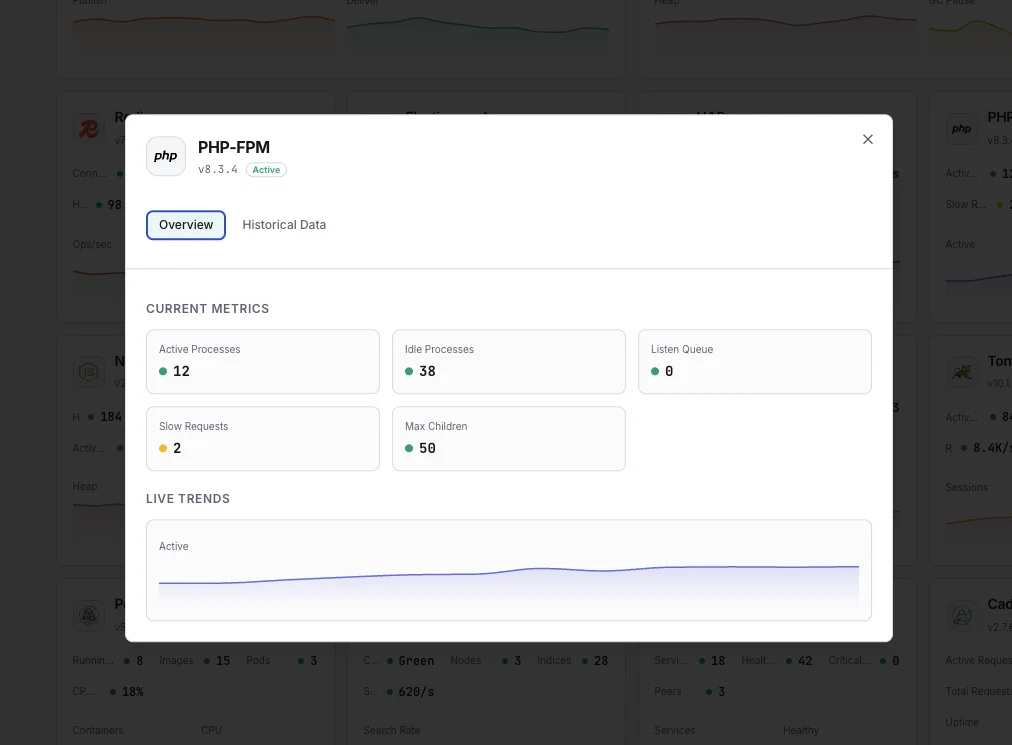
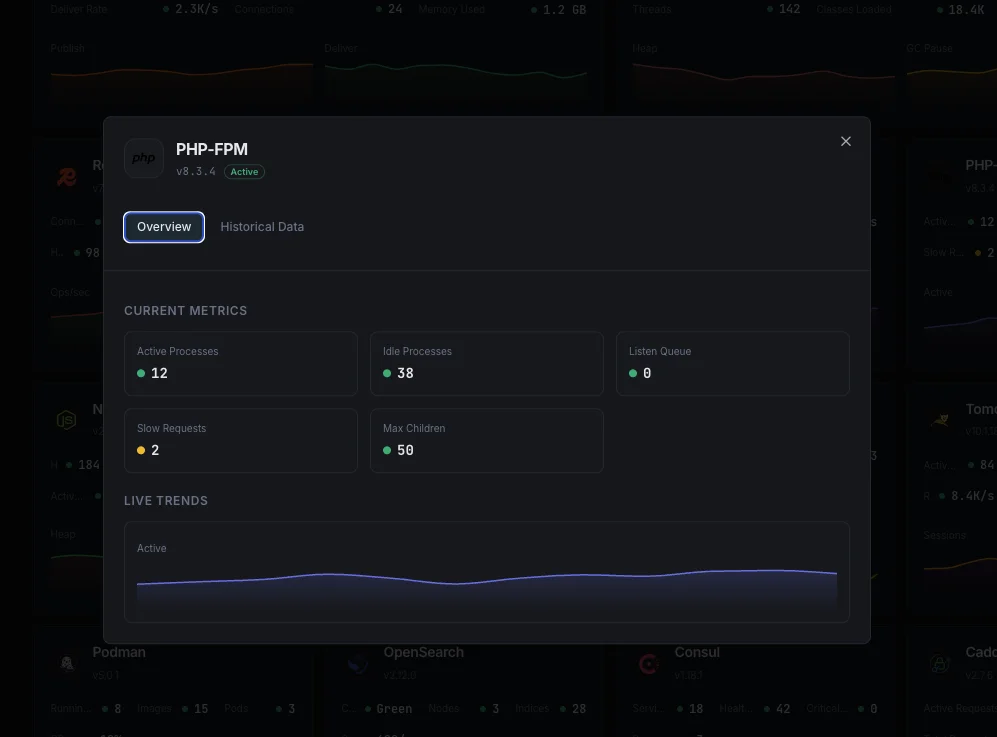
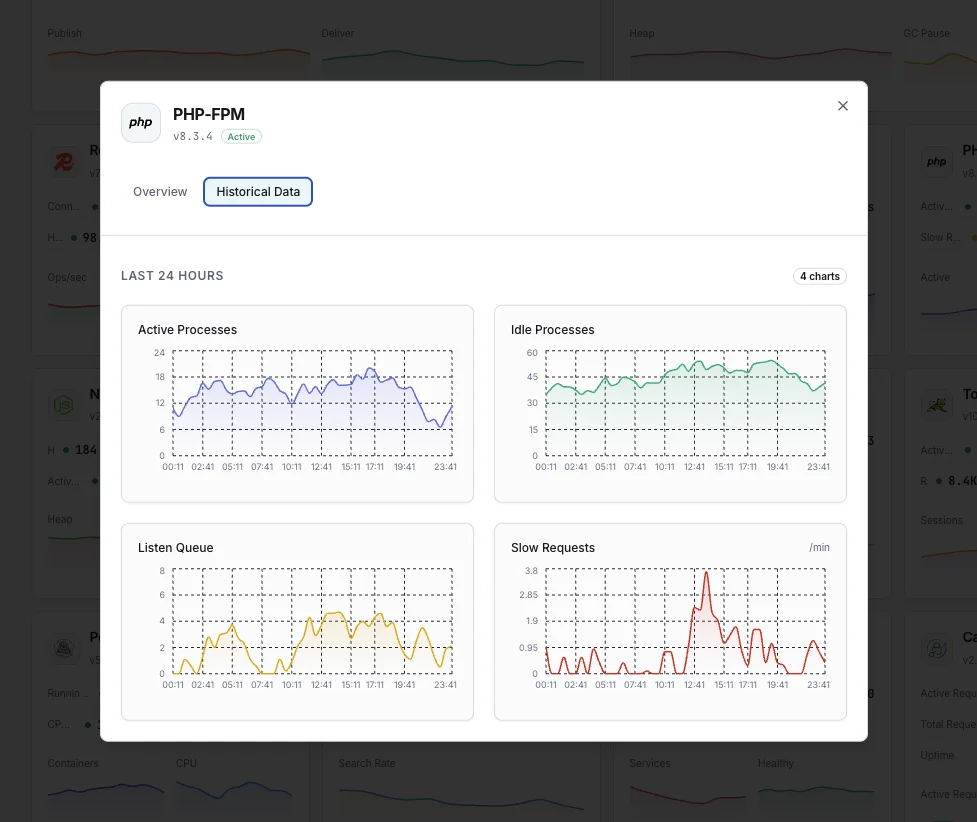
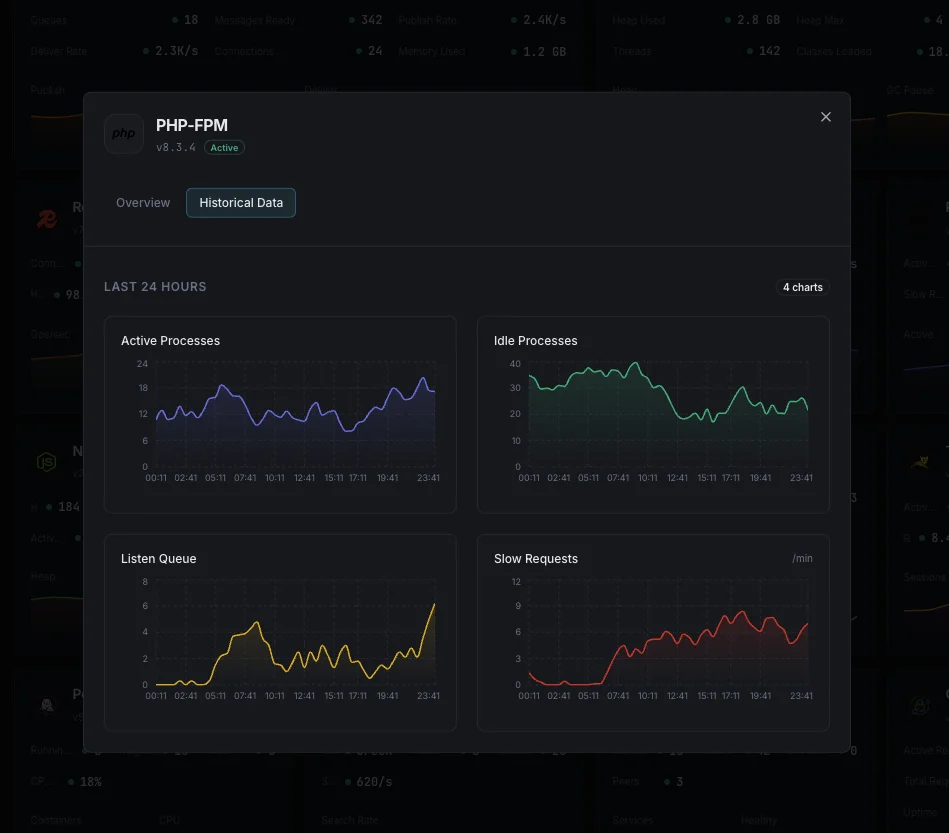
Active Processes
Workers currently processing PHP requests, per pool. The first signal for pool saturation.
Idle Processes
Workers waiting for requests. With `pm.dynamic`, watch this against `pm.min_spare_servers` and `pm.max_spare_servers`.
Total Processes
Active + idle workers per pool. Compare against `pm.max_children` to know your headroom.
Max Active Processes
Peak observed concurrent requests per pool. The right input for sizing `pm.max_children` correctly.
Listen Queue
Requests waiting for a free worker (kernel-level backlog). Sustained non-zero values mean every PHP request is waiting on the pool.
Max Listen Queue
Peak observed listen queue depth. If it ever approaches `listen.backlog`, kernel-level connection drops are imminent.
Max Children Reached
Count of times the pool hit `pm.max_children` since the last reload. Any non-zero value is a hard signal to raise the limit or add a pool.
Slow Requests
Requests exceeding `request_slowlog_timeout`, written to `slowlog` with a backtrace. Trending up means application code or database queries are degrading.
Accepted Conn
Total connections accepted by the pool since start. Combined with `start since` (uptime) gives a clean requests-per-pool rate.
Memory per Process
Average resident memory per worker. Steady growth between recycles points at a leak — tune `pm.max_requests` to recycle more aggressively.
Request Duration
Average request processing time per pool, from `?full` status output. Track p95 to catch tail latency invisible to averages.
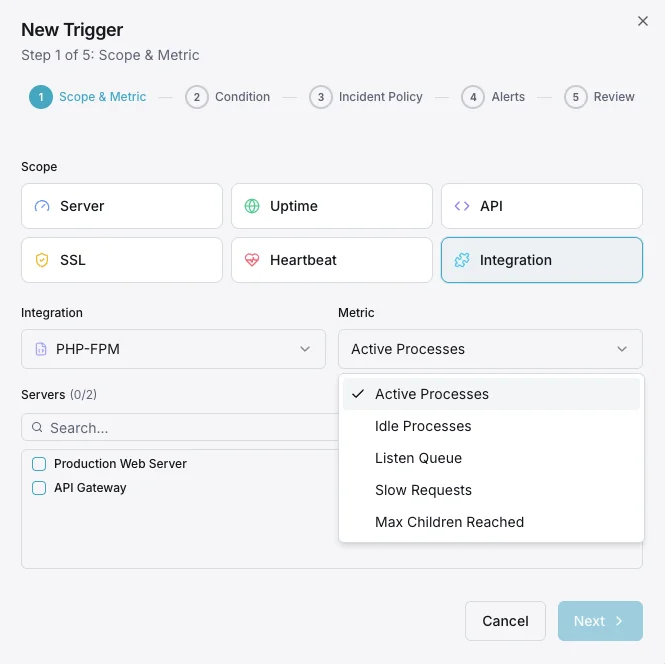
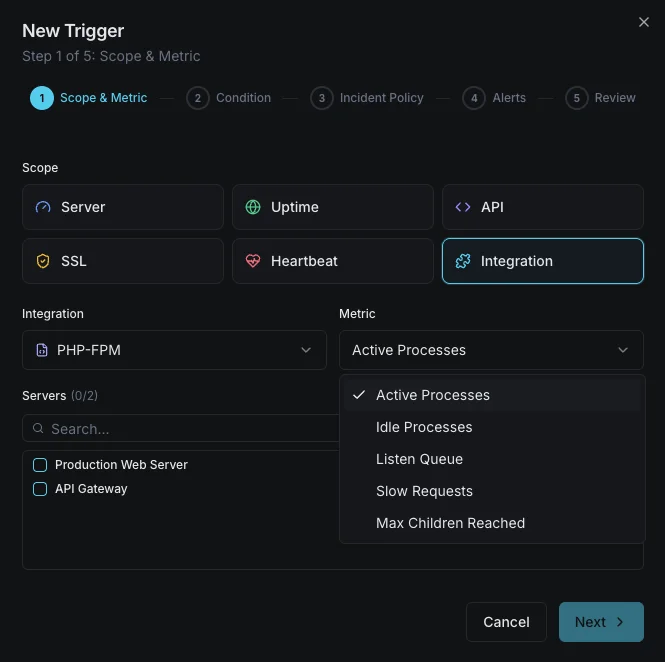
Configurable alert triggers
Set up custom triggers in your dashboard to get notified the moment PHP-FPM metrics cross your defined thresholds.
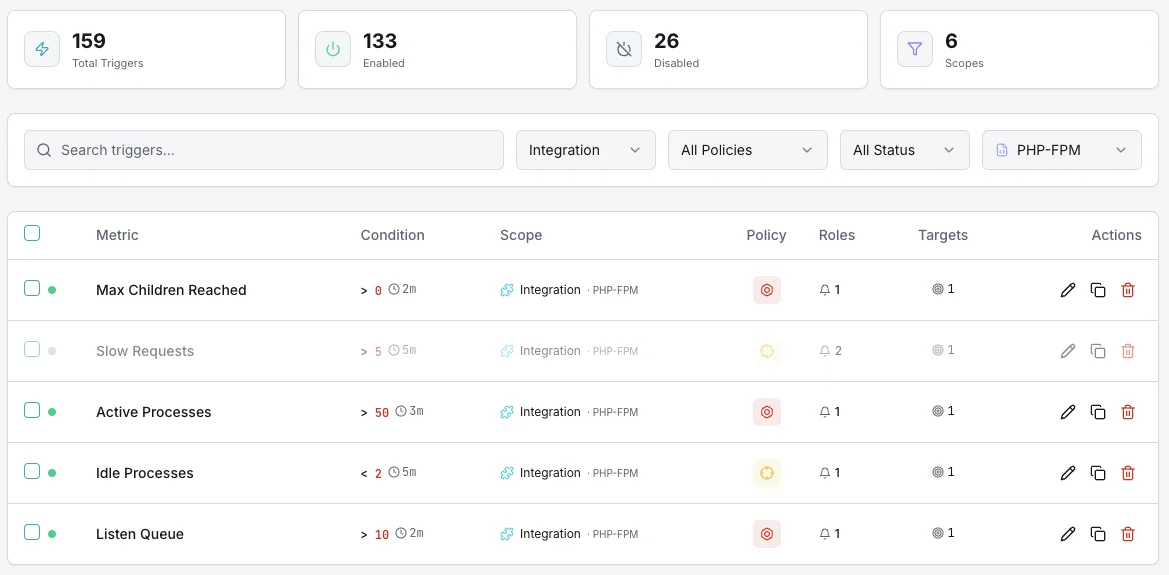
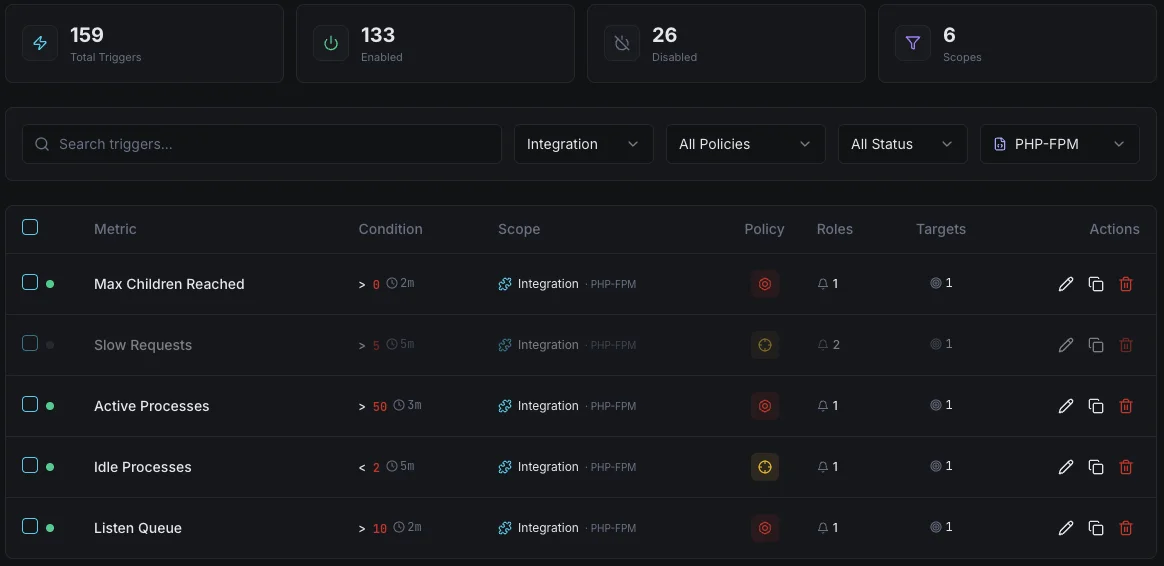
Slow Requests
warningFires when slow request count exceeds threshold.
Listen Queue
criticalTriggers when requests are queuing, indicating insufficient workers.
Max Children
criticalAlerts when process limit is reached repeatedly.
Memory Usage
warningFires on high per-process memory usage.
Active Processes
warningTriggers when all workers are busy.
Importance of PHP-FPM Monitoring
PHP powers 77% of websites. Without monitoring, slow scripts, memory leaks, and worker exhaustion can bring applications to a halt.
- Detect slow PHP scripts before they impact users
- Right-size process pools based on real data
- Prevent memory exhaustion from leaky scripts
- Monitor listen queue to avoid request drops
Why Choose Xitoring
Seamless PHP-FPM monitoring with zero-config setup and multi-pool support.
- One-command install
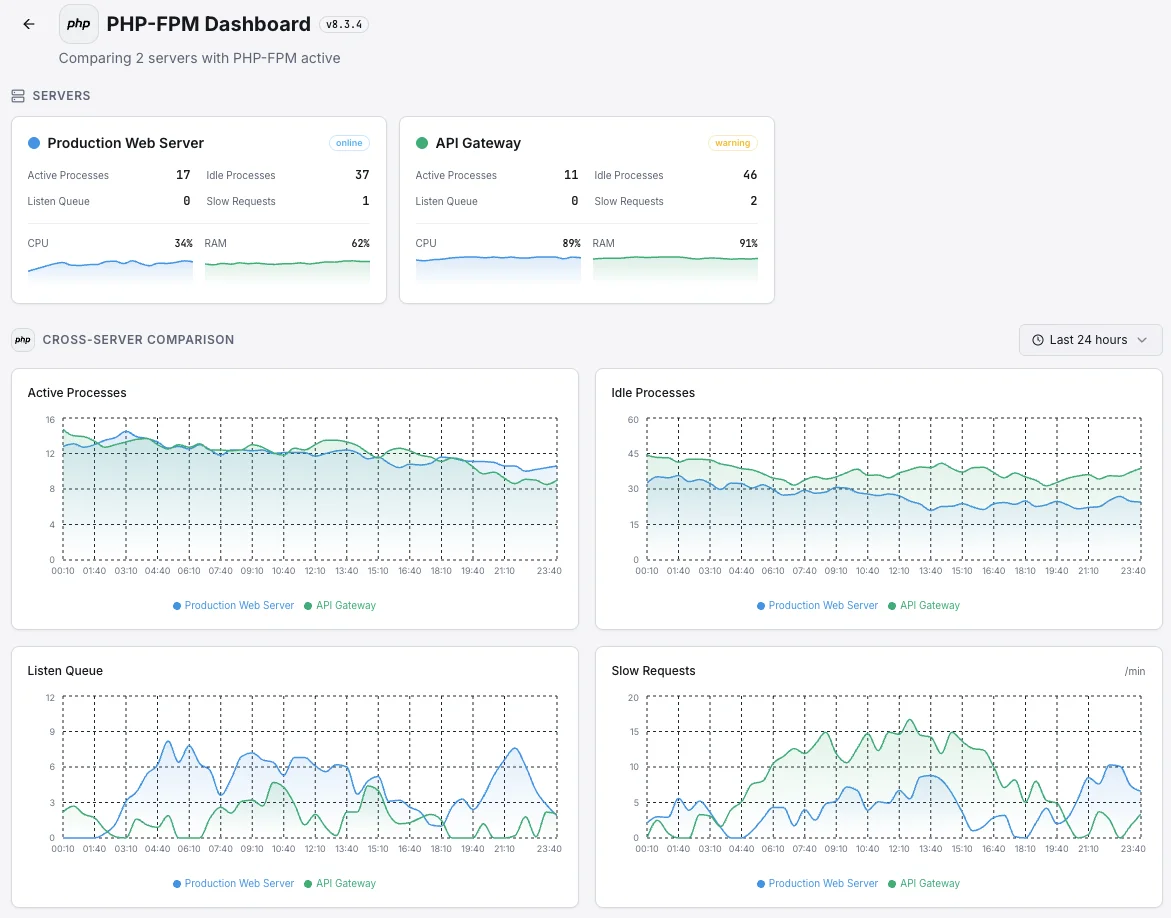
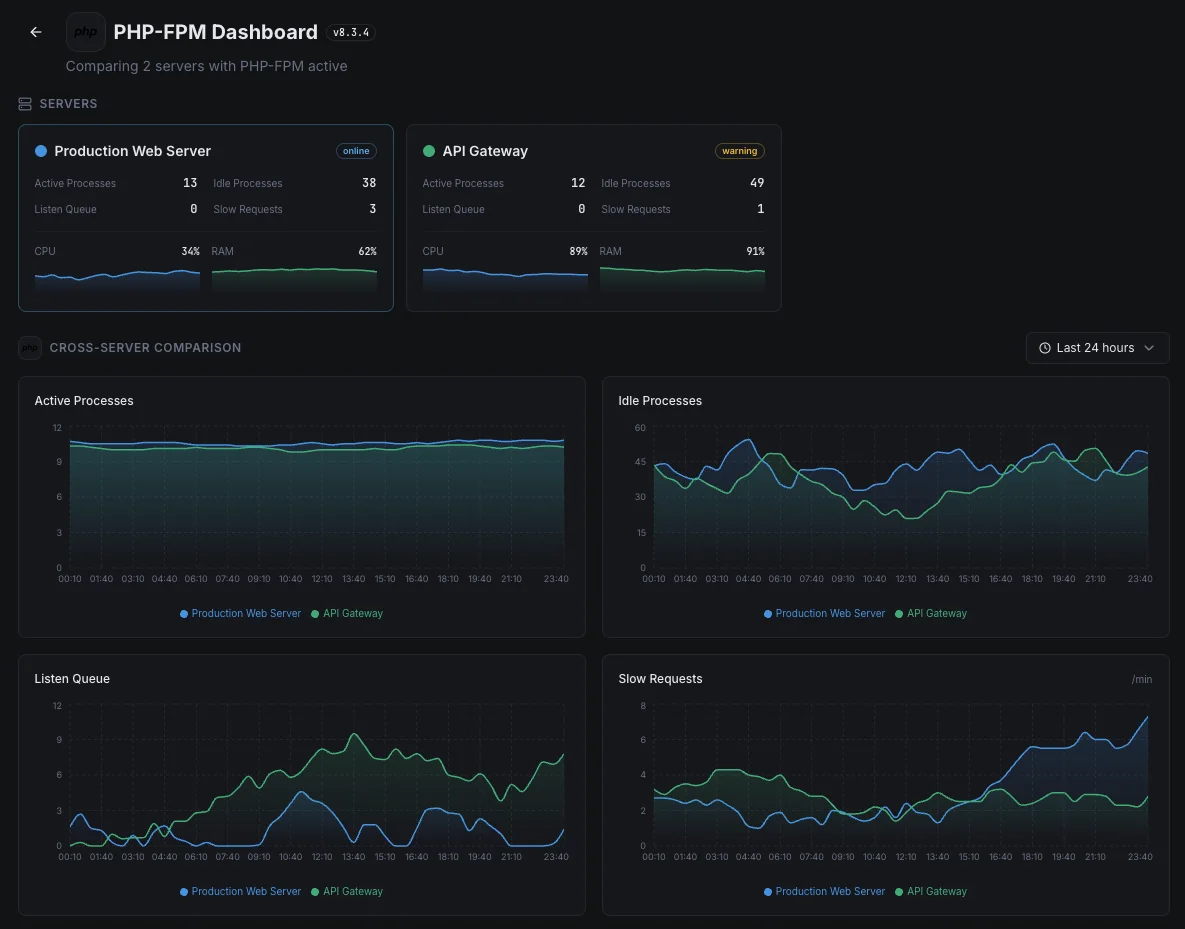
- Multi-pool monitoring support
- Unified dashboard
- Multi-channel alerting
- Historical data retention
Common PHP-FPM monitoring scenarios
Where PHP-FPM typically runs today — and what could go wrong if no one's watching.
WordPress, Laravel, and other PHP sites
Most PHP sites get slow for the same reason: there aren't enough workers free to handle incoming visitors fast enough. We catch the bottleneck the moment it begins so the team can fix it before search rankings or conversions take a hit.
PHP apps running in containers
When the same app runs in many containers, some can quietly handle much more traffic than others. We surface the uneven load so the team can rebalance before some visitors get a slower experience than others.
Many websites on shared hosting
On shared hosting, one noisy customer site can quietly consume the resources every other site needs. We show which site is causing the problem so the team can address the cause instead of restarting blindly.
Prerequisites for PHP-FPM
Make sure you've got these in place — most installs are a 60-second job once they are.
- PHP-FPM with
pm.status_path = /fpm/status(and optionallyping.path = /fpm/ping) set per pool - The status URL accessible from localhost (via Nginx
fastcgi_passor Apache equivalent) - Read access to PHP-FPM logs and pool config
Get started in minutes
Install Xitogent on your web server
Install the lightweight Xitogent monitoring agent on the host running PHP-FPM.
curl -s https://xitoring.com/install.sh | sudo bash -s -- --key=YOUR_API_KEYEnable the PHP-FPM status page
Set `pm.status_path = /fpm/status` and `ping.path = /fpm/ping` in your pool config (typically `/etc/php/X.Y/fpm/pool.d/www.conf`). Add a fastcgi_pass location block in Nginx (or equivalent for Apache) to expose the path to localhost, then reload PHP-FPM and verify the URL responds.
# In your PHP-FPM pool config (e.g. /etc/php/8.x/fpm/pool.d/www.conf)
pm.status_path = /fpm/status
ping.path = /fpm/ping

# Then in Nginx, expose them to localhost:
location ~ ^/fpm/(status|ping)$ {
  allow 127.0.0.1;
  deny  all;
  fastcgi_pass   unix:/var/run/php-fpm/www.sock;
  include        fastcgi_params;
}Enable the PHP-FPM integration
Use the Xitoring dashboard or CLI to enable the PHP-FPM integration. Xitogent auto-detects every FPM pool on the host and tracks them independently.
sudo xitogent integrateConfigure alert thresholds (optional)
Set custom thresholds for Slow Requests, Listen Queue, or Max Children Reached to catch performance regressions and pool exhaustion before users feel them.
Verify it's working
Run this command on the server to confirm Xitogent picked up the integration. Fresh metrics will start streaming to your dashboard within ~30 seconds.
sudo xitogent statusConsidering alternatives?
See how Xitoring stacks up against the alternatives for PHP-FPM monitoring — flat pricing, deeper integrations, and one agent that covers your whole stack.



Frequently asked questions
What is PHP-FPM monitoring?
How do I enable the PHP-FPM status page?
What is the difference between pm.dynamic, pm.static, and pm.ondemand?
How do I detect PHP-FPM slow requests?
What does max_children_reached mean and why does it matter?
How do I monitor multiple PHP-FPM pools on one server?
How do I troubleshoot a growing listen queue?
What PHP versions are still receiving security updates?
Will the status page affect PHP performance?
Start monitoring PHP-FPM today
Set up in under 60 seconds. No credit card required. Full metrics from day one.
Start Free Trial