Redis Monitoring
Monitor Redis `used_memory`, `mem_fragmentation_ratio`, `keyspace_hits`/`keyspace_misses` ratio, evicted keys, replication offset, and `rejected_connections` in real time — agent-based via the native `INFO` command.
Why monitor Redis?
Redis sits between your app and your database — caching, sessions, rate limiting, queues. When Redis stutters, every request that touches it stutters too, which is most of them. Monitoring catches memory pressure, eviction storms, and slow commands in their first minute, before the cascade hits your DB and your users.
Redis monitoring, explained
Redis monitoring catches memory pressure, fragmentation, eviction storms, replication drift, and slow commands before they cause OOM kills, dropped connections, or cascading cache misses. Because Redis sits between your app and your DB, a Redis incident is usually a site-wide incident — monitoring it well means catching most cache-layer failures in their first minute. Xitoring auto-discovers your Redis, reads INFO + SLOWLOG + LATENCY on a 1-minute interval, and routes alerts to Slack, PagerDuty, Telegram, or your existing on-call.
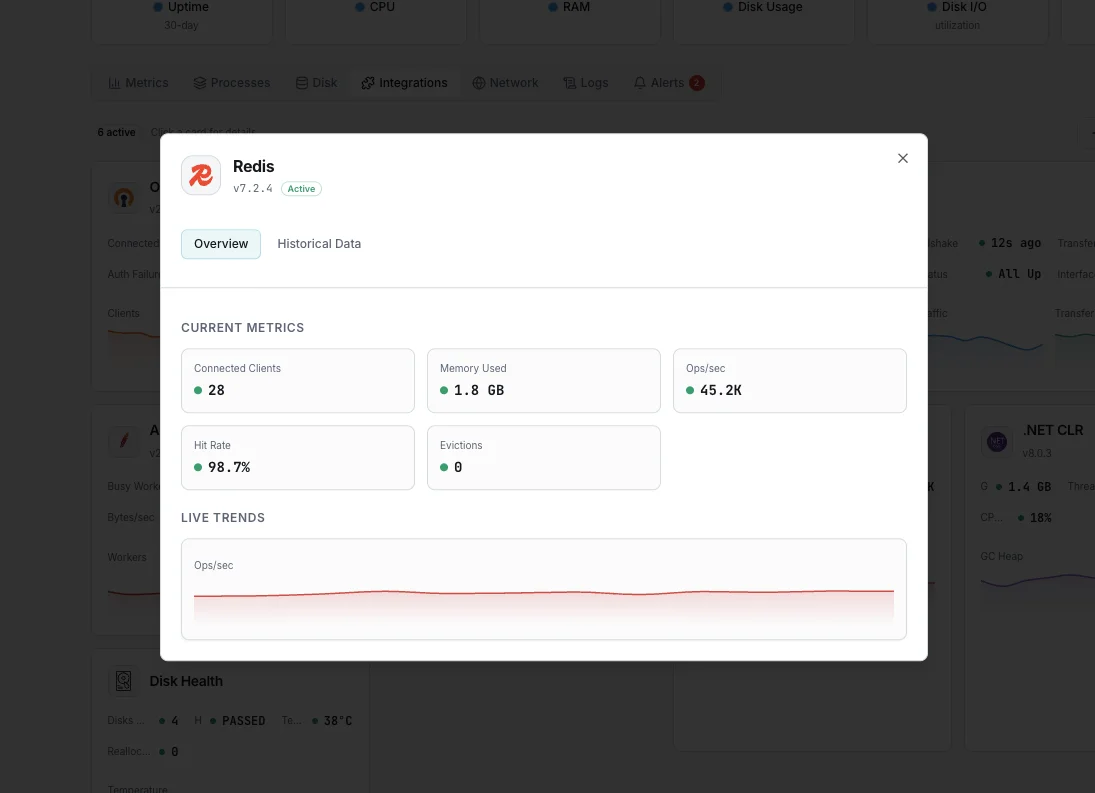
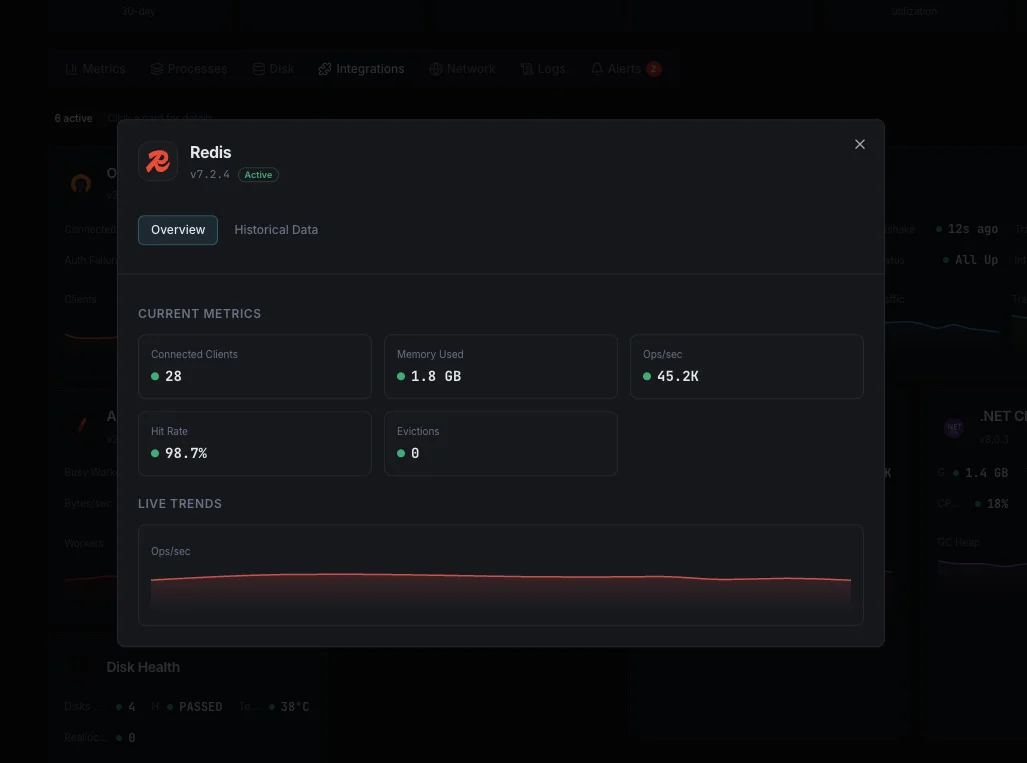
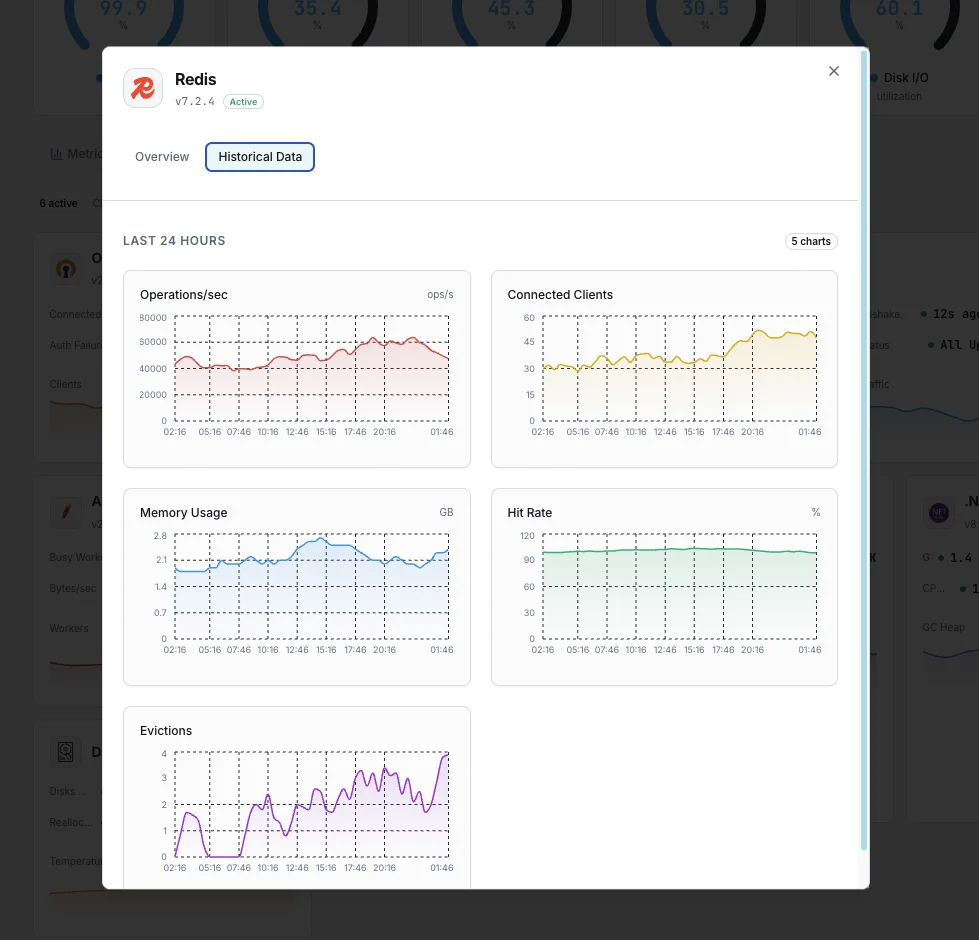
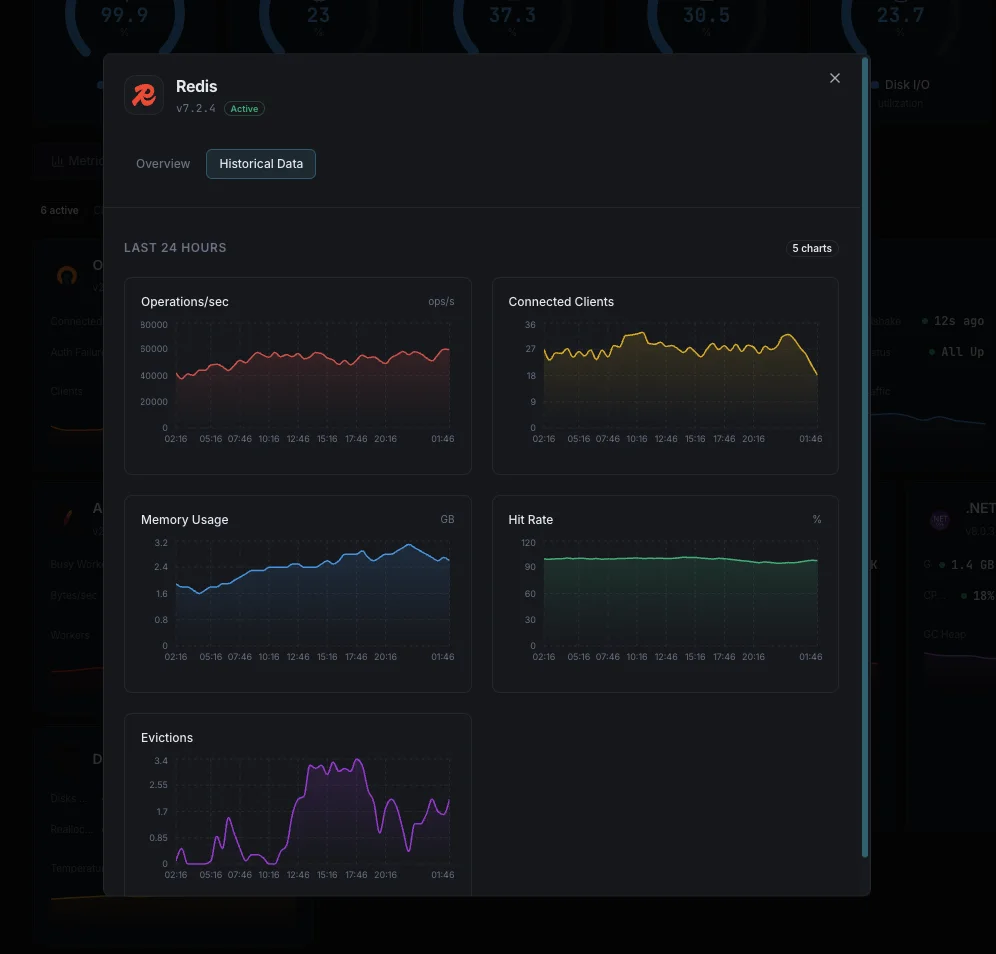
What we monitor
Used Memory
Total memory allocated by Redis including overhead.
Memory Fragmentation Ratio
Ratio of OS-allocated memory to Redis-allocated memory. Values above 1.5 indicate fragmentation.
Connected Clients
Number of currently connected client connections.
Blocked Clients
Number of clients waiting on a blocking call (BLPOP, BRPOP, etc.).
Keyspace Hit Rate
Percentage of successful key lookups vs misses, indicating cache effectiveness.
Evicted Keys
Number of keys removed due to maxmemory policy.
Expired Keys
Number of keys removed due to TTL expiration.
Commands per Second
Rate of commands processed by the Redis server.
Keyspace Size
Total number of keys stored across all databases.
Replication Offset
Replication offset delta between master and replicas.
RDB Last Save
Time since last successful RDB snapshot.
AOF Rewrite
Status and duration of AOF rewrite operations.
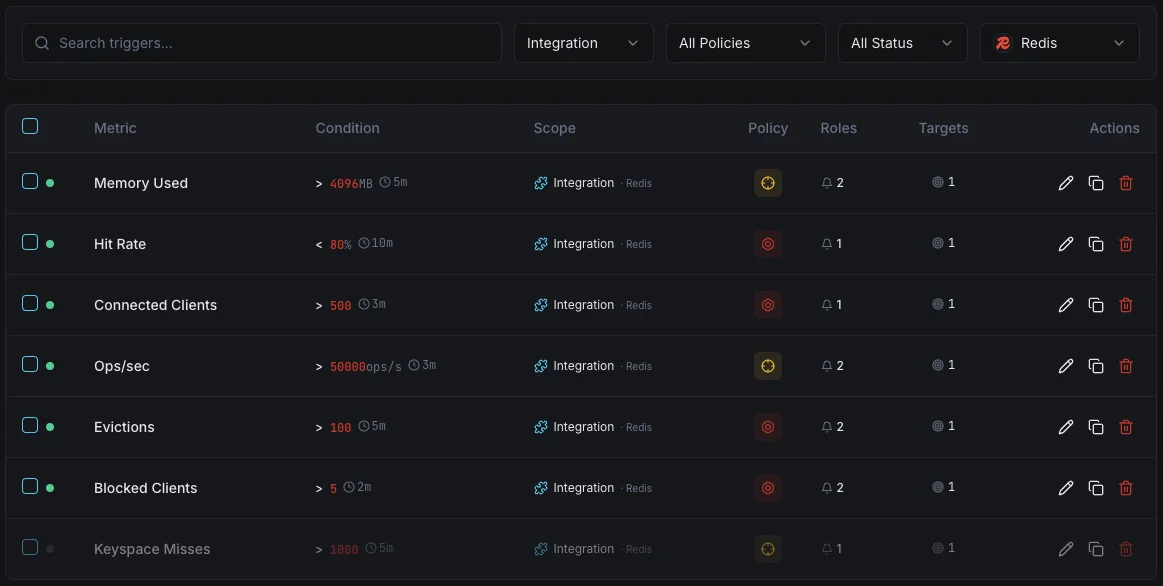
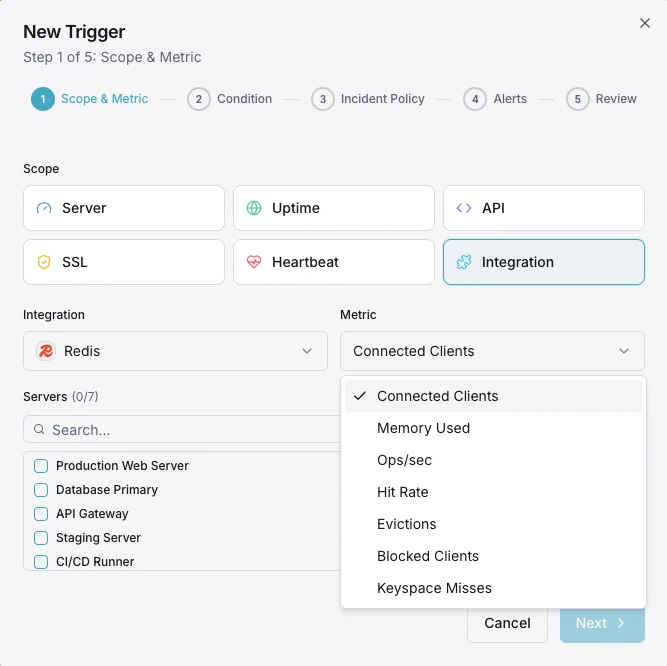
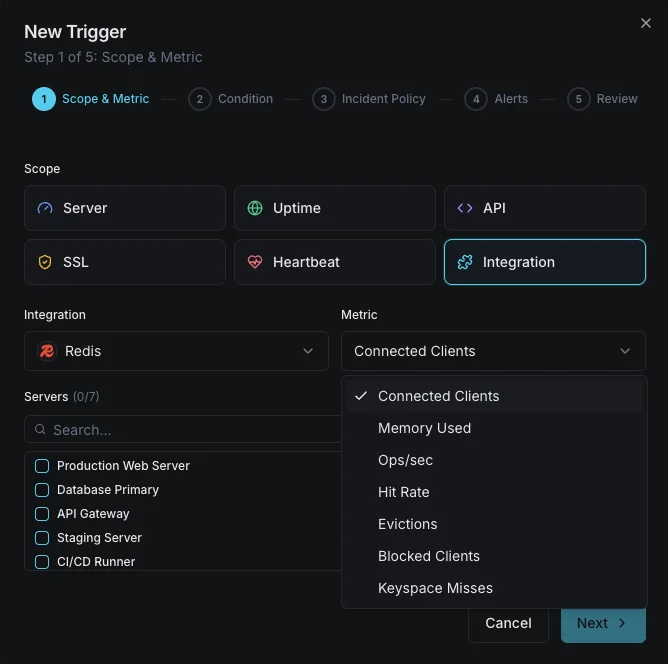
Configurable alert triggers
Set up custom triggers in your dashboard to get notified the moment Redis metrics cross your defined thresholds.
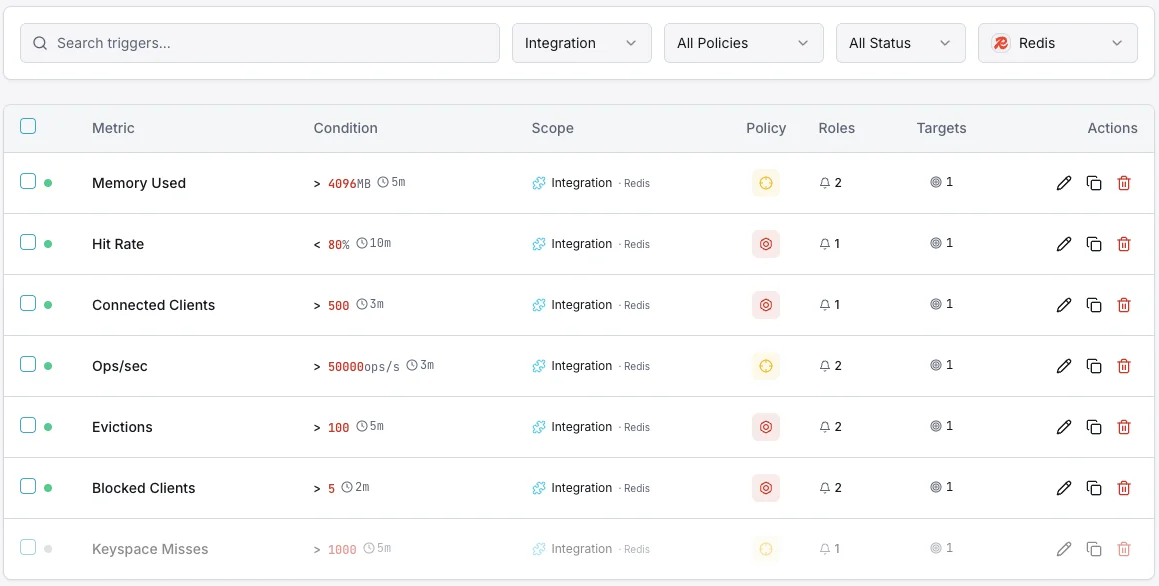
Memory Usage
criticalFires when Redis memory consumption exceeds your threshold, risking OOM kills or eviction storms.
Connected Clients
warningTriggers when client connections exceed the threshold, indicating potential connection leaks.
Keyspace Hit Rate
warningAlerts when cache hit rate drops below threshold, indicating cache inefficiency or working set changes.
Evicted Keys
criticalFires when eviction rate spikes, meaning Redis is actively removing data to stay within memory limits.
Blocked Clients
warningTriggers when clients are blocked waiting on operations, indicating queue congestion.
Replication Lag
criticalAlerts when replica offset falls behind the master, risking data inconsistency in failover scenarios.
Importance of Redis Monitoring
Redis serves as the performance backbone for modern applications — handling sessions, caching, rate limiting, and real-time analytics. Without monitoring, memory pressure, eviction storms, and replication drift can silently degrade your entire application stack.
- Detect memory pressure before OOM kills crash your instance
- Monitor cache hit rates to ensure optimal application performance
- Track eviction patterns to right-size your memory allocation
- Identify connection leaks from application clients
- Ensure replication consistency for high-availability setups
Why Choose Xitoring
Xitoring delivers enterprise-grade Redis monitoring with zero-config setup. Our lightweight agent auto-discovers your Redis instances, starts collecting metrics in under 60 seconds, and integrates with your existing notification channels.
- One-command install — no complex YAML or config files
- 15+ global monitoring nodes for low-latency checks
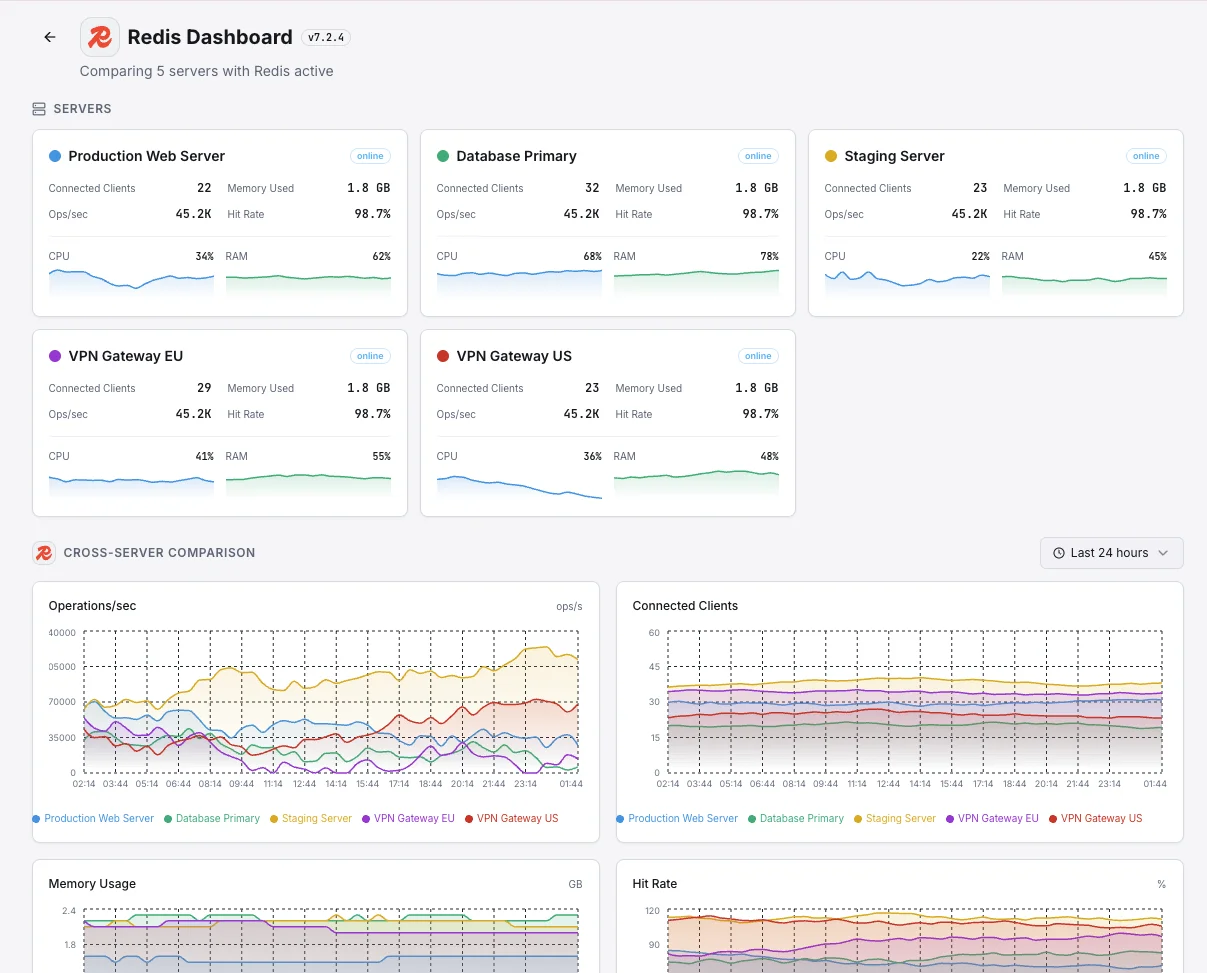
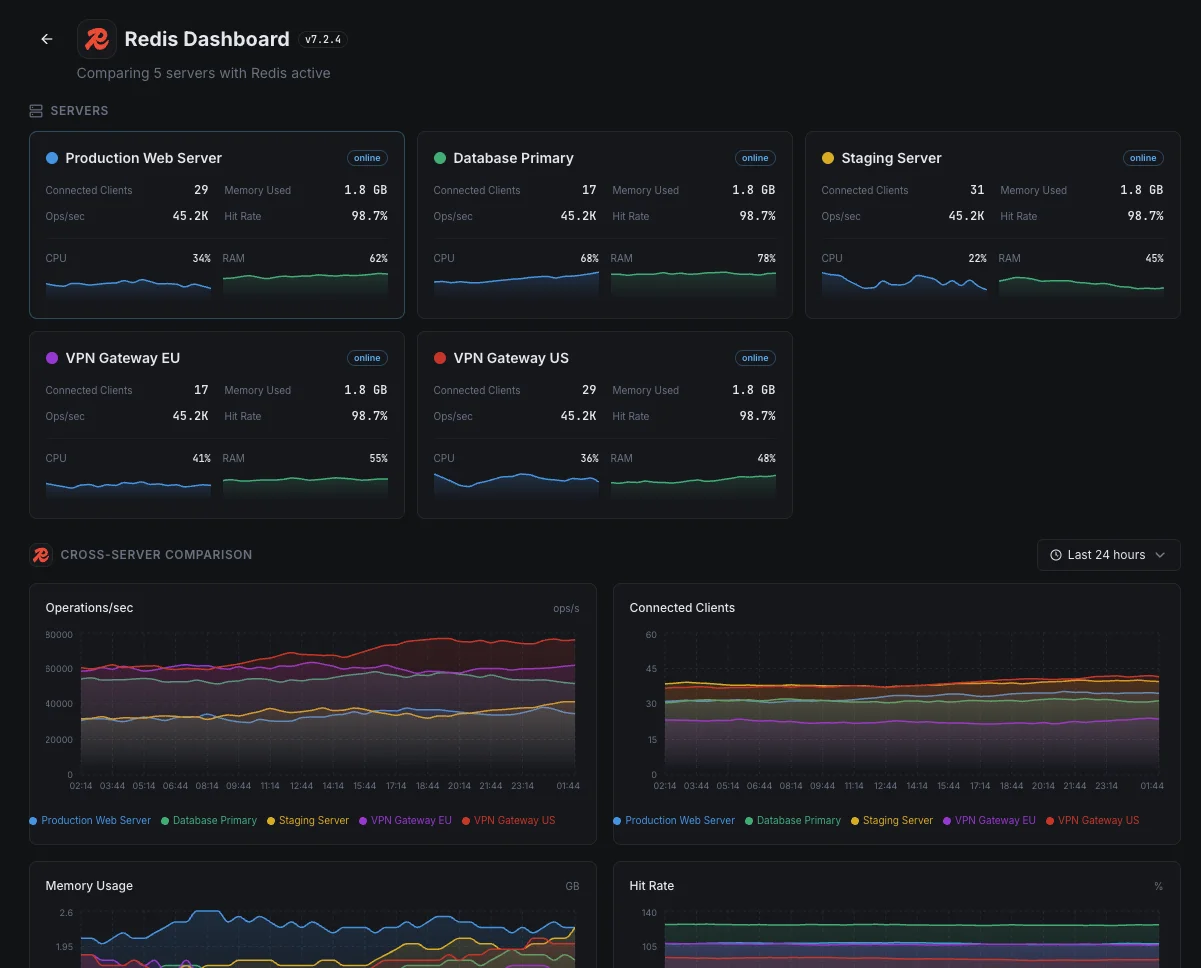
- Unified dashboard for servers, caches, and uptime
- Flexible alerting via Slack, PagerDuty, Telegram & more
- Historical data retention for capacity planning & audits
Common Redis monitoring scenarios
Where Redis typically runs today — and what could go wrong if no one's watching.
Speeding up a web app or API
Redis keeps web apps fast by remembering the results of repeated work. When the cache fills up or stops paying off, every request gets slower and the database underneath gets hammered. We catch the moment the cache stops protecting your app so the team can step in before users feel it.
High-availability cache split across servers
Production apps spread Redis across multiple servers so a single failure can't take the cache down. When the copies drift out of sync, the safety net is weaker than it looks. We catch the drift early so failover stays as invisible as it's supposed to be.
Logins, sessions, and rate-limiting
When Redis holds user sessions or enforces request limits, hitting its connection ceiling means users suddenly get logged out or blocked from the site. We surface the trend before the ceiling is reached, so it's resolved long before anyone calls support.
Prerequisites for Redis
Make sure you've got these in place — most installs are a 60-second job once they are.
- Redis 5.x or later (Redis 7.x or Redis 8 recommended) running on the host
- AUTH password if
requirepassis set (ACL user with+INFO,+SLOWLOG,+LATENCYperms also supported) - Network reachability from Xitogent to the Redis instance (default port 6379)
Get started in minutes
Install Xitogent on your server
If you haven't already, install the lightweight Xitogent monitoring agent on your server.
curl -s https://xitoring.com/install.sh | sudo bash -s -- --key=YOUR_API_KEYEnsure Redis INFO command is accessible
Xitogent uses the Redis INFO command to collect metrics. Make sure your Redis instance allows local connections:
redis-cli INFO server | head -5Enable the Redis integration
Use the Xitoring dashboard or CLI to enable the Redis integration. Xitogent will auto-detect your Redis instance.
sudo xitogent integrateConfigure alert thresholds (optional)
Set custom thresholds for metrics like memory usage, hit rate, or eviction count to get notified when something needs attention.
Verify it's working
Run this command on the server to confirm Xitogent picked up the integration. Fresh metrics will start streaming to your dashboard within ~30 seconds.
sudo xitogent statusConsidering alternatives?
See how Xitoring stacks up against the alternatives for Redis monitoring — flat pricing, deeper integrations, and one agent that covers your whole stack.


Frequently asked questions
What is Redis monitoring?
How do I use the Redis INFO command?
How do I monitor Redis memory fragmentation?
How do I track Redis cache hit ratio?
How do I detect Redis slow commands?
What is rejected_connections in Redis?
How do I monitor Redis replication?
Can I monitor Redis Cluster, Sentinel, KeyDB, and Valkey?
What Redis versions are supported?
Start monitoring Redis today
Set up in under 60 seconds. No credit card required. Full metrics from day one.
Start Free TrialKeep exploring