Docker container monitoring is the practice of tracking the health, performance, and resource consumption of running Docker containers in real time. It captures metrics like CPU, memory, network I/O, disk I/O, restart events, and health-check status across short-lived, dynamic container workloads — the visibility that traditional VM monitoring can't provide because containers spin up and tear down constantly, share the host kernel, and typically run as microservices.
In practice, monitoring Docker means collecting per-container metrics from the Docker daemon (or a sidecar agent), correlating them with host-level signals, and alerting on the conditions that actually matter in production: memory approaching the container limit, restart loops, unhealthy health checks, runaway CPU, and network anomalies. The rest of this guide explains what to measure, why each metric matters, and how to start monitoring Docker in minutes.
Docker is the most common runtime, but it isn't the only one — the same metrics and the same failure modes apply to containerd, Podman, CRI-O, and containers orchestrated by Kubernetes, because they all rely on the same underlying Linux kernel primitives. Where the tooling differs, this guide says so.
What is Docker?
Docker is a platform that makes it simpler to build, deploy, and execute programs utilizing containers. Containers enable a developer to bundle a program with all of its required components, including as libraries and other dependencies, and ship it all as a single package. This ensures that the program will operate on any other system, independent of any specific settings that may differ from the one used to write and test the code.
In a way, Docker is a bit like a virtual machine. However, unlike a virtual machine, rather than creating a whole virtual operating system, Docker allows applications to use the same Linux kernel as the system that they're running on and only requires applications be shipped with things not already running on the host computer. This gives a significant performance boost and reduces the size of the application.
The Docker platform use the Docker Engine to rapidly and effectively generate a small, portable, self-sufficient container from any application. The same container that a developer creates and tests on a laptop may operate at scale, in production, on virtual machines, bare metal, OpenStack clusters, public clouds, and other environments.
- Dockerfile: A script containing a series of commands a user could call on the command line to assemble an image.
- Docker images: Read-only templates used to build containers. Images are used to create Docker containers. Docker images can be built by anyone and can be composed in any way that makes sense for your application.
- Docker containers: The running instances of Docker images. Containers run the actual applications. A container includes an application and all of its dependencies. It shares the kernel with other containers, running as isolated processes in user space on the host operating system.
- Docker Hub/Registry: A public repository for Docker images. You can think of it as a GitHub for Docker Images. You can use Docker Hub to store and share your container images.
Docker makes it easier to speed up your process, allowing developers to experiment with multiple tools, application stacks, and deployment environments for each project.
Beyond Docker: containerd, Podman, CRI-O and Kubernetes
"Container monitoring" and "Docker monitoring" are often used interchangeably, but they aren't quite the same thing. Docker is one runtime among several, and if you're running anything other than plain Docker it's worth knowing what changes — and what doesn't.
What doesn't change: the metrics. Every Linux container runtime is built on the same two kernel features — cgroups for resource accounting and limits, namespaces for isolation. CPU throttling, memory limits, OOM kills, and I/O accounting all come from cgroups regardless of which runtime created the container. The metrics in the next section apply everywhere.
What changes: where you collect them from.
- containerd — the runtime Docker itself uses under the hood, and the default for most managed Kubernetes services. It has no
docker statsequivalent; you query it throughctr,crictl, or the CRI API. Agents that read cgroups directly from the host work unmodified. - Podman — daemonless and often rootless.
podman statsmirrors the Docker CLI, but rootless containers place their cgroups under the user slice rather than the system slice, so a monitoring agent running as a different user may see nothing at all. This is the most common reason "my containers don't appear" on Podman hosts. - CRI-O — Kubernetes-only, lightweight, queried via
crictl. Same cgroup story. - Kubernetes — adds an orchestration layer above whichever runtime is in use. Per-container metrics still come from cgroups (usually via cAdvisor, embedded in the kubelet), but the useful unit of analysis shifts from the container to the pod, deployment, and node. Kubernetes also introduces failure modes that don't exist in standalone Docker: pods stuck
Pendingbecause no node can satisfy their requests,CrashLoopBackOff, evictions under node memory pressure, and readiness probes failing while liveness probes pass.
The practical upshot: if you monitor at the host level — reading cgroup accounting and correlating it with host CPU, memory, disk, and network — you get consistent coverage across every runtime without per-runtime integrations. That's the approach Xitoring's Docker integration takes, and it's why the same agent covers containers regardless of what created them.
Importance of Monitoring your Docker Containers
Docker containers must be monitored for many different kinds of reasons, the most important of which are application performance, dependability, and security.
- Performance Optimization - Monitoring gives information on how containers use resources like as CPU, memory, disk I/O, and network bandwidth. This data is important for finding bottlenecks, evaluating application behavior under different loads, and tweaking container and host parameters to improve performance.
- Cost Management - By monitoring resource usage, organizations can make informed decisions about scaling their infrastructure up or down. Efficient resource utilization can lead to significant cost savings, especially in cloud environments where resources are billed by usage.
- Availability and Reliability - Ensuring that applications are available and reliable is critical for user satisfaction and business continuity. Monitoring tools can help detect and alert on issues like container crashes, restarts, or deployments that don’t behave as expected, allowing teams to quickly address problems before they affect users.
- Troubleshooting - When issues arise, having detailed metrics and logs at your disposal can significantly speed up troubleshooting and debugging processes. Monitoring allows you to track down the root cause of issues by providing historical data on system performance and application logs.
- Security - Monitoring containers can also enhance security by detecting anomalous behavior that could indicate a security breach. Additionally, for industries subject to regulatory compliance, monitoring can help ensure that logs are maintained appropriately for audit purposes.
- Capacity Planning - Monitoring trends over time assists in capacity planning, helping organizations to efficiently allocate resources and plan for future infrastructure needs. This is crucial for maintaining optimal performance and avoiding resource shortages or excessive overprovisioning.
- Improved Incident Response - With real-time alerts and detailed post-mortem analyses, monitoring improves the incident response times and the overall resilience of the system. It enables teams to proactively address issues, often before they impact the end user.
- Understanding User Behavior - By monitoring network traffic to and from containers, organizations can gain insights into user behavior and application usage patterns. This information can inform product development and marketing strategies.
- Lifecycle Management - In dynamic environments where containers are frequently created and destroyed, monitoring provides visibility into the lifecycle of containers, helping manage deployments, updates, and decommissioning processes more effectively.
Traditional monitoring methodologies are insufficient for containers due to their dynamic and ephemeral nature. Docker containers need particular monitoring solutions that take into consideration their short lifespans, high density, and the microservices architecture they frequently support. Monitoring Docker containers helps ensuring that applications supplied in containers run smoothly, are safe, and stay cost-effective. It is a must-have practice for any firm seeking to sustain high levels of operational excellence in a containerized environment.
What Metrics to Monitor Docker?
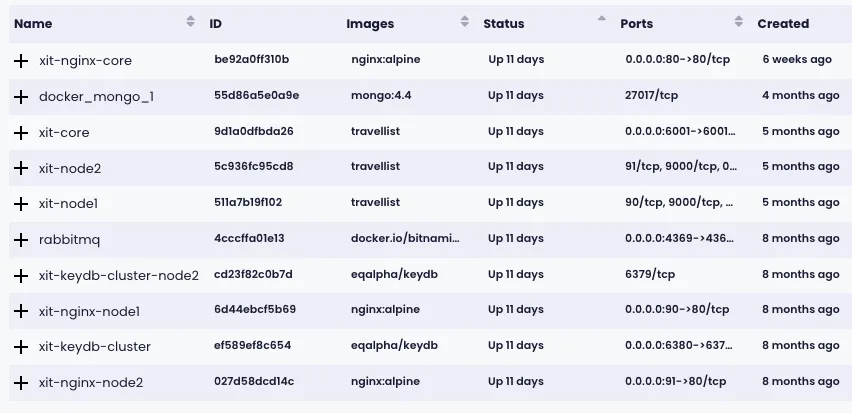
Monitoring Docker containers involves tracking various metrics to ensure they are performing optimally and to quickly identify any issues that may arise.
1. CPU Usage
- Total CPU Usage: The total CPU time consumed by the container.
- CPU Usage per Core: Useful for identifying uneven load distribution across cores.
- Monitoring CPU spikes and trends over time can help in identifying CPU-intensive processes and ensuring that containers are properly sized for their workloads.
2. Memory Usage
- Total Memory Usage: The amount of memory the container is using.
- Cache Memory: Memory used by the container for cache.
- Memory Swaps: Volume of memory swapped to disk from RAM, which can impact performance.
- Memory usage metrics are critical for preventing memory leaks and ensuring that containers have enough memory to function effectively without affecting other containers' performance.
3. Disk I/O
- Read/Write Operations: The number of read and write operations performed by the container.
- Read/Write Bytes: The amount of data read from and written to disk.
- Disk I/O metrics can help in identifying bottlenecks related to storage performance and ensuring that I/O-intensive applications have the necessary resources.
4. Network I/O
- Network Traffic: Incoming (received) and outgoing (transmitted) network traffic in terms of bytes or packets.
- Error Rates: The rate of network errors, such as dropped packets or collisions.
- Monitoring network I/O is important for understanding the communication patterns of your containers and identifying any network-related issues.
5. Container Health and State
- Start/Stop Events: Tracking when containers are started or stopped.
- Restart Count: The number of times a container has been restarted, which can indicate stability issues.
- Monitoring the state and health of containers is crucial for maintaining the availability and reliability of services.
6. Resource Limits and Reservations
- Memory/CPU Limits: The maximum amount of memory/CPU resources that a container can use.
- Memory/CPU Reservations: The guaranteed amount of memory/CPU resources allocated to a container.
- Monitoring resource limits and reservations helps in ensuring that containers have the resources they need without starving other containers or the host system.
7. Error Logs
- Application Logs: Errors or warnings logged by the application running inside the container.
- System Logs: Messages from the Docker daemon and container operating system.
- Monitoring logs is essential for troubleshooting and understanding the behavior of applications within containers.
Many of these metrics can be collected using Docker's built-in commands like docker stats and docker logs, as well as through external monitoring tools and services like Xitoring, and others. These tools often provide more detailed insights and visualization capabilities to help you better understand and manage your containerized environments.
Did you know you can monitor your Docker containers fully automated with Docker monitoring powered by Xitoring?
Best Docker Container Monitoring Tools in 2026
Choosing a Docker monitoring tool comes down to three trade-offs: how much of the stack you want to operate yourself, how much per-container detail you need, and whether you also want logs, traces, and alerting in the same place. Below is a side-by-side comparison of the most-used options in 2026.
| Tool | Type | Best for | Strengths | Weakness |
|---|---|---|---|---|
| Docker stats / Docker API | Built-in CLI | Ad-hoc inspection | Free, zero install, available on every host | No history, no alerts, no UI |
| cAdvisor | Open-source | Self-hosted setups | Per-container metrics with low overhead | Metrics-only; needs Prometheus + Grafana for storage and dashboards |
| Prometheus + Grafana | Open-source stack | Teams already on Kubernetes / Prometheus | Flexible PromQL queries, huge community, fully self-hosted | You operate the stack — storage, retention, HA |
| Netdata | Open-source + cloud | Single-host real-time visibility | Real-time charts, auto-discovery, free tier | Less mature for multi-host alerting workflows |
| Datadog | Managed SaaS | Mid-to-large engineering orgs | 800+ integrations, APM + logs + metrics + security in one platform | Cost scales aggressively with container count |
| Sysdig Monitor | Managed SaaS | Security-focused container teams | Deep kernel-level telemetry, runtime security signals | Premium pricing, steeper learning curve |
| Xitoring | Managed SaaS | Teams that want monitoring + alerting without DIY | Auto-discovery via Xitogent, 1-minute metric intervals, 20+ alert channels, transparent pricing | Smaller integration catalog than Datadog |
How to choose a Docker monitoring tool
- Stick with
docker statsor the Docker API if you only need a quick CPU/memory glance and run a handful of containers. - Pick cAdvisor + Prometheus + Grafana when you already operate Prometheus or Kubernetes and want everything inside one observability stack.
- Pick a managed SaaS (Xitoring, Datadog, Sysdig, Netdata Cloud) when you'd rather spend engineering time on your product than on running a monitoring stack — and you want alerting, escalation, and historical retention out of the box.
- Pick Xitoring specifically if you want one-command setup, predictable pricing, and alerting bundled in — without the per-container cost surprises common to enterprise APM tools.
How to start Monitoring Docker?
In few steps, you can start monitoring your Docker Containers and alot of more integration on your servers with Xitoring. For getting started follow following simple steps
- Sign up for a 30-day trial to use Docker monitoring.
- Register your server by following the steps explained in the dashboard
- Use "xitogent integrate" to activate Docker Integration on your server.
- You are now monitoring your Docker Containers succesfully.
More information about Docker integration is listed in our Xitoring Docker integration docs.
Frequently Asked Questions
What is container monitoring?
Container monitoring is the continuous collection of health, performance, and resource metrics from running containers — CPU, memory, network I/O, disk I/O, restart counts, and health status. It applies to any Linux container runtime (Docker, containerd, Podman, CRI-O) because they all use the same kernel cgroup accounting, and it differs from traditional server monitoring in that containers are ephemeral, densely packed, and identified by labels rather than hostnames.
What's the difference between container monitoring and Docker monitoring?
Docker monitoring is container monitoring applied to one specific runtime. The metrics are identical across runtimes because they come from Linux cgroups; what differs is the collection interface — docker stats for Docker, podman stats for Podman, crictl for containerd and CRI-O. Host-level agents that read cgroups directly work across all of them without per-runtime configuration.
How do you monitor container memory usage?
Track memory usage as a percentage of the container's configured limit, not as an absolute figure — an absolute number tells you nothing without the limit it's measured against. The signal that matters is proximity to the limit, because exceeding it triggers an OOM kill rather than swapping. Watch the container's restart count alongside memory: a container repeatedly restarting near its memory ceiling is being OOM-killed, which is the single most common container failure in production. docker stats shows current usage and limit; a monitoring agent adds the history you need to see the trend before the kill.
Does container monitoring work with Kubernetes?
Yes. Kubernetes doesn't replace container metrics, it adds a layer above them — per-container cgroup data still comes from the kubelet's embedded cAdvisor. What Kubernetes adds is orchestration-level state worth monitoring separately: pod phase, CrashLoopBackOff, pending pods that no node can schedule, node memory pressure and evictions, and readiness versus liveness probe status.
What is Docker container monitoring?
Docker container monitoring is the continuous collection of health, performance, and resource metrics — CPU, memory, network I/O, disk I/O, restart counts, and health-check status — from each running Docker container. Because containers are short-lived and share the host kernel, they require tooling built for ephemeral, microservice-style workloads rather than traditional server monitoring.
Why is monitoring Docker containers important?
Containers fail differently than virtual machines. They get OOM-killed when they hit memory limits, enter restart loops on configuration errors, and disappear before you can SSH in to investigate. Monitoring catches these failure modes in real time and preserves the metrics and logs you need to root-cause incidents after the container is gone.
What metrics should you monitor in Docker containers?
The core set is CPU usage per container, memory usage versus the configured limit, network RX/TX bytes, disk read/write I/O, restart count, container health-check status, and container uptime. Beyond that, watch PID counts (to catch fork bombs), block I/O latency, and the lifecycle events (start, stop, die, kill) emitted by the Docker daemon.
What's the difference between Docker monitoring and traditional server monitoring?
Traditional monitoring assumes long-lived hosts with stable identities. Docker containers are ephemeral — they come and go, share the host kernel, and are often labelled rather than named. Docker monitoring tools auto-discover containers, tag metrics by image and label, and correlate per-container data with host-level signals so you can debug a microservice without losing context when the container is rescheduled.
What tools can you use to monitor Docker containers?
The common stacks are Prometheus + cAdvisor + Grafana for self-hosted setups, the Docker daemon's built-in /stats API for ad-hoc inspection, and managed platforms like Xitoring, Datadog, or Netdata for full-feature alerting and dashboards out of the box. Pick managed if you want zero-ops and built-in alerting; pick the open-source stack if you already operate Prometheus.
Is Docker container monitoring free?
Yes — you can monitor Docker for free using docker stats, the Docker daemon's metrics endpoint, or open-source stacks like Prometheus + cAdvisor + Grafana. Managed platforms typically offer a free tier (Xitoring includes Docker monitoring on the free plan); paid tiers add longer retention, more notification channels, and team features.
How do I start monitoring Docker containers with Xitoring?
Install Xitogent on the Docker host with a single command, run sudo xitogent integrate to enable the Docker integration, and Xitogent auto-discovers every running container and starts tracking CPU, memory, network, restarts, and health in 1-minute intervals — no per-container configuration required. See the full walkthrough on the Docker monitoring integration page.