Monitor Alles Du läufst
Von Webservern und Datenbanken bis hin zu Containern und VPNs – der Agent von Xitoring erkennt Ihre Infrastruktur automatisch und beginnt innerhalb weniger Minuten mit der Erfassung von Metriken.
Integrationen ganz einfach einrichten Innerhalb einer Minute
Xitoring bietet schnelle und zuverlässige Serverüberwachungsintegrationen für Windows und Linux, sodass Sie ohne zusätzliche Software oder manuelle Konfiguration eine Verbindung herstellen und Optimierungen vornehmen können.
No Extra Software
Everything runs through the lightweight Xitogent agent already installed on your server. No additional dependencies.
No Manual Configuration
Integrations are auto-discovered and pre-configured. Just enable them and start receiving metrics instantly.
Windows & Linux
Full support for both platforms with identical feature parity. One agent, every operating system, all your services.
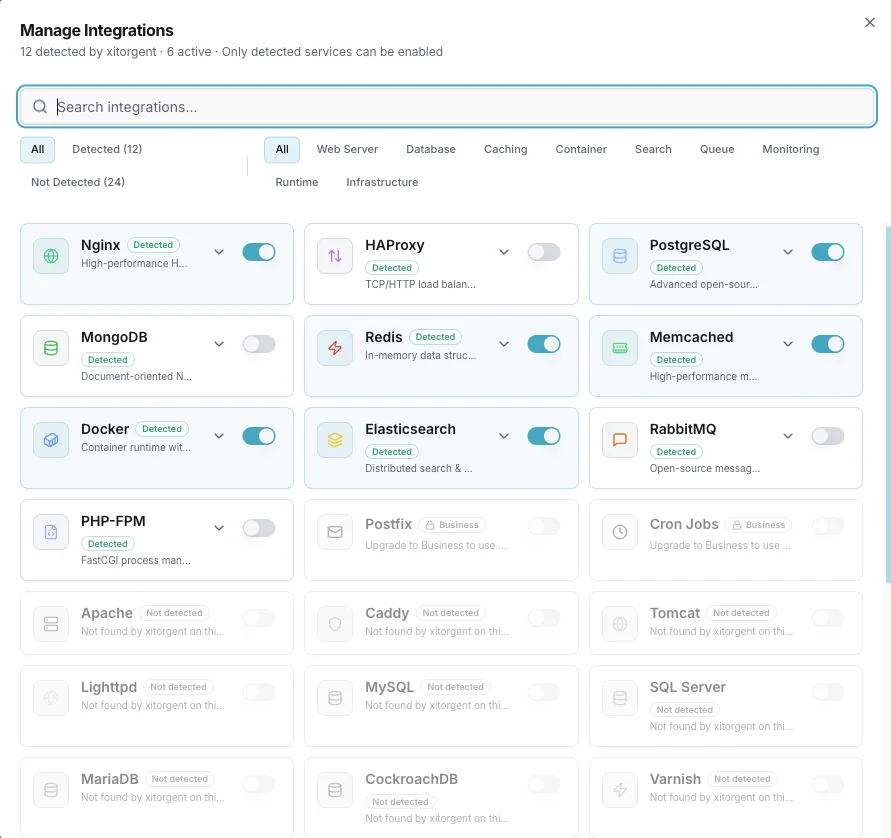
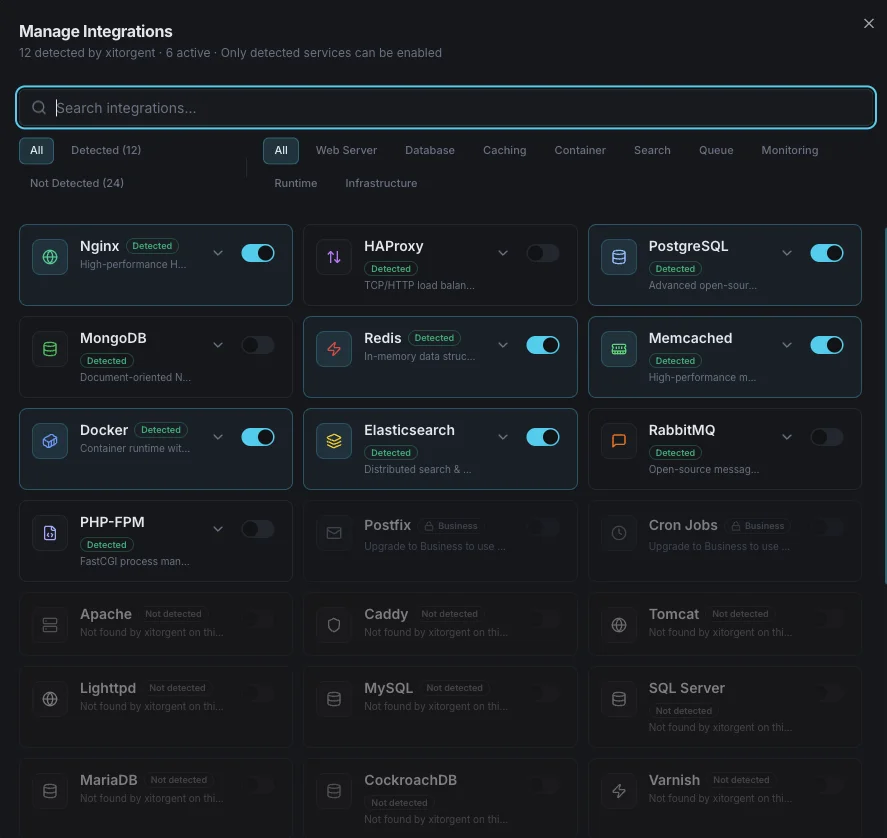
Seamless Integration Control via UI
Enable, configure, and manage all your integrations directly from the Xitoring dashboard. No terminal needed — just a few clicks to start monitoring any service on your server. Toggle integrations on and off, set custom thresholds, and view real-time status all from a single, intuitive interface.
Powerful Integration Control via CLI
Prefer the command line? Use Xitogent CLI to enable integrations, adjust thresholds, and automate setup across your entire fleet with simple, scriptable commands. Perfect for DevOps teams who manage infrastructure as code and need repeatable, automated workflows.
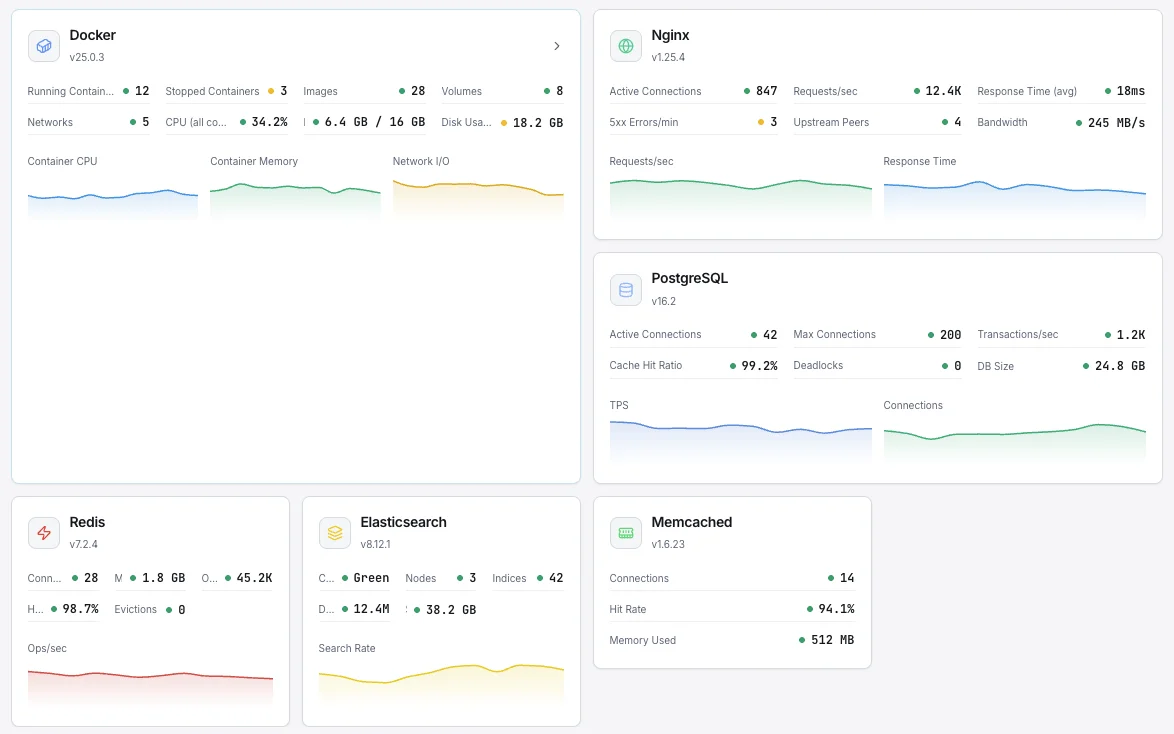
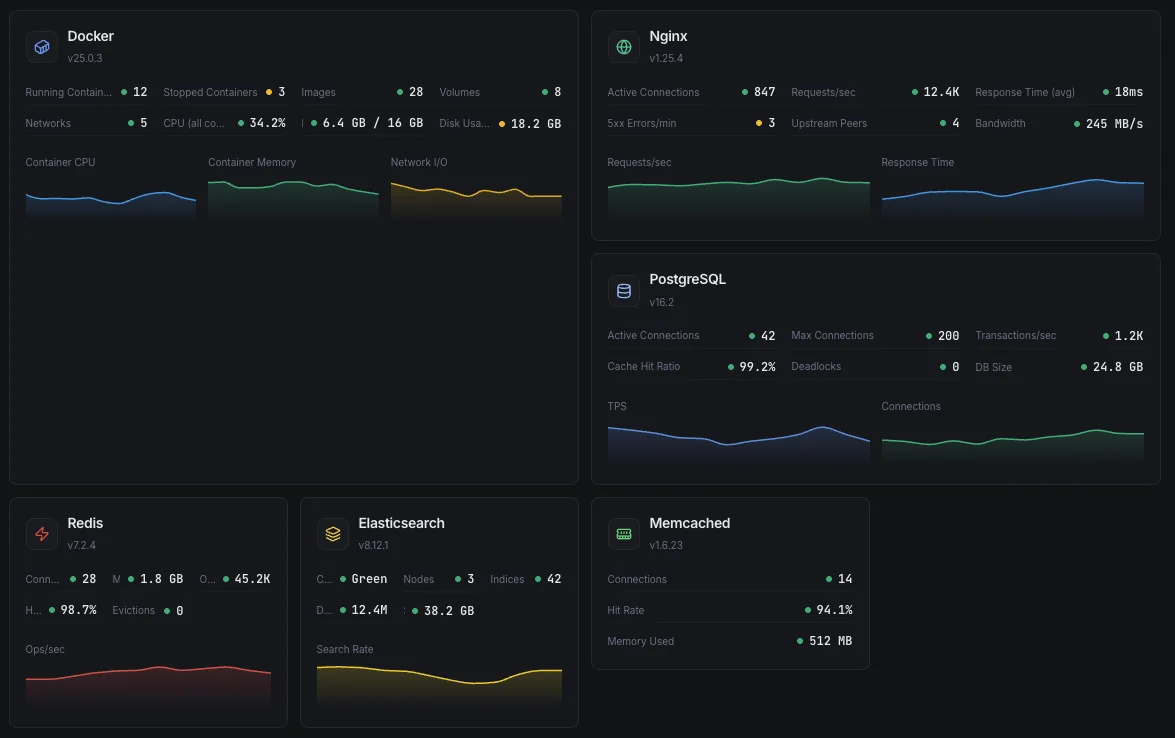
Complete Metrics Monitoring at Your Fingertips
Every integration delivers real-time metrics, historical trends, and customizable alerts. From CPU usage and database queries to queue depths and VPN tunnel status — everything is visualized in one unified, powerful dashboard that keeps your team informed.
Anzeige der „30“-Integration s
Web- und Anwendungsserver
Überwachen Sie Ihre Web-Infrastruktur mit detaillierten Kennzahlen zu Anfrageraten, Antwortzeiten und Verbindungsstatus.
Verfolgen Sie die Größe der E-Mail-Warteschlangen, die Zustellraten und die Verbindungsdaten Ihrer E-Mail-Infrastruktur.
Datenbanken
Überwachen Sie die Abfrageleistung, den Replikationsrückstand, die Verbindungen und den Speicherplatz in Ihrer gesamten Datenbankschicht.
Datensysteme
Track-Caching, Nachrichtenwarteschlangen, Suchmaschinen und Infrastruktur für Zeitreihendaten.
DNS-Server
Beobachten Sie die DNS-Abfragefrequenz, die Cache-Trefferquote und die Latenz bei der Auflösung.
Netzwerk- und Proxy-Dienste
Verschaffen Sie sich einen Überblick über Proxy-Backends, Verbindungszustände und Netzwerk-Socket-Statistiken.
Container und Systemzustand
Verfolgen Sie die Auslastung von Container-Ressourcen, SMART-Daten der Festplatten und Zustandsindikatoren auf Systemebene.
VPN
Überwachen Sie den Tunnelstatus, die verbundenen Clients und den Durchsatz Ihrer VPN-Infrastruktur.
Ist dein Stapel nicht dabei?
Wir fügen ständig neue Integrationen hinzu. Teilen Sie uns mit, was Sie benötigen, und wir werden dies vorrangig behandeln.