By default, Xitoring monitors your servers and uptime checks from every probing node in our global network. That's the right answer for most public-facing services: when a node anywhere on the planet sees an outage, you want to know. But for a growing number of teams it's the wrong answer — they need to monitor only from specific regions, not all of them.
We're rolling out region selection: per-check control over which probing nodes verify each server and each uptime check.
Quick Glance
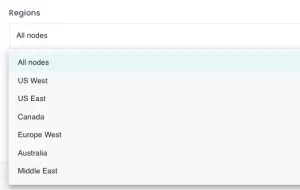
The picker lives directly inside the Add Server and Add Uptime Check screens, plus the settings of any existing check. Pick one region, several, or all of them — your choice per check.
Why Region Selection Matters
A single global average hides what your real users actually experience. Region selection lets you get specific:
- Latency-sensitive applications. If your audience is concentrated in one region — say, a German SaaS sold mostly inside the EU — checks from Sydney or São Paulo report meaningless RTTs that just clutter your graphs. Pin those checks to EU nodes and the latency numbers reflect what your customers see.
- Data residency and compliance. Regulated workloads often need to stay inside a specific geography. If a service is restricted to the EU or to North America, monitoring traffic should respect the same boundary. Region selection makes that easy.
- Internal services and private networks. Some servers are only reachable from a specific region's egress IPs (VPN gateways, allowlisted bastion hosts, regional load balancers). Picking the right node makes the check actually run; picking the wrong one makes it look like the service is permanently down.
- Regional outage detection. Run separate checks against the same endpoint from different regions. When EU nodes see green and US nodes see red, you've isolated the problem to a specific Cloudflare PoP, ISP, or regional dependency in seconds.
- Performance baselining. Comparing response times across regions tells you where to spin up the next CDN edge or regional replica. The data is already in your dashboard once region-pinned checks run for a few days.
Available Regions
The Xitoring probing network spans North America, Europe, Asia, the Middle East, and Oceania. As of this release, you can pick from regions including West EU, Central EU, US East, US West, Canada, Australia, and the Middle East. The full list of probing nodes — including new locations as they come online — lives on our monitoring nodes page.
How to Configure Region Selection
Setup is a single step inside the check editor:
- Open your Xitoring dashboard and click Add Server or Add Uptime Check (or open an existing check's settings).
- Scroll to the Regions section.
- Pick one or more regions. Leave them all selected to keep the default global behavior.
- Save the check. The next monitoring cycle will run only from the regions you chose.
Region changes apply on the next check interval, so there's no downtime or reconfiguration required.
Common Patterns
A few setups we see often:
- Two checks for the same URL — one pinned to your customers' region (latency baseline), one global (outage detector). Different alert thresholds on each.
- Separate uptime checks per geo segment — e.g., a status page that shows EU-region availability and US-region availability separately, powered by region-pinned checks behind a public status page.
- Compliance-bounded monitoring — for services restricted by data residency rules, only the in-region nodes run the check, so monitoring traffic never crosses jurisdictional boundaries.
Try It
Region selection is available now on every Xitoring plan, including the free tier. Open any uptime check or server in your dashboard and pick the regions that match your audience — or register for free and start monitoring up to five servers and 20 uptime checks at no cost.
We'd love to hear how you're using it. If region selection unlocks a new monitoring strategy for your team, send us a note at support@xitoring.com.