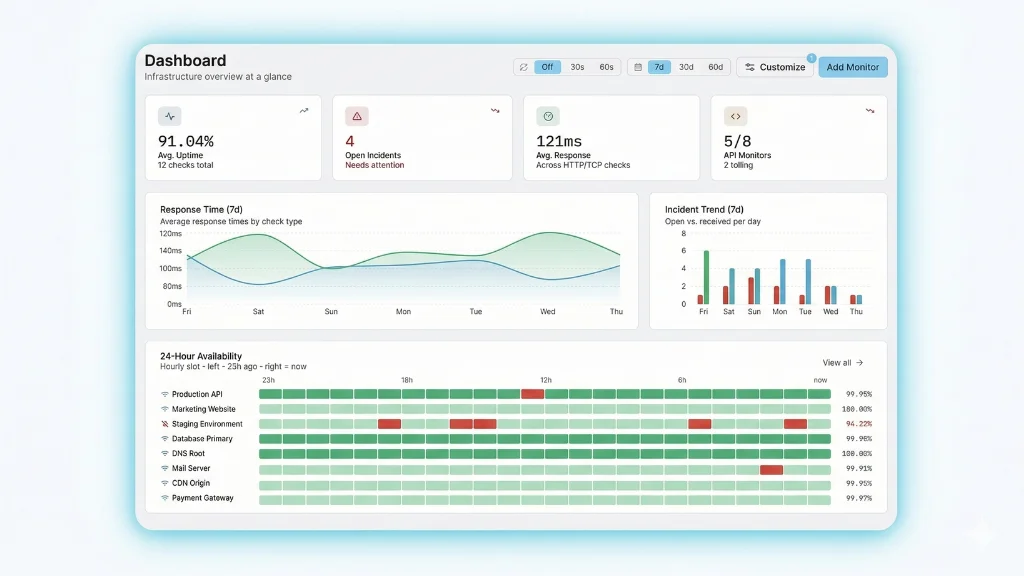
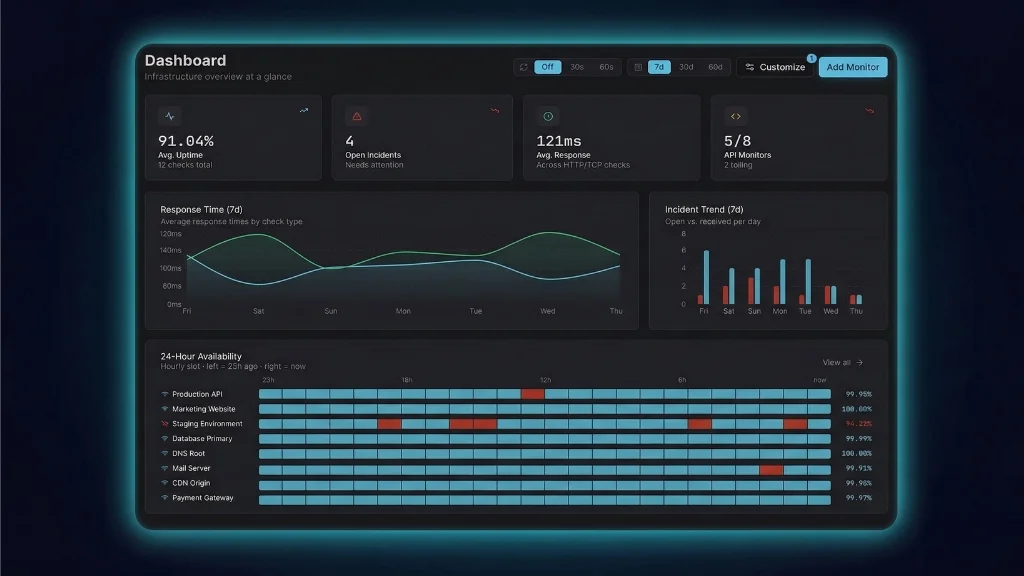
Custom Dashboards Built Your Way
Design tailored dashboards with the widgets that matter to you. Mix server metrics, uptime response times, SSL expiry, and integration graphs into one synchronized view — and share it across your team or with sub-accounts.
Everything you need to build the perfect view
Custom dashboards give you complete control over what you see and how you see it — built for SREs, DevOps teams, agencies, and managed service providers.
Configurable Widgets
Add unlimited widgets for servers, uptime checks, and integrations. Choose the metric, time range, and graph type for every widget independently.
Flexible Layouts
Switch between 2, 3, and 4-column grid layouts to match the size of your screen, the density you prefer, or the story you want to tell.
Synchronized Graphs
Hover over one graph and every widget on the dashboard follows along — making it effortless to correlate spikes and incidents across systems.
Multiple Dashboards
Create separate dashboards per environment, team, customer, or service. Set a default, switch between them with one click.
Shared Dashboards
Share dashboards with sub-accounts so clients, colleagues, or stakeholders see exactly the view you've designed for them.
Period Filters & Auto-Refresh
Pick from 30 minutes to 30 days of history and set an auto-refresh interval that fits your workflow — from real-time NOC to once-a-day reviews.
Visualize any metric, from any source
Every widget is independent. Mix and match to build a dashboard that reflects exactly what your team needs to see.
Server Metric Graphs
CPU, memory, swap, disk, network, load average, and process counts from any Linux or Windows server running Xitogent.
Uptime Response Times
Response-time trends and uptime history for HTTP, HTTPS, Ping, DNS, TCP, UDP, SMTP, IMAP, POP3, FTP, and SSL checks.
Integration Graphs
Data from 30+ auto-discovered services and integrations including Nginx, Apache, MySQL, PostgreSQL, Redis, MongoDB, Docker, and more.
SSL & Domain Status
Track certificate validity and expiry countdowns alongside the rest of your infrastructure — no separate tool, no separate tab.
Multi-Server Comparisons
Stack metrics from multiple servers in one graph to spot the outlier, validate a rollout, or compare regions side by side.
Custom Time Ranges
Investigate a specific incident, compare last week to this week, or zoom out for a 30-day capacity-planning view — per widget or per dashboard.
From blank canvas to live dashboard in minutes
No SQL. No query language. No complex configuration files — just point, click, and visualize.
Create a Widget
From any dashboard, open settings and select "Create a New Widget." Name it so your team knows exactly what it tracks.
Pick the Data
Choose Server or Uptime as the widget type, then select the specific server, check, or integration metric you want to visualize.
Arrange & Share
Drag widgets into place, switch layouts, set the auto-refresh interval, then share the dashboard with sub-accounts or set it as your team default.
Dashboards for every team and workflow
From single-developer side projects to multi-tenant managed service providers — custom dashboards scale with you.
NOC & Operations
A wall-mounted dashboard with the 12 most critical servers, color-coded by health, refreshing every 30 seconds.
Incident War Rooms
Spin up an investigation dashboard with affected services, dependent integrations, and historical comparison — all synchronized.
Customer Reporting
Create a dashboard per customer or sub-account and share it directly — they see uptime, response times, and SLA-relevant metrics.
Capacity Planning
30-day trend views of CPU, memory, and disk across your fleet to decide what needs scaling before it becomes urgent.
Ready to stop guessing?
Start monitoring your infrastructure in under 60 seconds. No credit card required.
Free plan available • No credit card required • Setup in 60 seconds
Custom dashboard FAQs
Common questions about building, sharing, and getting the most out of custom dashboards in Xitoring.