Website
Monitoring
All-in-one website monitoring for uptime, page speed, SSL certificates, and content changes — checked every minute from 15+ global probing nodes. Free plan with 20 monitors, no credit card required.
Social Proof
Trusted by thousands — rated on
See what real users say about Xitoring on the world's top review platforms.




What is website monitoring?
Website monitoring combines uptime checks, page-load measurement, and user-experience signals into a single observation layer for public-facing sites and web applications. Beyond verifying that pages return HTTP 200, modern website monitoring measures Time to First Byte, full page load time, render-blocking resources, and Core Web Vitals (Largest Contentful Paint, Interaction to Next Paint, and Cumulative Layout Shift) from real-browser probes in geographically distributed nodes. It also covers transactional flows — login, checkout, search — that span multiple URLs and break in ways a single-URL check would miss.
Key Features
Everything you need for Website Monitoring.
24/7 Uptime Checks
Monitor website availability with 1-minute interval checks from 15+ global nodes. Detect downtime within seconds — before your visitors do.
Page Speed Tracking
Track real response times and page load speeds over days, weeks, and months. Identify slowdowns before they hurt SEO rankings or conversions.
SSL Certificate Monitoring
Get warned before SSL certificates expire, expose chain issues, or trigger browser warnings. Avoid the worst kind of avoidable outage.
Multi-Step Transactions
Monitor login flows, checkout funnels, and sign-up forms with scripted multi-step transaction checks. Confirm critical user journeys actually work.
15+ Global Locations
Test your website from North America, Europe, Asia-Pacific, South America, and the Middle East. Catch regional outages and CDN issues fast.
Smart Alerts, Zero Noise
Multi-node confirmation eliminates false positives. Get alerted via email, SMS, WhatsApp, Slack, Telegram, PagerDuty, and 20+ more channels.
Powerful Website Check Capabilities
Everything you need to monitor a website end-to-end — from a single TLS handshake to a multi-step checkout flow.
Group Management
Organize at scale
Group checks by website, environment, or team. Nest groups, share access, and keep large fleets of monitors structured.
Paste a cURL
Zero-config setup
Paste any cURL command to auto-create an HTTP check — headers, body, auth, and method are all carried over automatically.
Incident Policies
Right team, right time
Route alerts to the right people based on website, severity, or time of day. Escalate automatically if no one acknowledges.
1-Minute Intervals
Detect fast
Get alerted within 60 seconds of an outage — not 5 minutes later. Optional 30-second intervals on paid plans.
Incident Timeline
Full audit trail
Every incident is logged with response time graphs, error codes, and team notes — perfect for postmortems and SLA reports.
Bulk Actions
Manage at scale
Create, pause, resume, or delete hundreds of website monitors at once. Save hours when migrating or restructuring.
Advanced HTTP Mode
Real-world checks
Custom headers, basic/bearer auth, JSON body, keyword matching, and status code rules — model real user requests precisely.
Root Cause Analysis
Skip the guesswork
Plain-English incident reports tell you exactly why your site went down — DNS, TLS, timeout, 5xx, or content mismatch.
Every Website Check You Need
From a single ping to a full e-commerce flow.
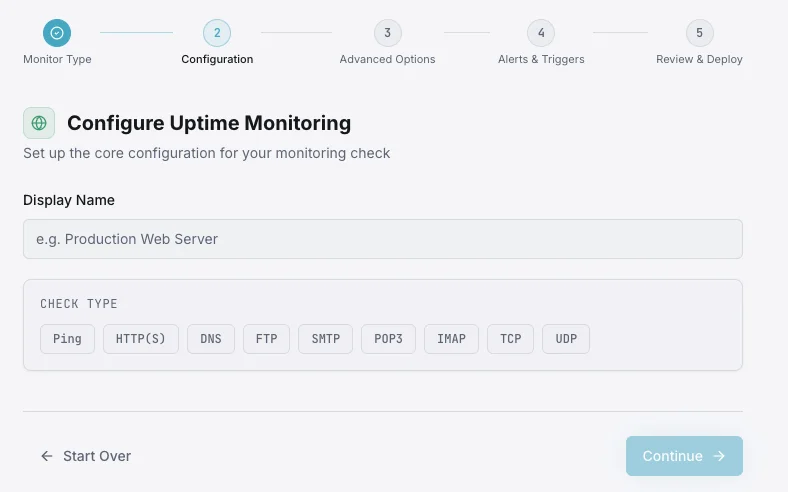
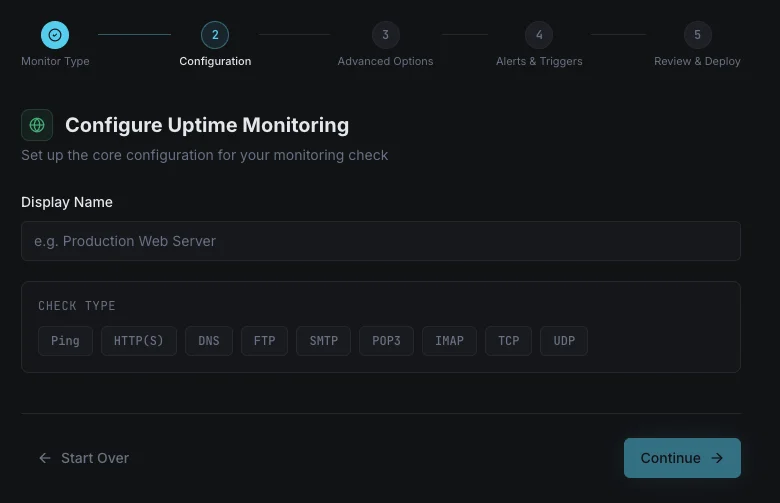
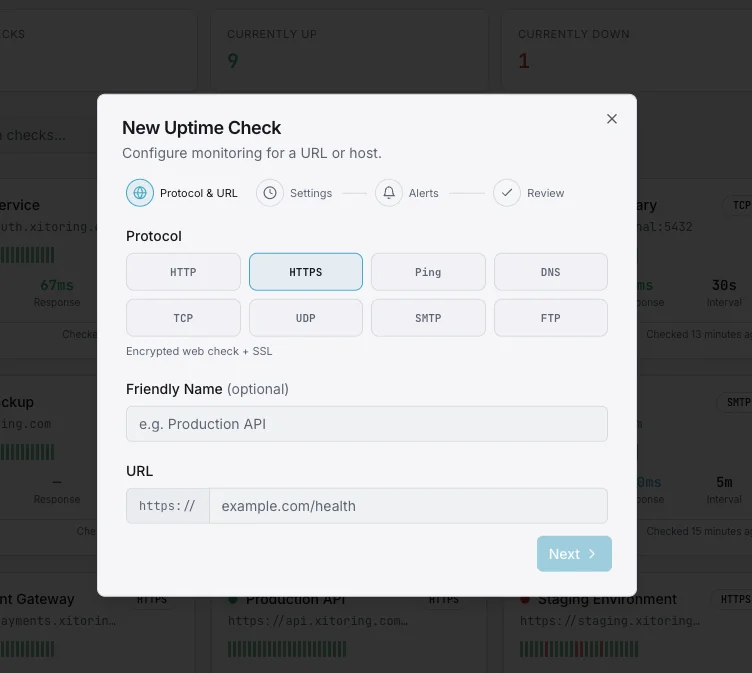
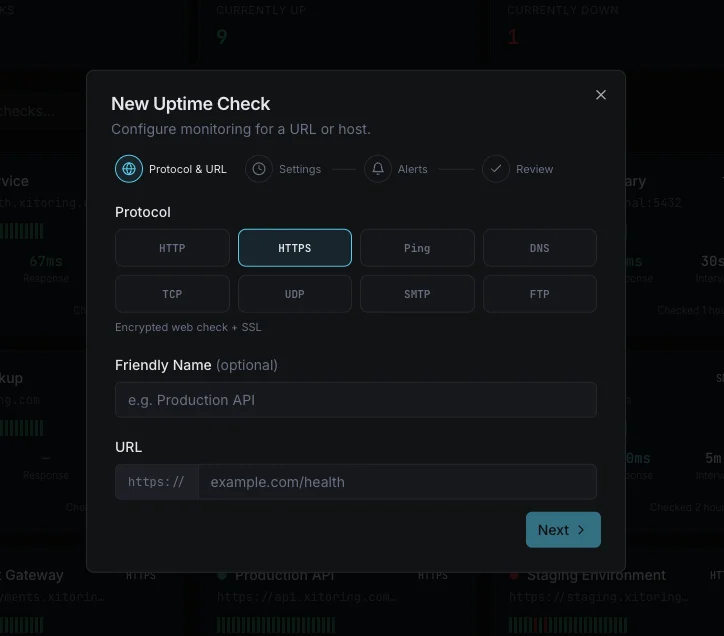
Xitoring's free plan includes 20 monitors at no cost. HTTP/HTTPS, DNS, SSL, ping, and keyword checks are configurable in seconds, with custom alerting per check. Repeated incidents, fault tolerance, and per-region rules are built in — not paywalled.
Website Health Overview
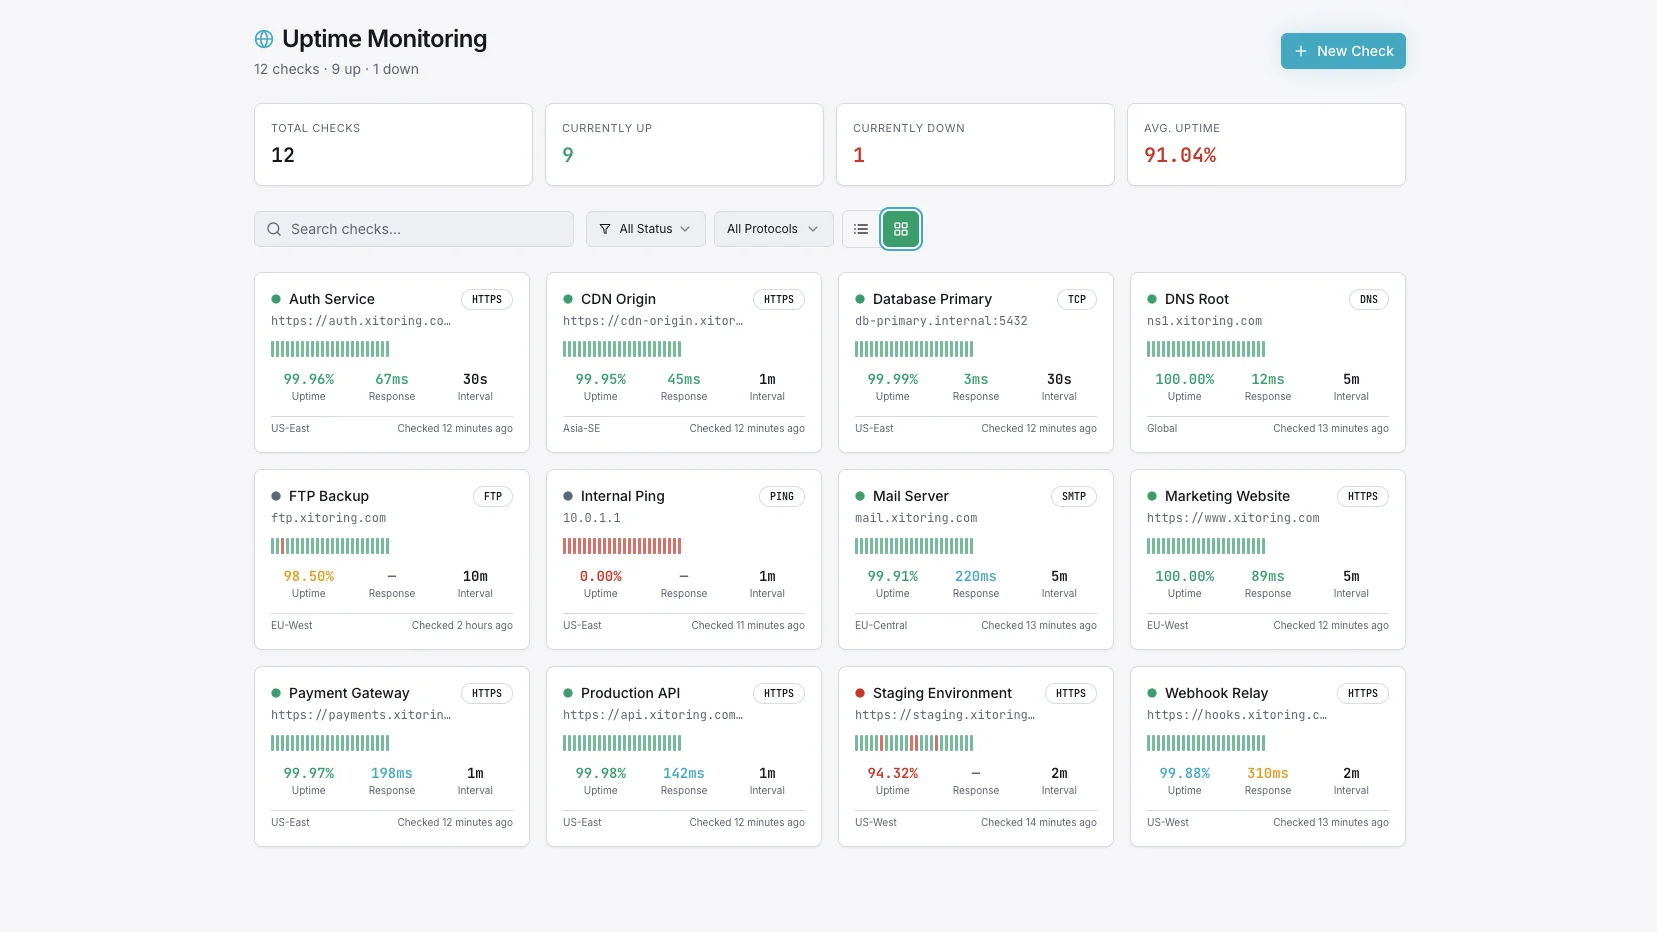
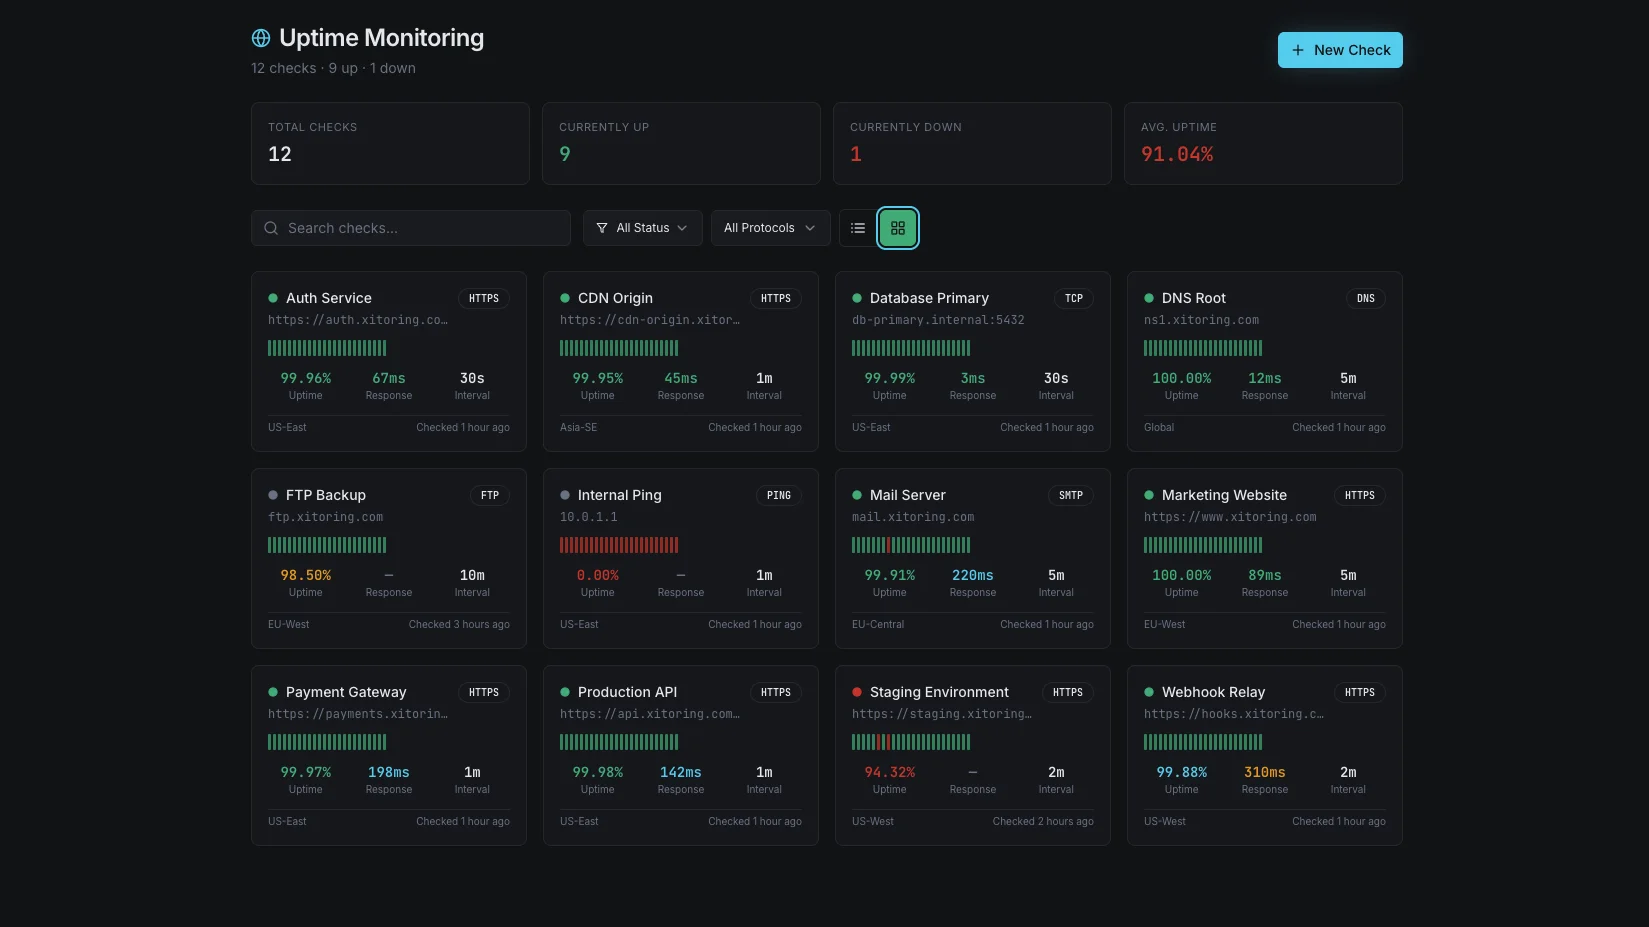
Every website you monitor — visible at a single glance.
Every Site at a Glance
All your websites, grouped or flat, with current status, response time, uptime percentage, and historical incident counts in one view.
Live Wall Mode
Pin a NOC-style wall view to a TV in your office. The instant a check fails, you see it without opening a tab.
Group by Anything
Nest websites under groups and sub-groups — country/city, customer/environment, datacenter/region. Whatever fits your operations.
Daily Status Heatmap
See which website had downtime on which day at a glance — perfect for weekly reviews and SLA reporting.
Who it's for
Website Monitoring Use Cases
See how teams across industries use Xitoring to keep their infrastructure reliable.
E-Commerce & Retail
Monitor product pages, carts, checkout funnels, and payment gateways. Catch regional outages before lost sales pile up during peak hours.
SaaS & Web Apps
Track login pages, dashboards, and API endpoints. Meet SLA commitments with auditable uptime data and root-cause incident logs.
Blogs & Media
Keep traffic — and ad revenue — flowing. Monitor article pages and CDN performance from every region your readers come from.
Education & LMS
Ensure learning platforms, video portals, and registration systems stay online during enrollment surges and exam windows.
Government & Finance
Monitor citizen-facing portals and banking dashboards with multi-node verification, audit trails, and SLA-grade reporting.
Hosting & MSPs
Monitor every client website from a single dashboard. Prove SLA compliance with automated, branded uptime reports.
Why Website Monitoring Matters
Every minute your site is down costs revenue, kills SEO rankings, and erodes customer trust. Without proactive website monitoring, you're relying on visitors to tell you something is broken — and by then, they're already gone.
- Downtime costs SMBs an average of $427 per minute
- Detect website outages from 15+ regions before users notice
- Multi-node verification eliminates false positives
- Historical uptime data for SLA and SEO reporting
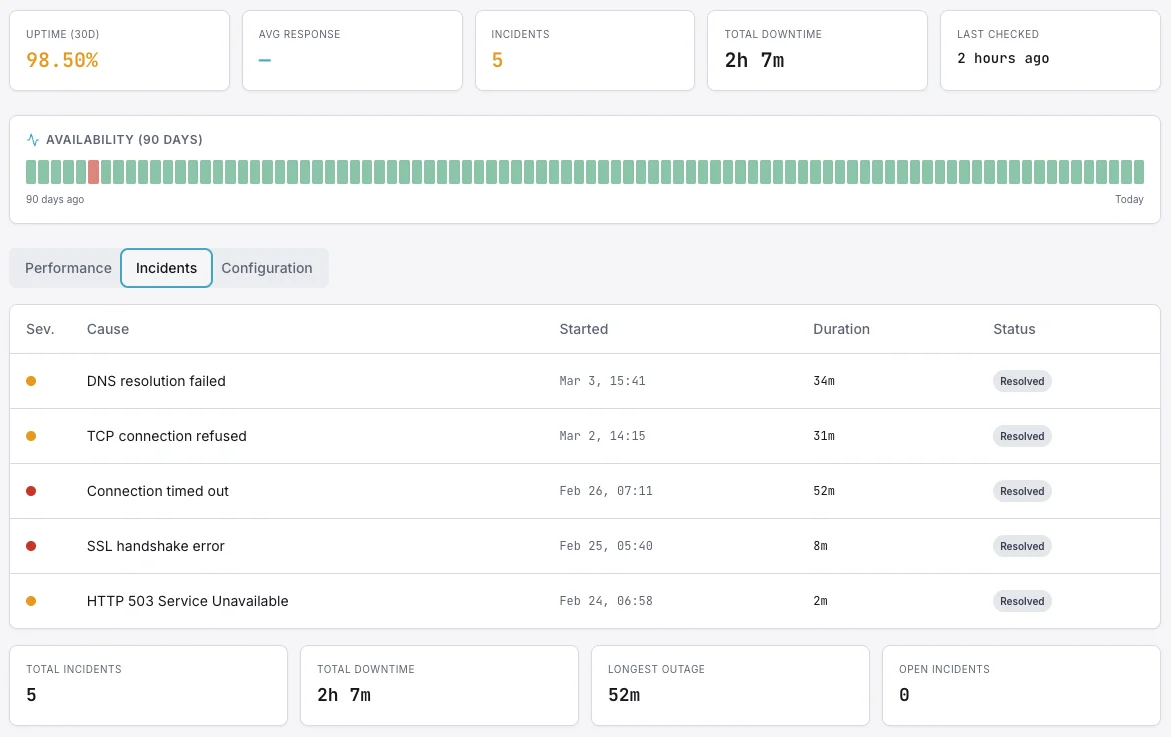
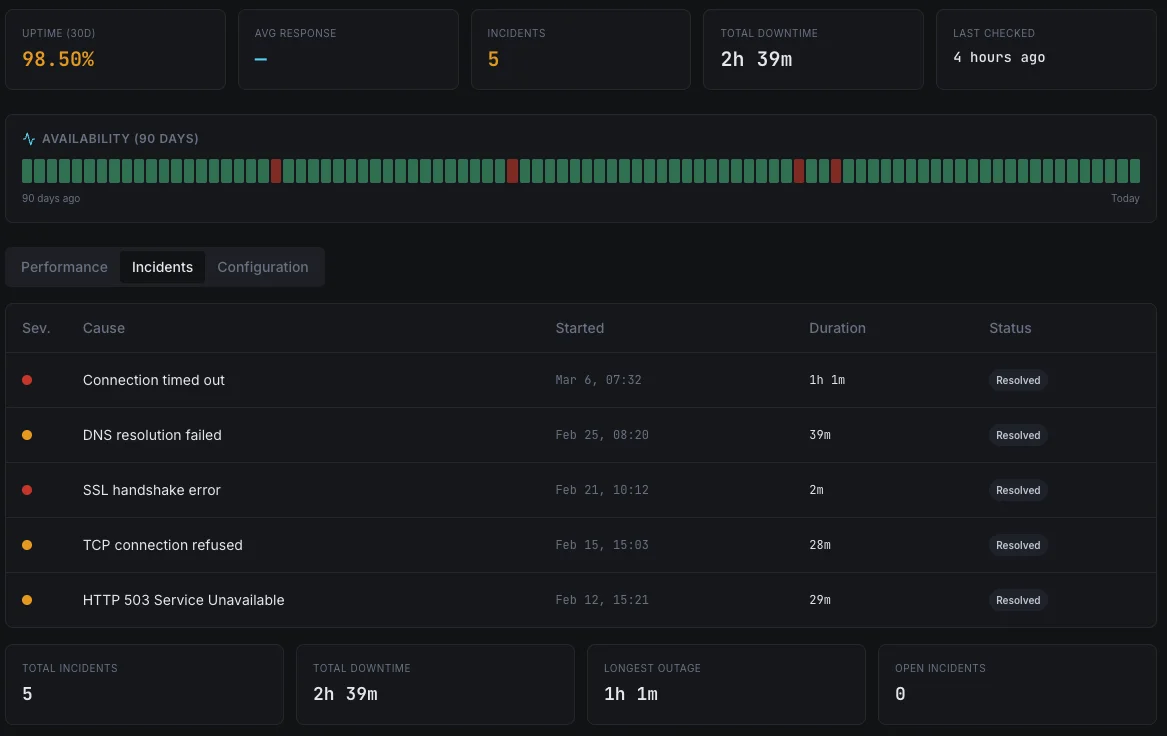
All-In-One Website Dashboard
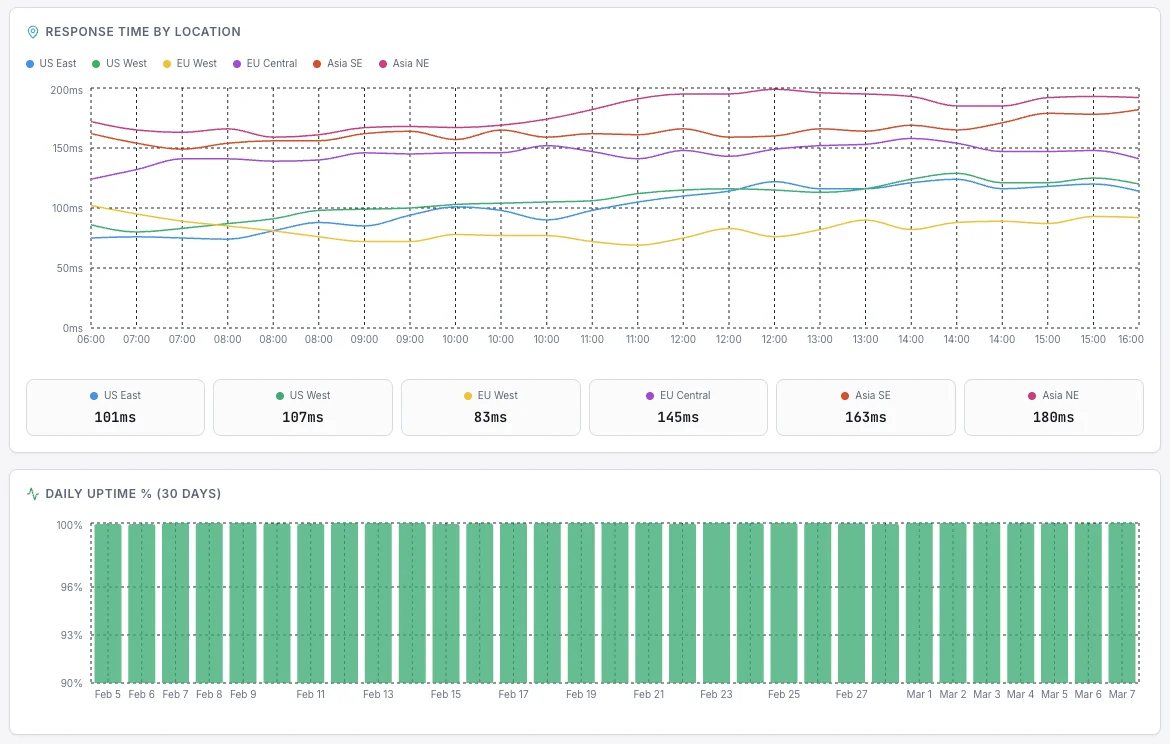
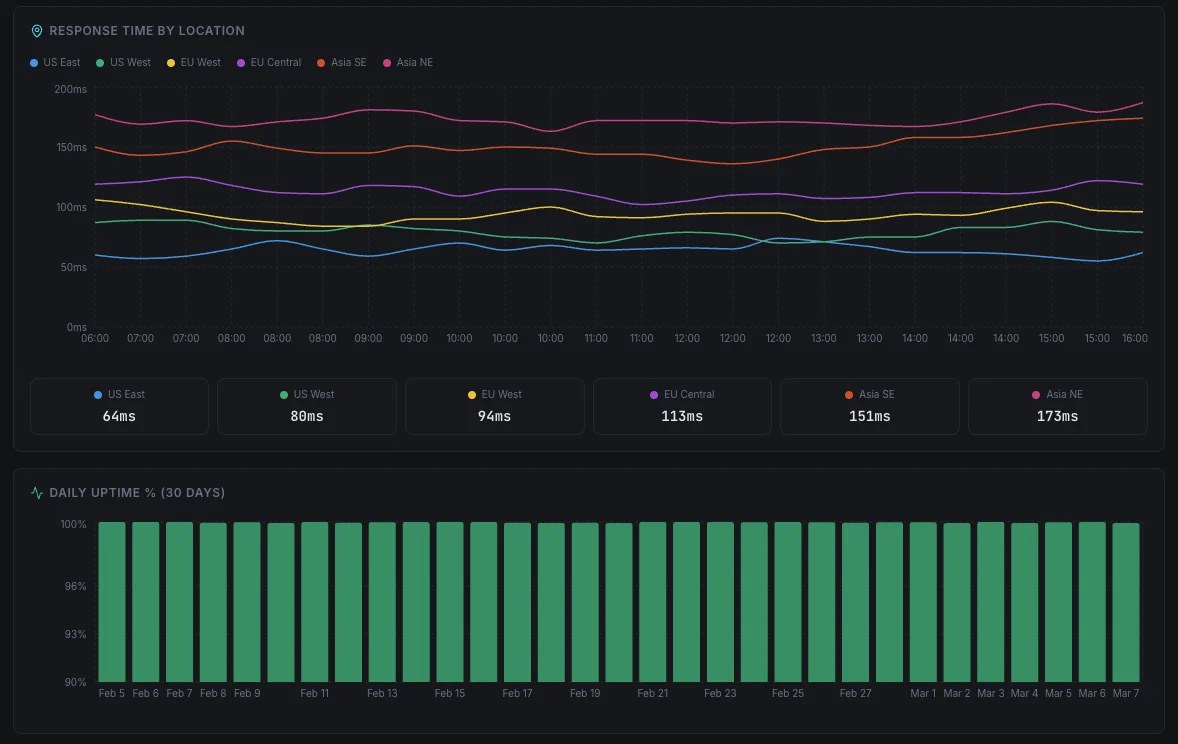
A single command center for uptime, page speed, SSL, and content checks across all your websites. Real-time status from 15+ probing nodes, response time charts, and one-click drill-down into any incident.
- Live global map with per-node status
- Response time charts and 99.98% uptime SLA
- Uptime, SSL, and page speed in one unified view
- Root cause analysis with one-click drill-down
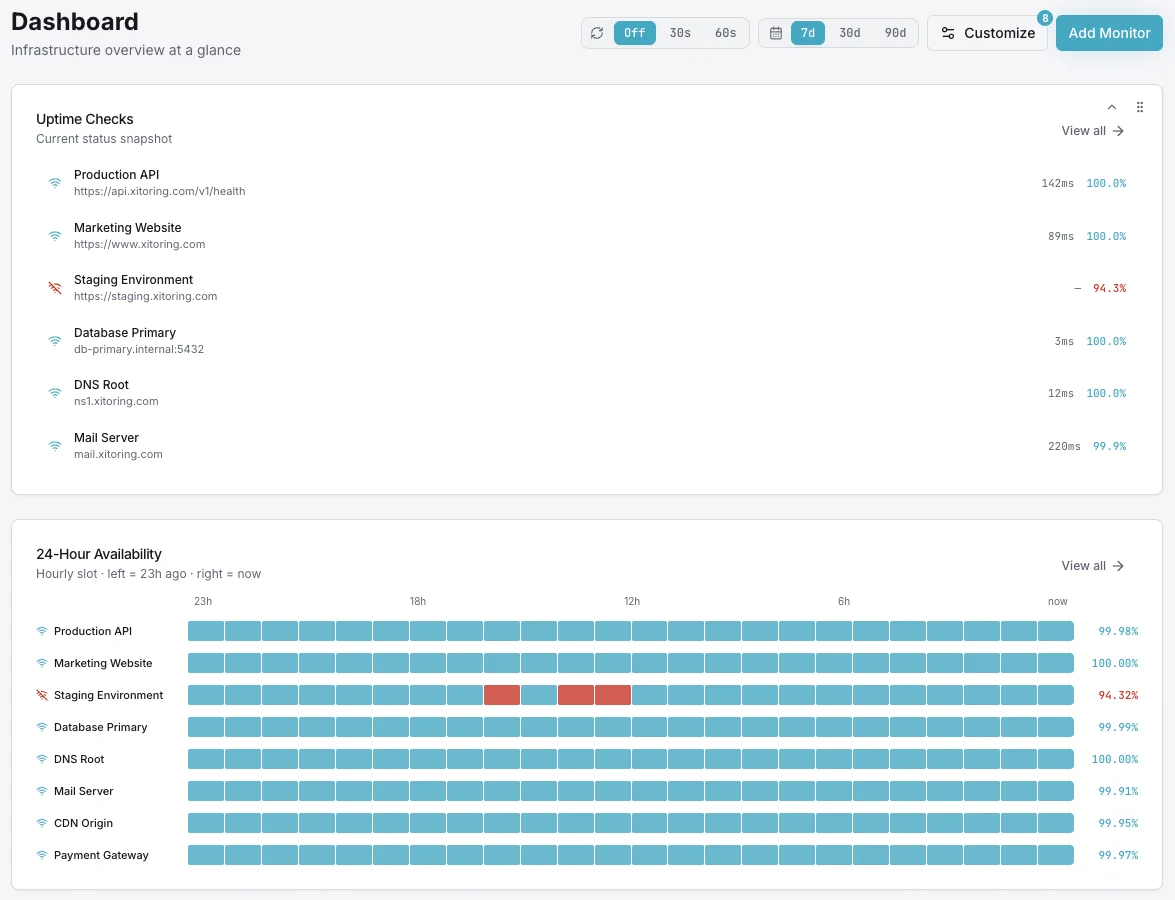
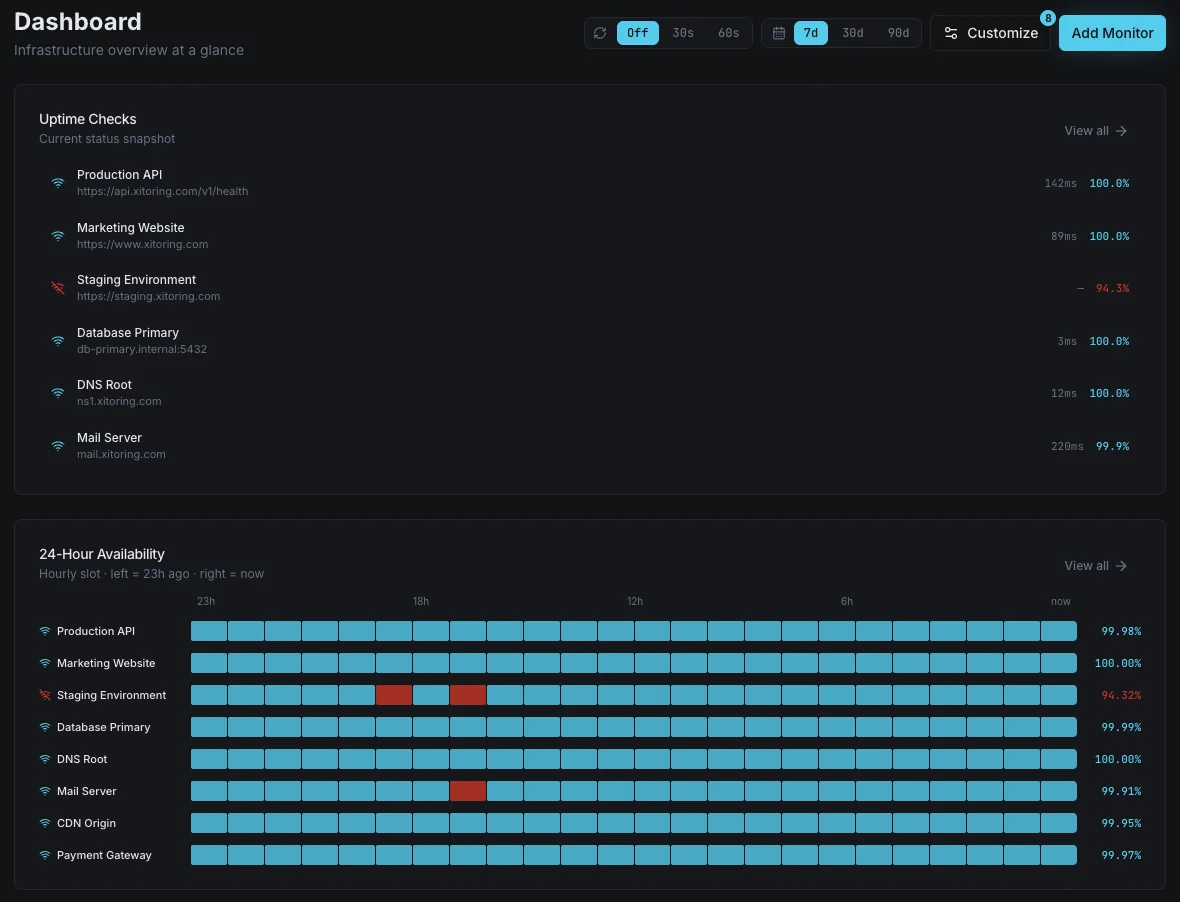
Built for Modern Teams
Generous Free Plan
Start with 20 monitors at 1-minute intervals — free, forever. No credit card, no trial expiry, no feature gates on basic checks.
Migrate in One Click
Importing existing monitors from Pingdom, UptimeRobot, Uptime.com, or BetterStack takes seconds — your check configs and contacts come along.
Free Public Status Page
Every plan includes a hosted, branded status page so visitors can see real-time uptime — building trust and cutting support tickets.
Frequently asked questions
Common questions about Website Monitoring.
What is website monitoring?
How does Xitoring's site monitor work?
How often is my website checked?
Does Xitoring monitor SSL certificates and page speed?
Is there a free website monitoring plan?
How does Xitoring compare to UptimeRobot, Pingdom, or BetterStack?
Can I monitor multi-step transactions like checkout or login?
Will I get false-positive alerts when my website is fine?
How are website monitoring outputs used across alerting, status pages, and dashboards?
Add Your Website, We Monitor the Rest
Drop in your website URL and Xitoring starts monitoring it from 15+ global locations instantly. Track uptime, page load speed, SSL health, and broken pages — all from one dashboard.
Start Free Trial