Server
Monitoring
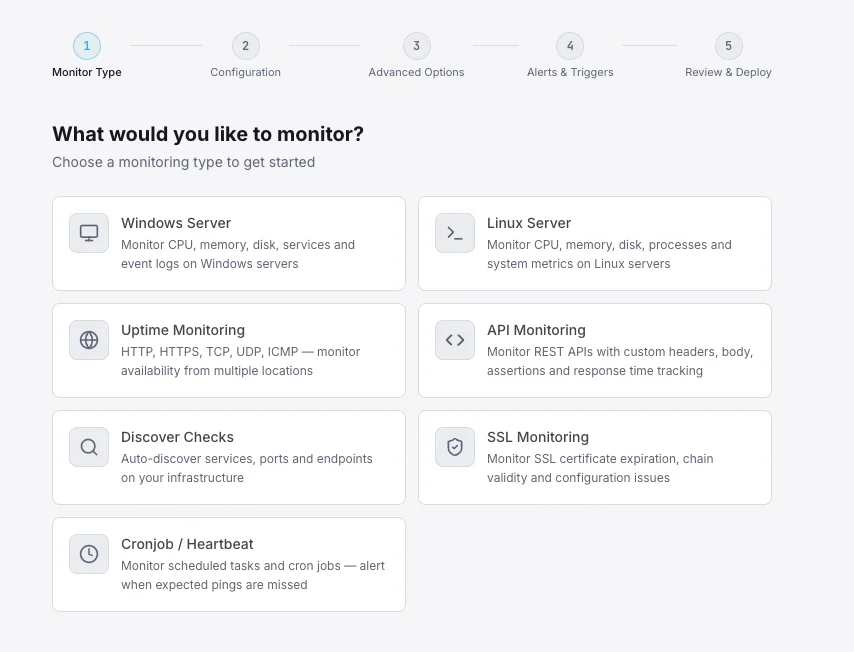
Monitor every Linux and Windows server from a single platform. CPU, memory, disk, network, and 30+ service integrations — with a lightweight agent and 1-minute intervals.
Social Proof
Trusted by thousands — rated on
See what real users say about Xitoring on the world's top review platforms.




What is server monitoring?
Server monitoring is the continuous observation of operating-system and application metrics — CPU utilization, memory and swap pressure, disk I/O and SMART health, network throughput, process state, and service availability — to detect performance degradation and outages before they reach end users. It applies equally to bare-metal servers, virtual machines, and cloud instances running Linux or Windows, and underpins every reliable production environment by feeding the data that capacity planning, incident response, and SLO tracking depend on.
Key Features
Everything you need for Server Monitoring.
Cross-Platform Agent
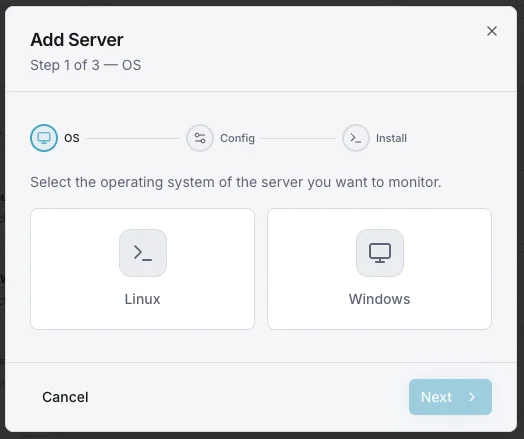
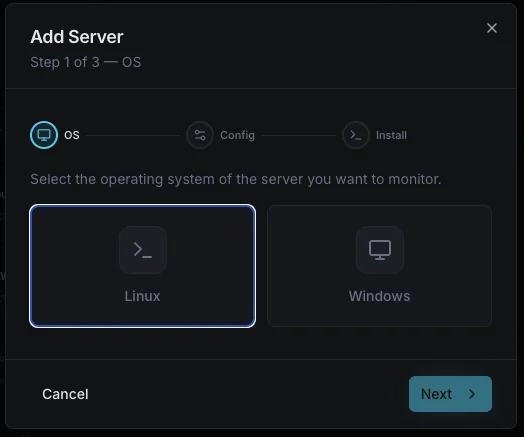
One-command install on Linux (curl) or MSI on Windows. Works on Ubuntu, CentOS, Debian, RHEL, Windows Server 2016–2022, and more.
CPU & Load Monitoring
Track CPU utilization across all cores, load averages, and performance counters on both Linux and Windows in real time.
Disk I/O & Storage
Monitor disk read/write speeds, IOPS, storage capacity, and SMART health. Get alerts before disks fill up on any OS.
Network Bandwidth
Per-adapter bandwidth monitoring with inbound/outbound traffic, packet loss, and error tracking across all interfaces.
Memory & Swap / Page File
Real-time RAM, swap (Linux), and page file (Windows) monitoring with historical trends and leak detection.
Auto Service Discovery
Auto-detects Nginx, Apache, IIS, MySQL, MSSQL, Redis, Docker, Active Directory, and 30+ services with zero config.
Complete Server Visibility Across Every OS
Server Monitoring gives you full-stack insight into every Linux and Windows server. Track CPU, memory, disk, network, and 30+ services with a lightweight agent and 1-minute intervals.
- One-command Linux install & MSI for Windows
- 1-minute metric collection intervals
- Per-core CPU and load average tracking
- Real-time memory, swap, and page file monitoring
- Disk I/O, IOPS, and storage alerts
- Per-adapter network bandwidth tracking
- 30+ auto-discovered software integrations
- Docker, IIS, MSSQL, and Active Directory support
- +15 Notification Channels
Who it's for
Server Monitoring Use Cases
See how teams across industries use Xitoring to keep their infrastructure reliable.
Cloud Infrastructure
Monitor AWS EC2, Azure VMs, GCP Compute, and DigitalOcean droplets running Linux or Windows. Track CPU, memory, and disk across your entire fleet.
Database Servers
Keep MySQL, PostgreSQL, MongoDB, Redis, and MSSQL healthy. Monitor query performance alongside system resources on any OS.
Web & E-Commerce
Monitor Nginx, Apache, IIS, and PHP-FPM powering your web apps. Detect resource bottlenecks before they slow page loads.
Enterprise IT
Monitor Active Directory, Exchange, SharePoint, Docker, and Kubernetes across your mixed-OS infrastructure.
Government & Finance
Monitor compliance-critical infrastructure with audit trails, performance baselines, and SLA reporting on both Linux and Windows.
Healthcare & Education
Keep EMR servers, campus file servers, and lab environments healthy with proactive monitoring and instant alerting.
Why Server Monitoring Matters
Your servers — Linux or Windows — power every critical workload. CPU spikes, memory leaks, disk saturation, and network bottlenecks can cascade into full outages. Whether you run Ubuntu VMs, Windows Server with IIS and MSSQL, or a hybrid fleet, proactive monitoring gives you the visibility to act before users are impacted.
- Catch CPU overloads and runaway processes on any OS
- Prevent disk-full crashes with capacity alerts
- Detect memory leaks before OOM kills or page file exhaustion
- Monitor IIS, MSSQL, Nginx, Docker, and 30+ services
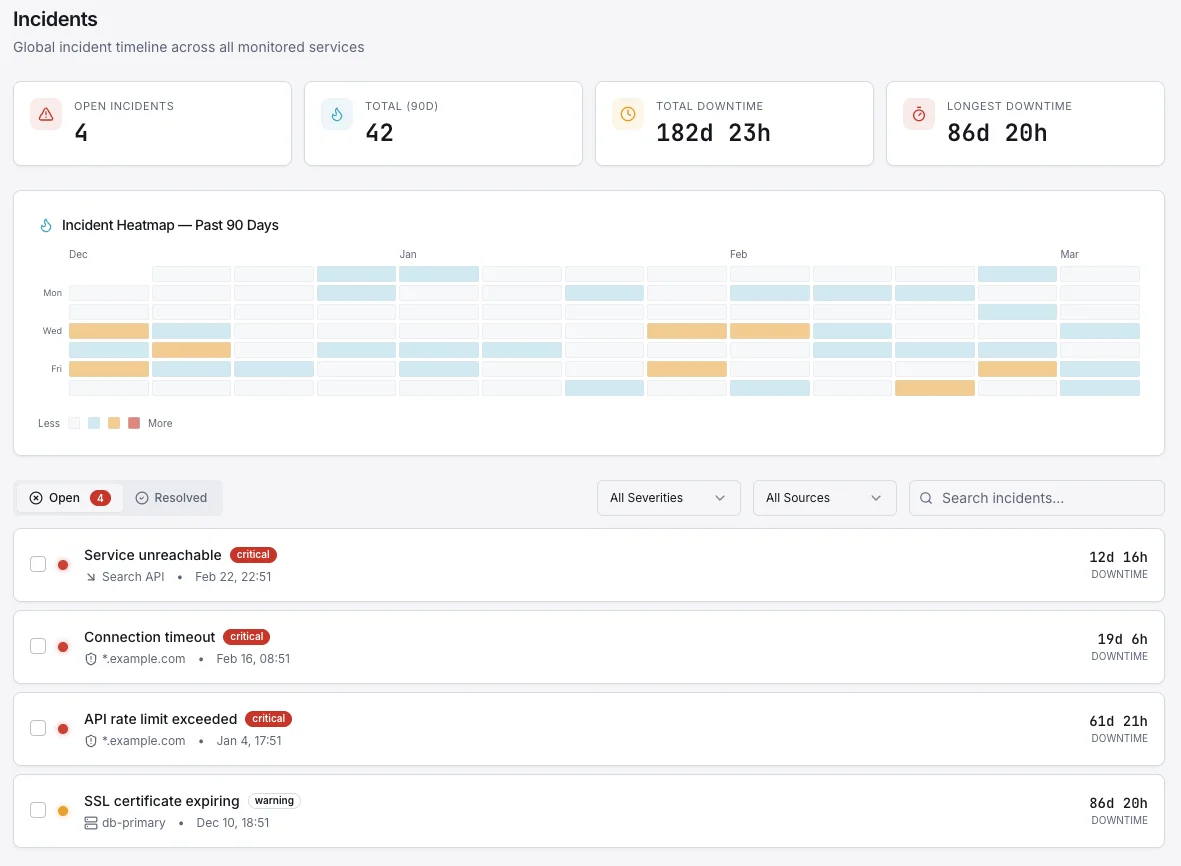
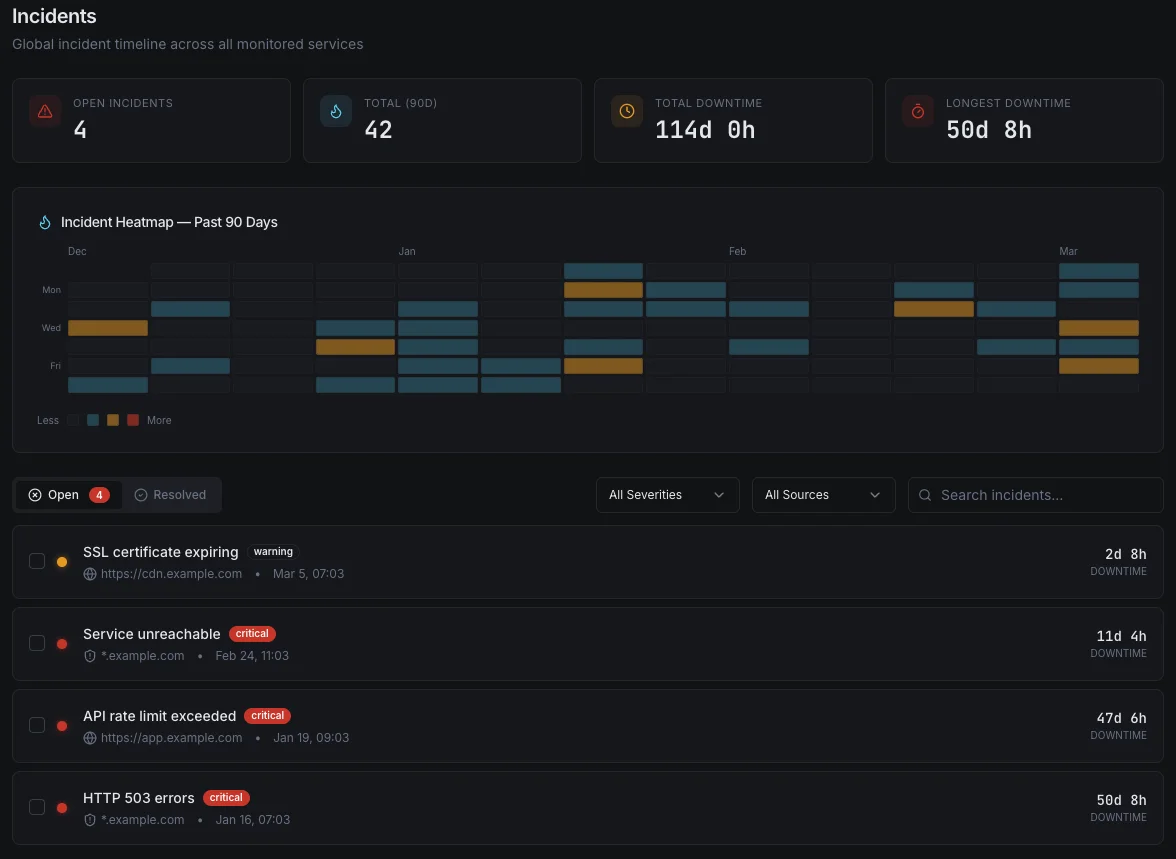
One Dashboard for Every Server
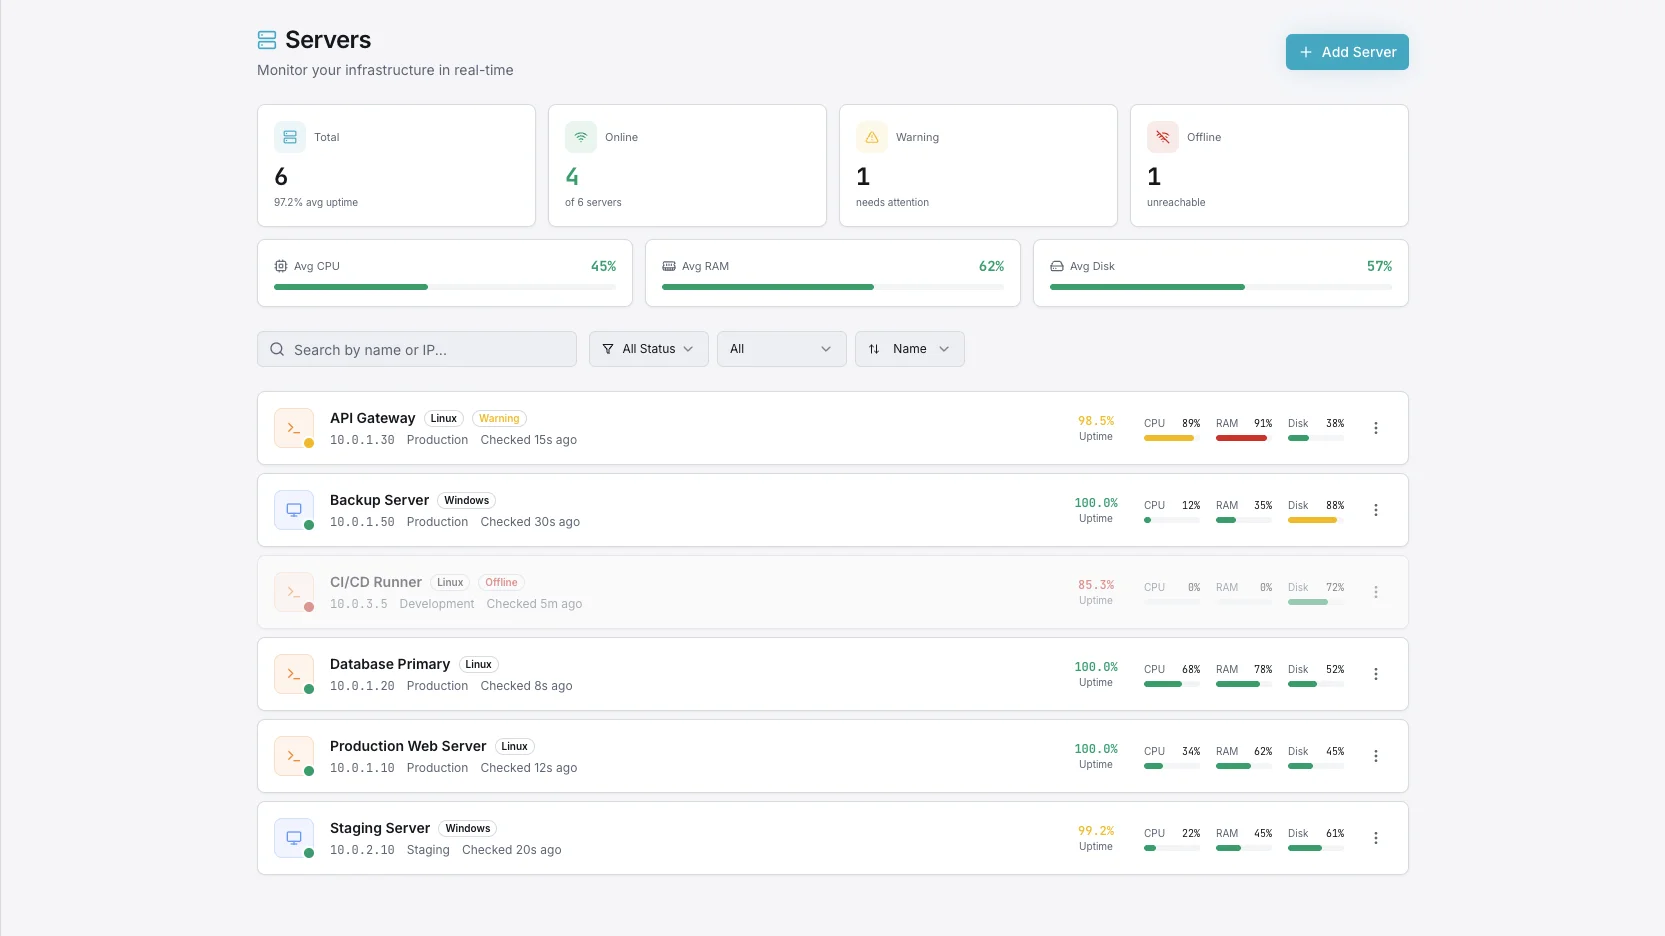
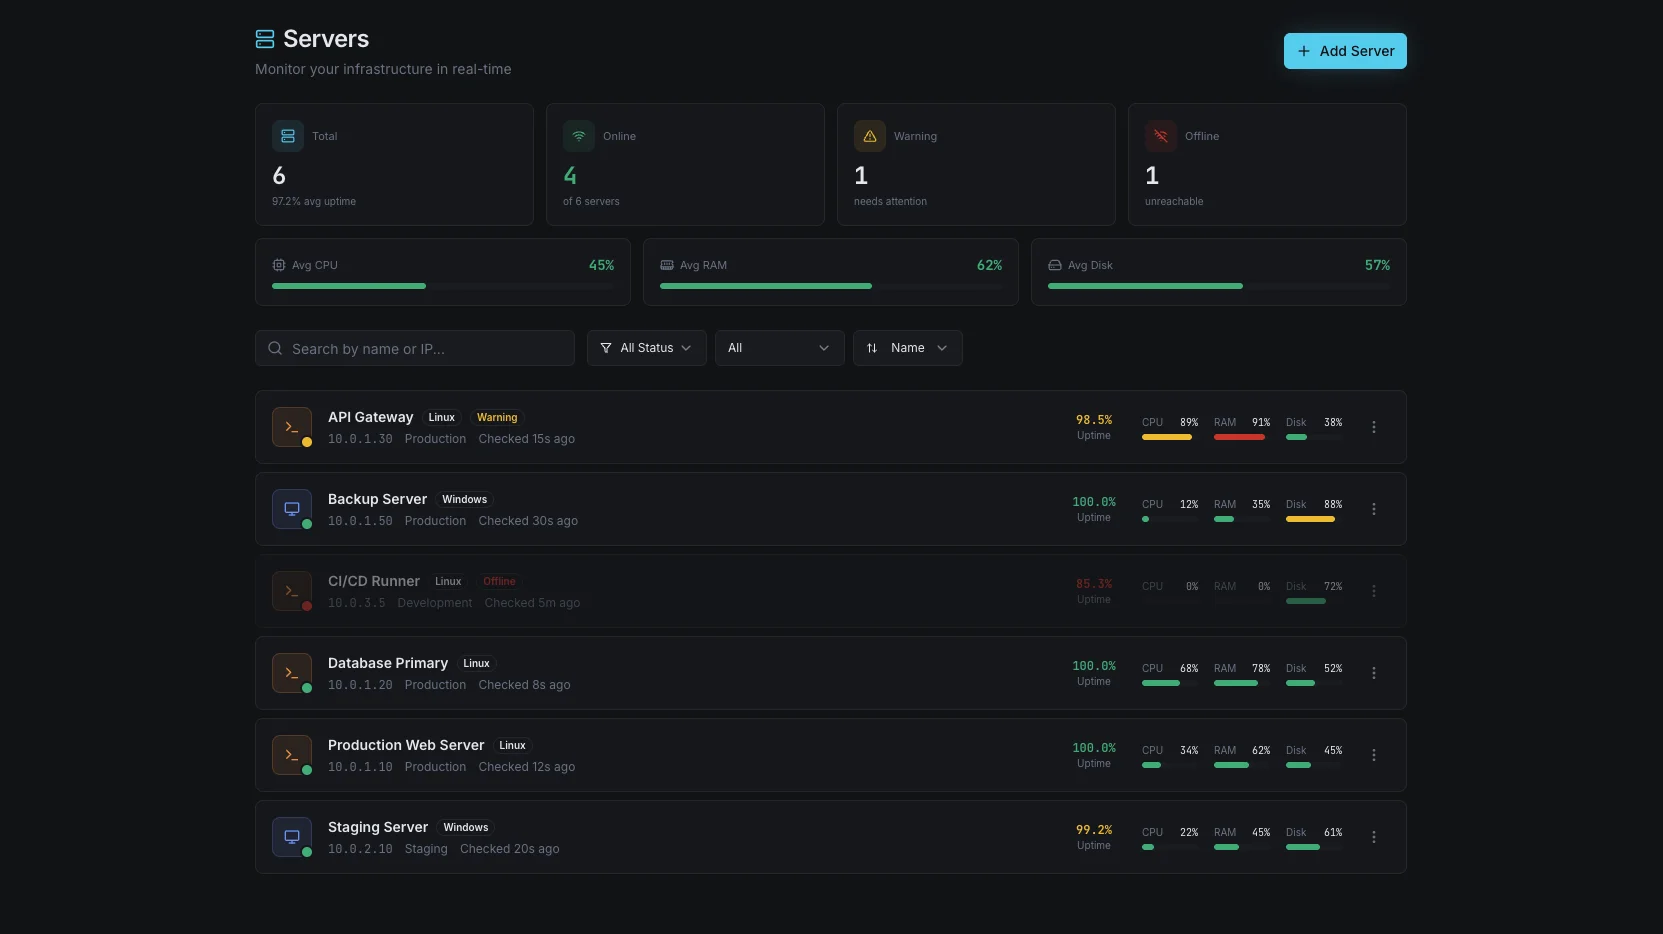
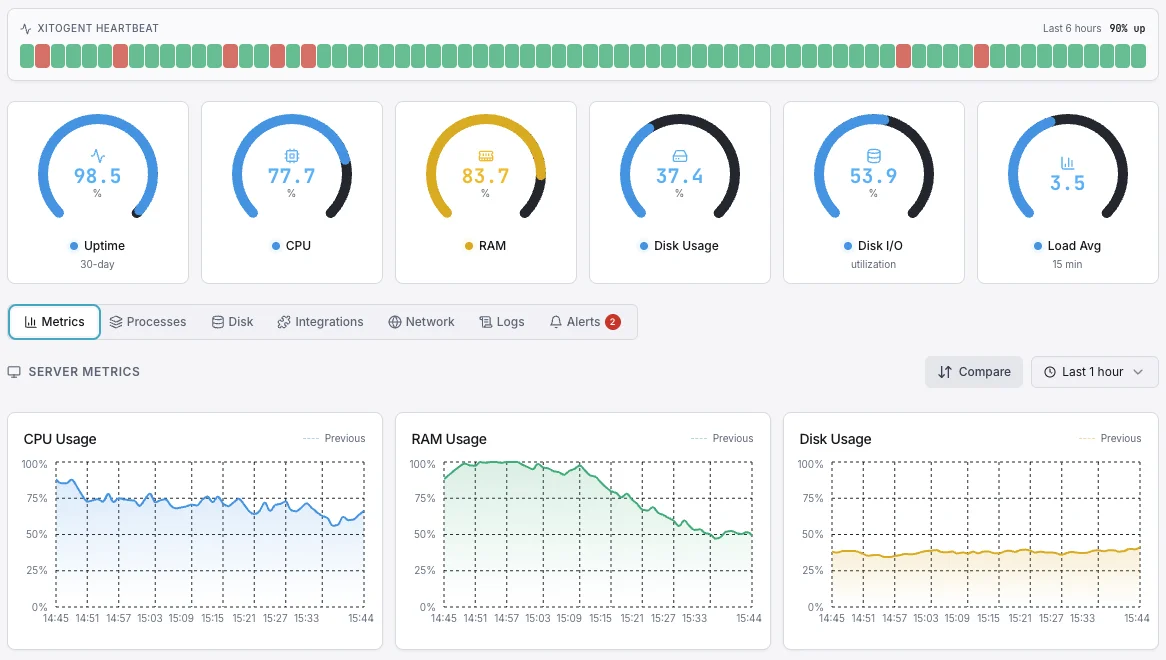
See Linux and Windows servers side by side in a single unified view. CPU per-core charts, memory gauges, disk I/O metrics, network graphs, service status, and process lists — all updating in real time with 1-minute granularity across your entire fleet.
- Unified view for Linux and Windows servers
- Per-core CPU, memory, swap, and page file monitoring
- Disk I/O, IOPS, and storage capacity tracking
- Auto-discovered services with zero-config setup
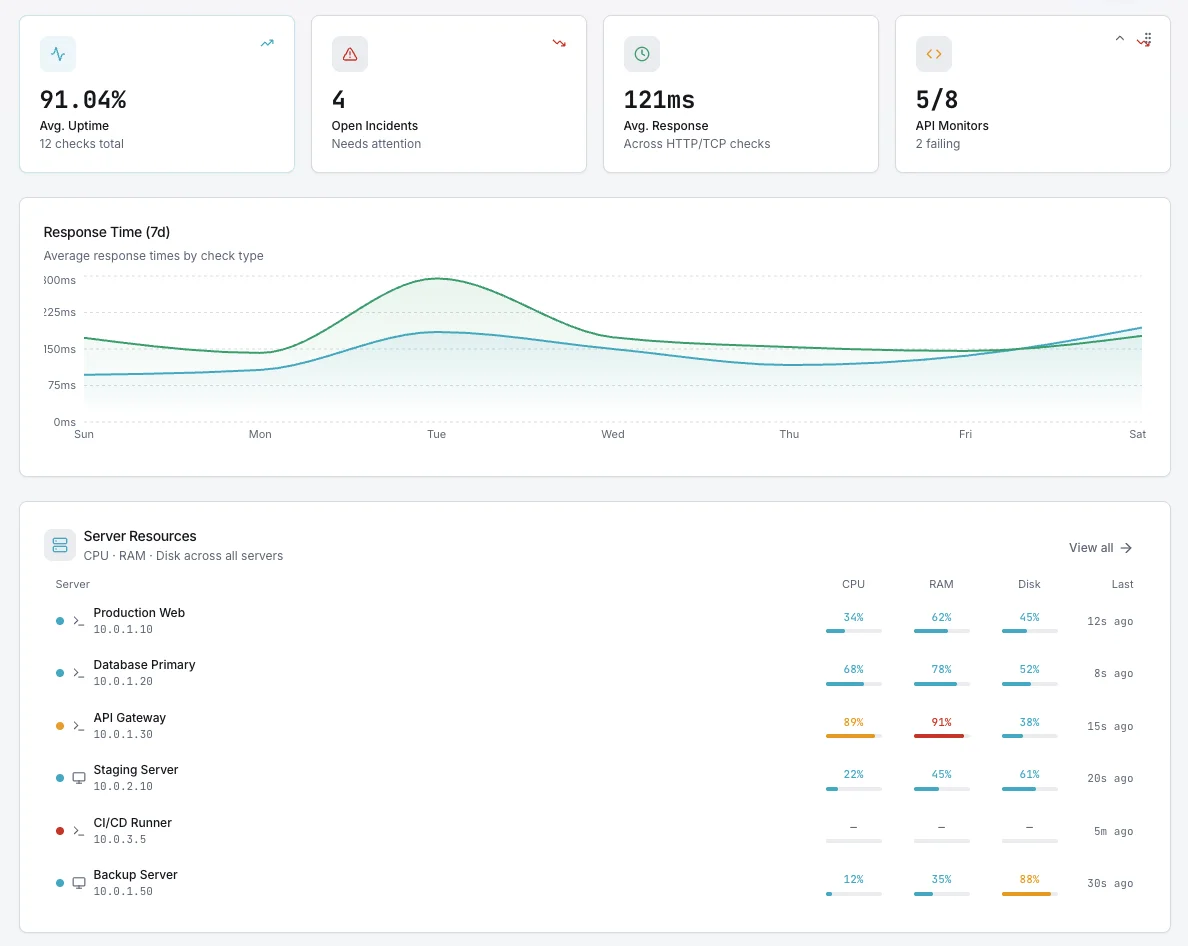
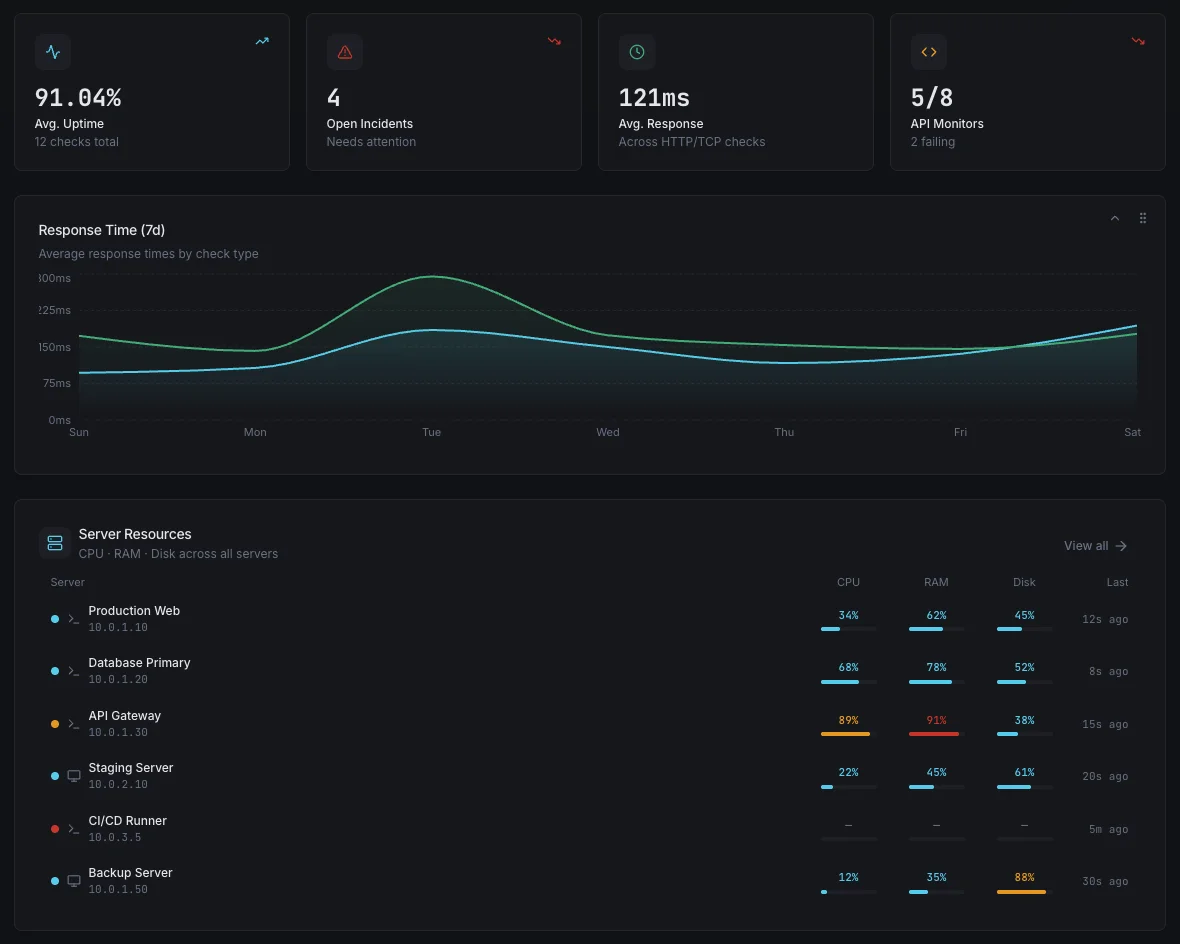
Explore by Platform
Linux Server Monitoring
Deep visibility into every distribution — Ubuntu, CentOS, Debian, RHEL, and more. One-command install with Docker support.
Windows Server Monitoring
Full-stack monitoring for IIS, MSSQL, Active Directory, and Windows services with MSI or Azure Marketplace deploy.
Unified Dashboard
View all servers regardless of OS in a single dashboard with the same metrics, alerts, and notification channels.
Frequently asked questions
Common questions about Server Monitoring.
Which operating systems are supported?
How do I install the monitoring agent?
Does the agent impact server performance?
Can I monitor Linux and Windows servers from a single dashboard?
What software integrations are available?
How often are metrics collected?
Can I monitor Docker containers and Windows services?
Is there a way to deploy on Azure?
What does a modern server monitoring platform include?
One Agent, Full Server Visibility
Install Xitogent with a single curl command on Linux or an MSI on Windows. It auto-detects your OS, discovers running services, and starts collecting metrics in under 60 seconds.
Start Free Trial