
OpenVPN Monitoring
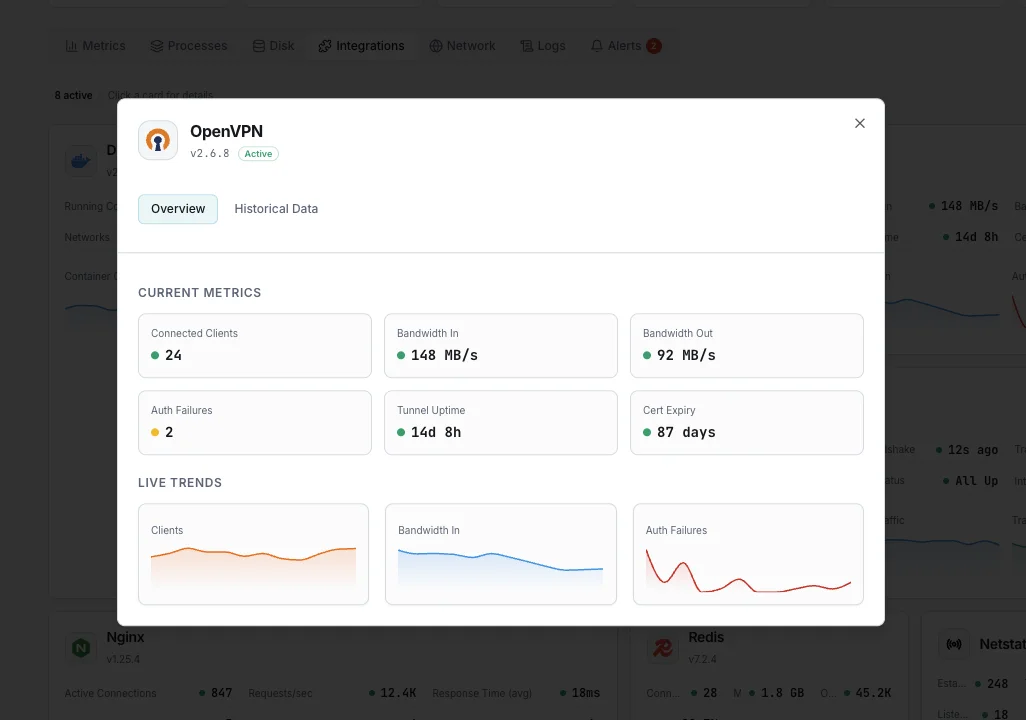
Monitor OpenVPN connected clients (CLIENT_LIST), per-client bytes_in/bytes_out, TLS handshake errors, max-client ceiling, certificate expiry, and tunnel uptime in real time — via the native management interface.
Why monitor OpenVPN?
OpenVPN is the long-standing corporate remote-access VPN. Auth failures signal brute-force attempts, max-client exhaustion locks out legitimate users, and certificate expiry is the #1 cause of 'VPN suddenly stopped working' tickets. Monitoring catches all three before users start paging the helpdesk.
OpenVPN monitoring, explained
OpenVPN monitoring catches brute-force auth attempts, TLS handshake failures, certificate expiry, max-client exhaustion, and per-client bandwidth abuse before they cause connectivity outages, security breaches, or unexpected end-of-year cert-expiry incidents. For corporate remote-access VPNs (the classic OpenVPN deployment), site-to-site tunnels, and Pritunl/Access Server/CloudConnexa-managed setups, per-client visibility is what separates a 60-second alert on a credential-stuffing attempt from finding compromised accounts in the auth log next week. Xitoring auto-discovers your OpenVPN, reads the management interface, and routes alerts to Slack, PagerDuty, Telegram, or your existing on-call.
What we monitor
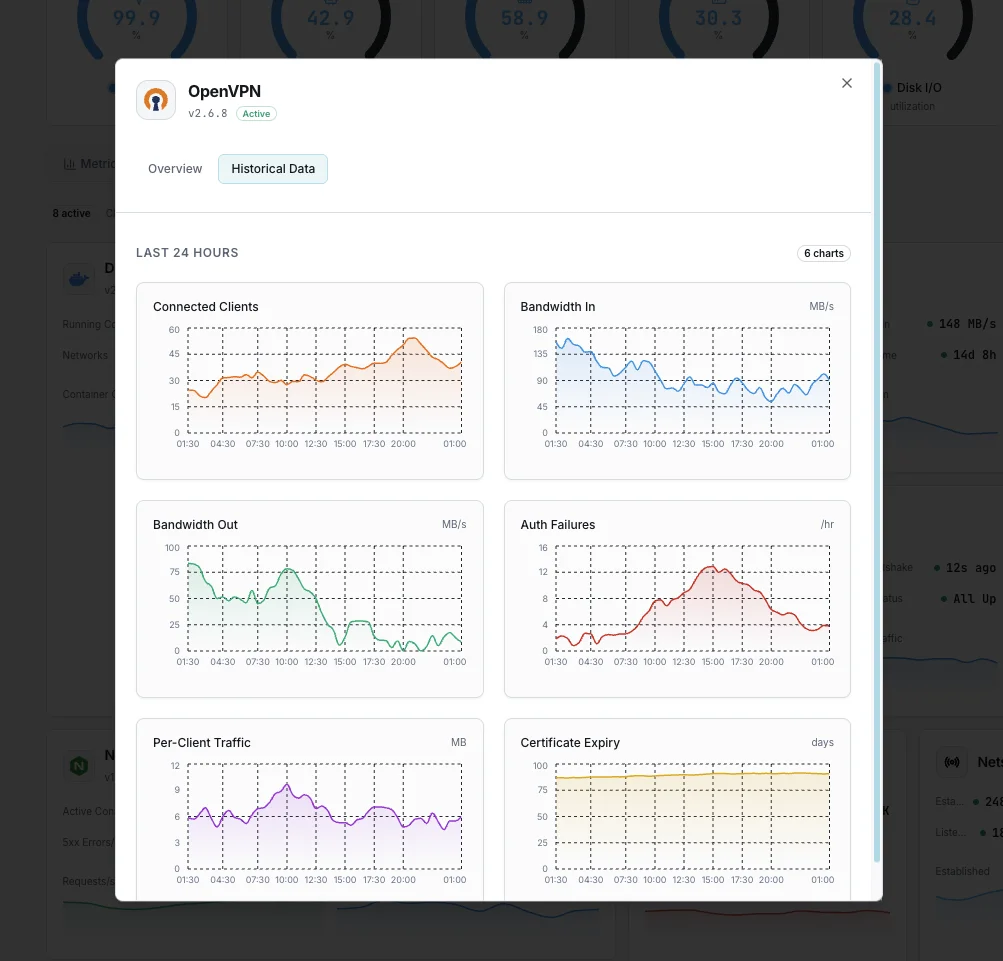
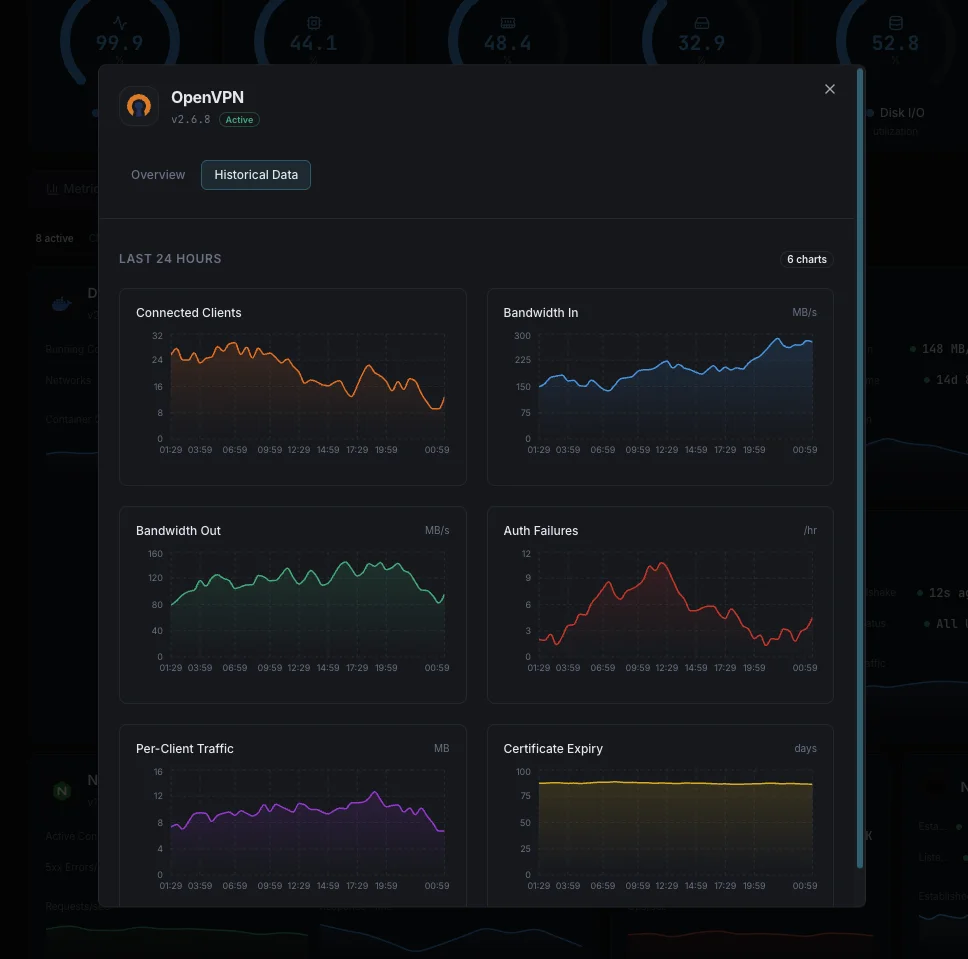
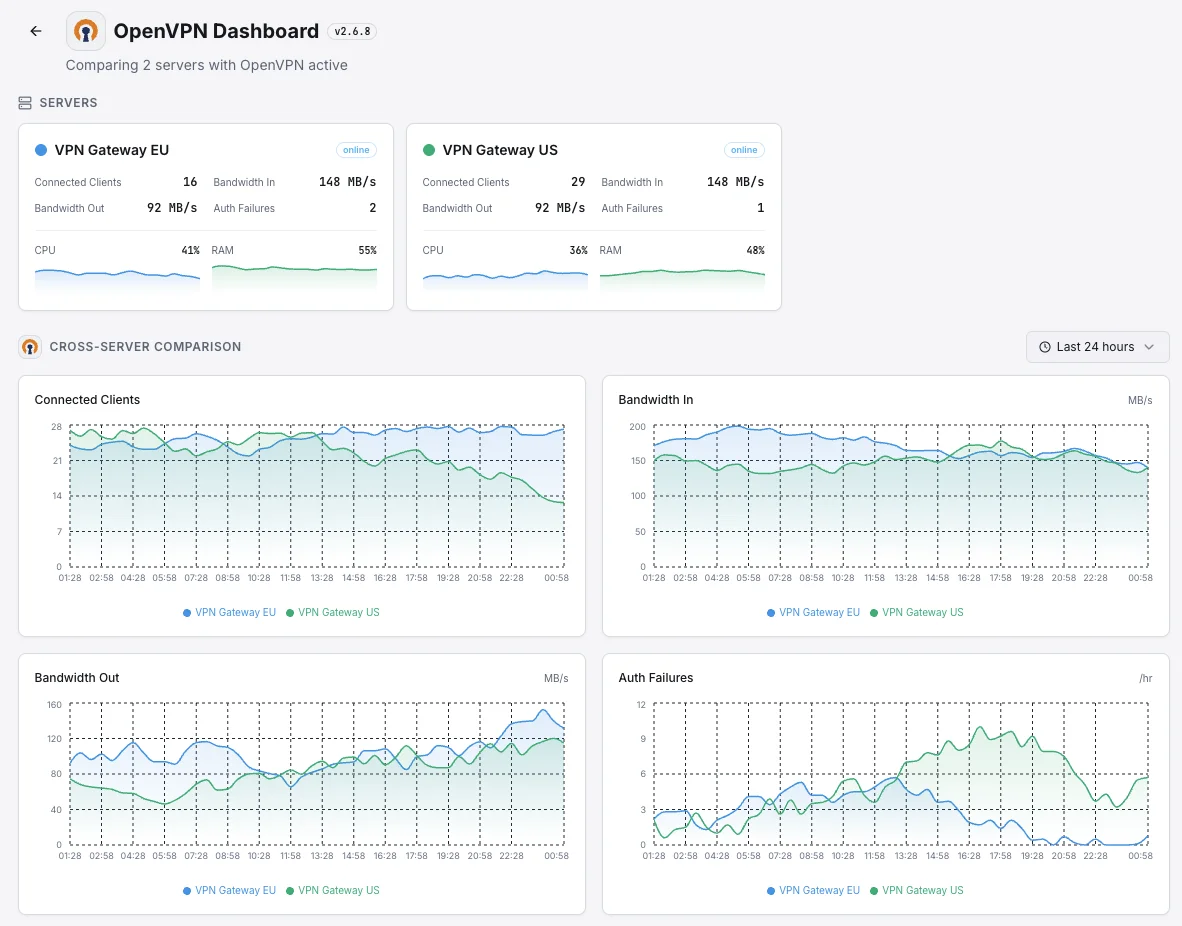
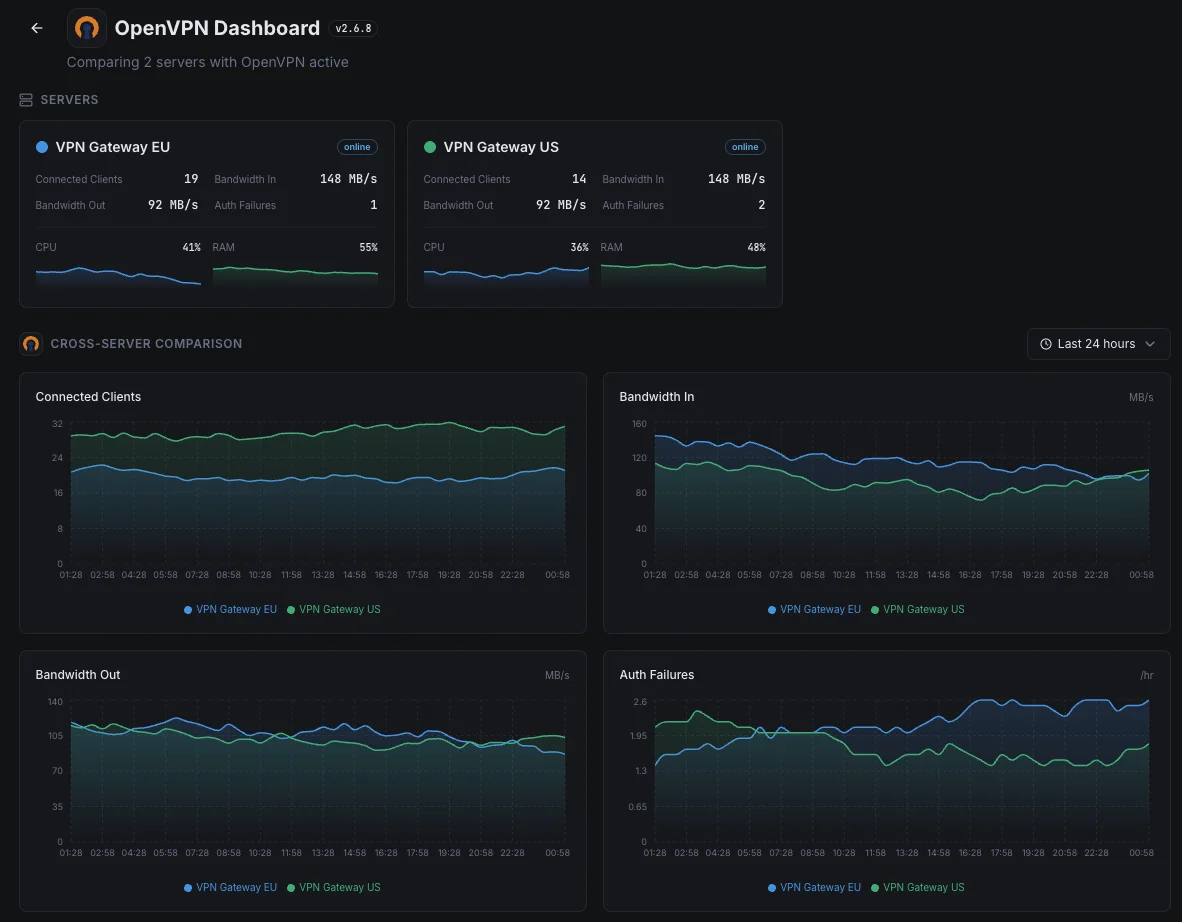
Connected Clients (CLIENT_LIST)
Active VPN connections from `status 2`. Each entry includes Common Name, real address, VPN address, bytes in/out, connection time. The primary VPN health signal.
Max Clients vs Connected
Connected count against the configured `max-clients` ceiling. Approaching the limit = users can't connect; raise the limit or add a second server.
Bandwidth In / Out (server-wide)
Total tunnel throughput from GLOBAL_STATS. Spikes signal bulk transfers; sustained high rates may need bandwidth shaping or per-user `bytes-per-sec` config.
Per-Client Bytes In / Out
Per-client throughput from CLIENT_LIST. Catches bandwidth-abuse patterns (one user pulling TBs through the VPN) before they impact other clients.
Authentication Failure Rate
Failed auth attempts per second (PAM, LDAP, RADIUS, or cert-based). Spikes signal brute-force credential-stuffing — alert on rate > 5/sec sustained.
TLS Handshake Errors
From OpenVPN log: `TLS Error`, `TLS handshake failed`, cipher mismatches, expired-cert rejections. Non-zero rate signals client-side cert or config drift.
Tunnel Uptime
Time since OpenVPN service started (server uptime) and per-client `Connected Since` for individual sessions. Unexpected restarts surface here first.
Connected Since (per-client)
Per-client connection age. Long-lived sessions are normal; rapid disconnect+reconnect cycles indicate network instability or client-side keepalive issues.
Certificate Expiry
Days remaining until CA, server, or client certificate expiration. Alert at 30, 14, and 7 days out — cert expiry is the #1 cause of "VPN suddenly stopped working" tickets.
ROUTING_TABLE Size
Active routes pushed to clients. Sudden changes indicate config drift; large tables hint at route-bloat needing optimization.
Reneg / Rekey Events
TLS renegotiation/rekey events per `reneg-sec`. Healthy steady state — high failure rate flags clients with stale TLS state or NAT timeout issues.
TUN/TAP Read/Write Errors
Kernel-level errors on the OpenVPN tunnel device from log parsing. Non-zero rate indicates kernel-side packet processing issues.
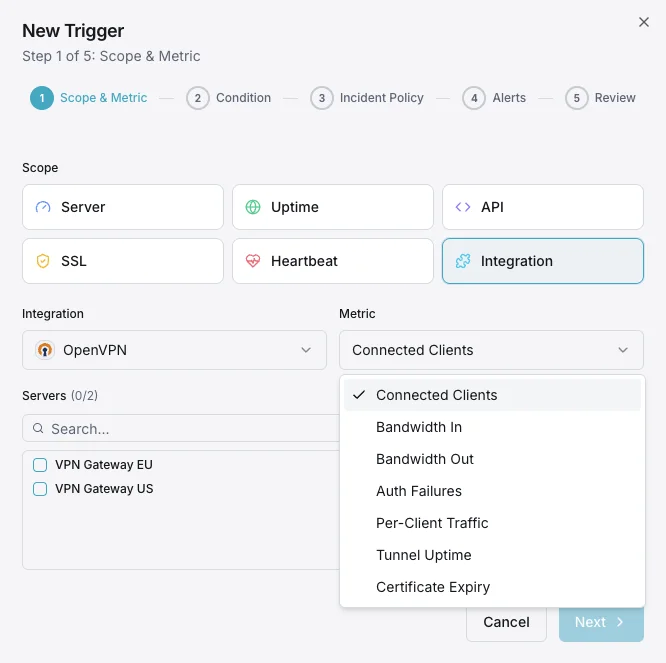
Configurable alert triggers
Set up custom triggers in your dashboard to get notified the moment OpenVPN metrics cross your defined thresholds.
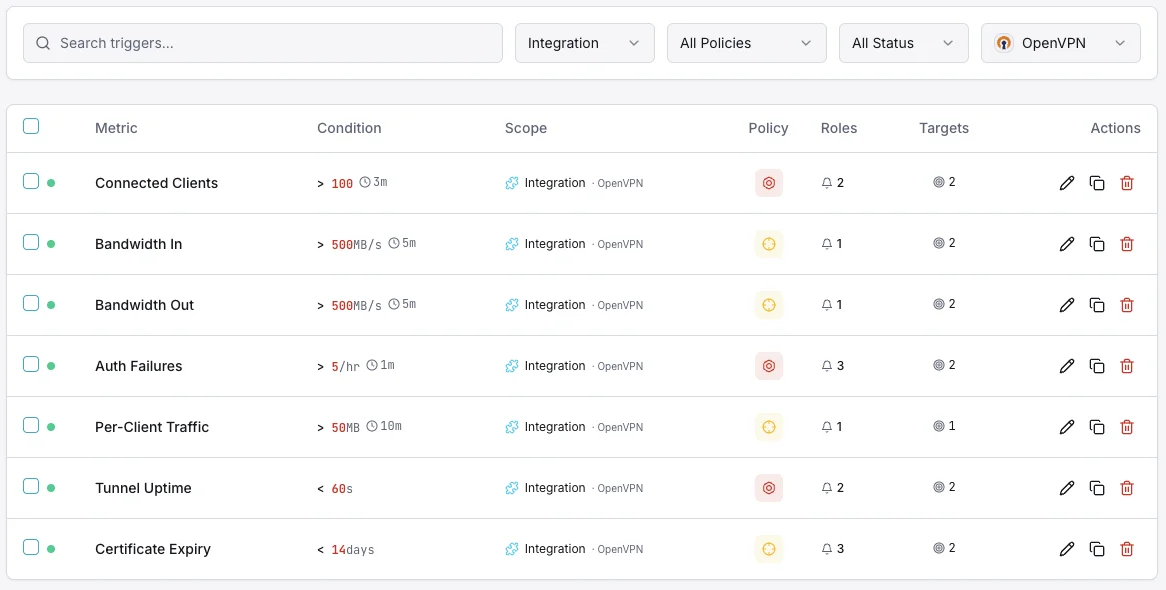
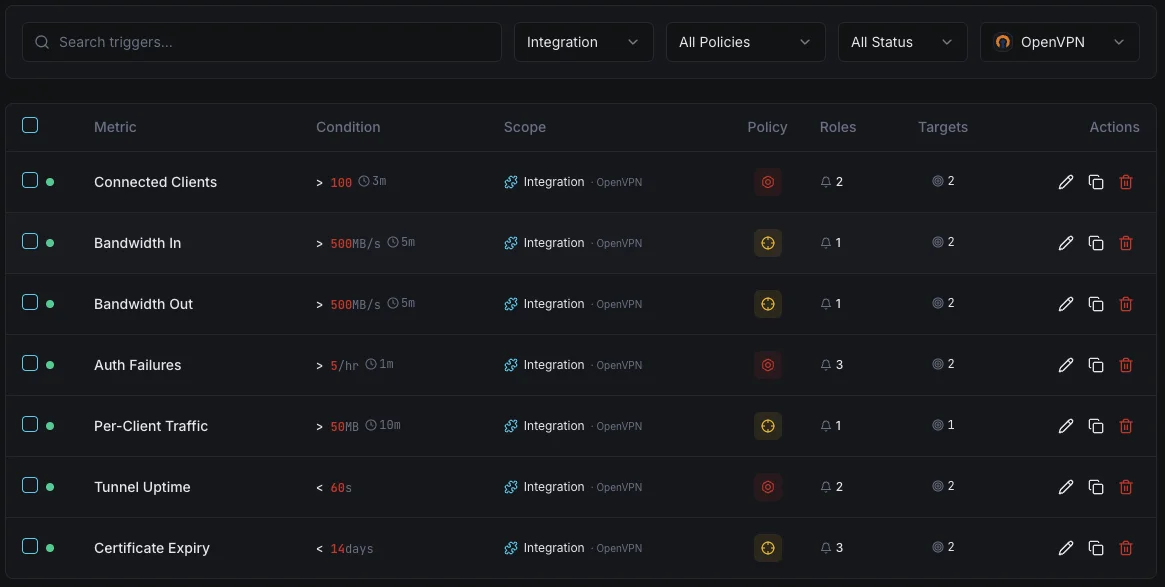
Auth Failures
criticalFires on authentication failure spike.
Client Count
warningAlerts when connections approach limits.
Bandwidth
warningTriggers on abnormal bandwidth patterns.
Certificate Expiry
criticalFires when certificates are expiring soon.
Importance of OpenVPN Monitoring
VPN downtime means lost connectivity for remote teams. Auth failures can indicate security threats.
- Detect unauthorized access attempts
- Monitor client connectivity
- Track bandwidth utilization
- Prevent certificate-related outages
Why Choose Xitoring
Zero-config VPN monitoring.
- One-command install
- Global nodes
- Unified dashboard
- Multi-channel alerts
Common OpenVPN monitoring scenarios
Where OpenVPN typically runs today — and what could go wrong if no one's watching.
Remote-access VPN for employees
When your team relies on the VPN to do their jobs, an outage stops the company from working. We catch the warning signs early — failed logins, expiring credentials, unusual traffic — so IT can prevent the lockout instead of getting a wave of support tickets.
Connecting branch offices to headquarters
VPN tunnels between offices look invisible when they're working — and silently take a branch offline when they aren't. We watch every link so a disconnected office is detected immediately, not after staff start calling to ask why nothing works.
Hosted VPN platforms
Hosted VPN products give you a friendly dashboard, but rarely the deep visibility your team actually needs during an incident. We surface what's happening underneath so the team can resolve issues directly instead of waiting on the vendor.
Prerequisites for OpenVPN
Make sure you've got these in place — most installs are a 60-second job once they are.
- OpenVPN 2.6.x (community) or OpenVPN Access Server / CloudConnexa installed and running
- Management interface enabled in
server.conf(e.g.,management 127.0.0.1 7505) - Read access to OpenVPN status and log files for Xitogent (
/var/log/openvpn.log,/var/log/openvpn/status.log)
Get started in minutes
Install Xitogent on your OpenVPN server
Install the lightweight Xitogent monitoring agent on the host running OpenVPN.
curl -s https://xitoring.com/install.sh | sudo bash -s -- --key=YOUR_API_KEYEnable the OpenVPN management interface
Add `management 127.0.0.1 7505` to your OpenVPN server config and reload the service. Xitogent reads connected-client state, bandwidth, and tunnel uptime from this socket.
sudo xitogent integrateEnable the OpenVPN integration
Use the Xitoring dashboard or CLI to enable the OpenVPN integration. Xitogent auto-detects the management socket and the CCD (client-config-dir) directory.
Configure alert thresholds (optional)
Set custom thresholds for Auth Failures, Client Count, or Certificate Expiry so brute-force attempts and surprise expirations never go unnoticed.
Verify it's working
Run this command on the server to confirm Xitogent picked up the integration. Fresh metrics will start streaming to your dashboard within ~30 seconds.
sudo xitogent statusConsidering alternatives?
See how Xitoring stacks up against the alternatives for OpenVPN monitoring — flat pricing, deeper integrations, and one agent that covers your whole stack.



Frequently asked questions
What is OpenVPN monitoring?
How do I monitor active OpenVPN clients?
What does the OpenVPN status.log show?
How do I expose the OpenVPN management interface securely?
How do I monitor OpenVPN certificate expiry?
How do I detect brute-force attacks on OpenVPN?
WireGuard vs OpenVPN monitoring — what's different?
Can I monitor OpenVPN Access Server?
What OpenVPN versions are supported?
Start monitoring OpenVPN today
Set up in under 60 seconds. No credit card required. Full metrics from day one.
Start Free TrialKeep exploring
