Monitor Your Linux Servers with Xitoring
User-friendly performance monitoring software. Monitor Server CPU, Memory, IO, Disk, Network, Services and Software. Install Xitogent on your server using one command to get started!

Why Xitoring is Different
Xitoring agent is doing better than competitors! We install our agent without a web server, just a simple optimized background process.
Lightweight Agent
Our agent runs efficiently in the background without heavy dependencies like Apache or Nginx. Minimal resource usage guaranteed.
Auto Discovery
We automatically detect services running on your server and configure monitoring for them. No manual setup needed.
Instant Alerts
Get notified via Email, Slack, Telegram, or SMS the moment something goes wrong. Stay ahead of downtime.
One-Command Install
Install the Xitoring agent with a single command. No complex setup, no configuration headaches—your server is monitored in minutes.
Auto Triggers
Automatically create alerts based on detected metrics and services. Xitoring applies smart default thresholds so you’re protected from issues without manual rules.
Custom Dashboards & Graphs
Build dashboards that fit your needs. Visualize CPU, memory, disk, network, and more with real-time and historical graphs.
Servers Overview

Server Information
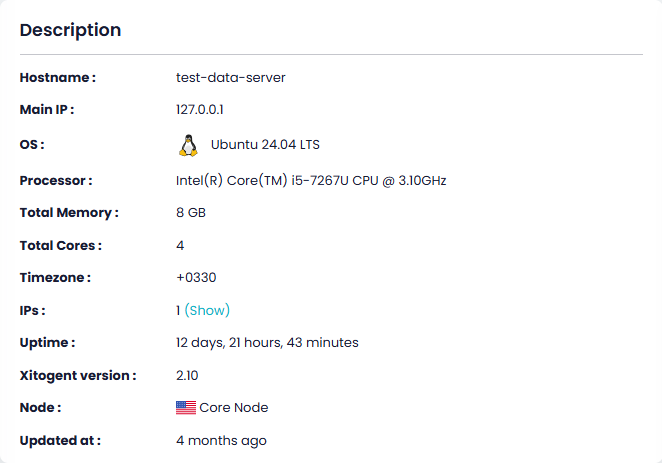
Server Info
Basic details also matter, we show a lot of information about your operating system, software and hardware specifications in this block, which helps to identify the server and gather the necessary information about it.
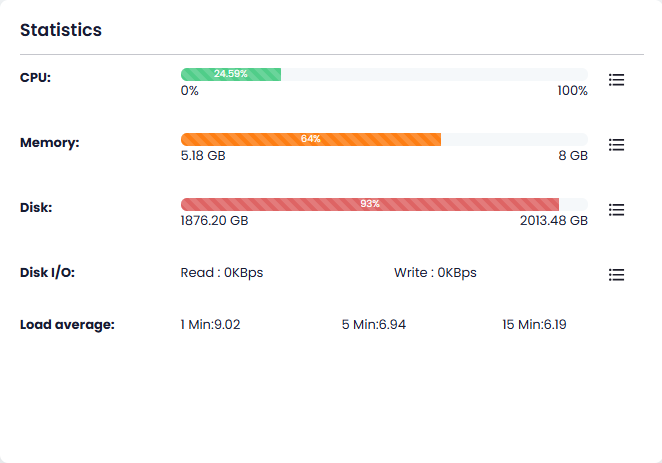
Server Live Statistics
CPU, Memory, Disk, and Disk IO are veritably critical factors that should always be covered on a server. However, databases, and any charge-critical apps can ruin your business!
if each of them goes grandly there will be a veritably likely interruption or outage on your web server.
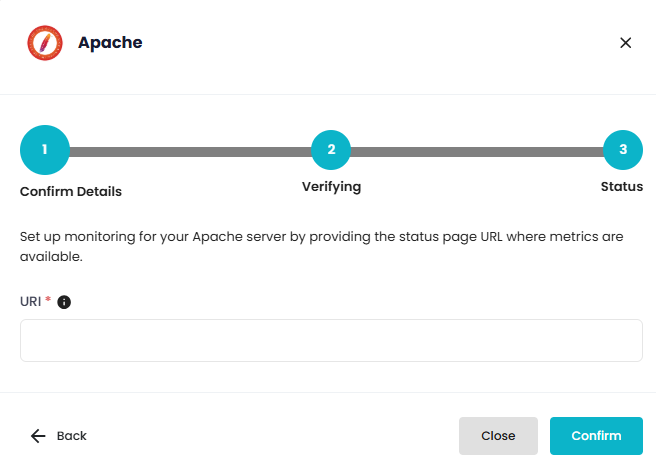
Enable Integrations from the UI
Modern server monitoring goes beyond basic metrics. To get deeper visibility, servers often need to integrate with additional services, agents, or data sources. Xitoring allows you to enable server integrations directly from the UI, without manual configuration or complex setup steps.
With just a few clicks, you can activate integrations that extend monitoring capabilities, collect more detailed metrics, and connect your servers with supported tools and services. This streamlined process saves time, reduces errors, and ensures consistent monitoring across all environments.

Process Monitoring
High resource usage is often caused by specific processes rather than the server as a whole. Identifying these processes early is essential to prevent performance degradation and unexpected outages. Xitoring provides detailed process-level monitoring, allowing you to track CPU and memory usage per process in real time.
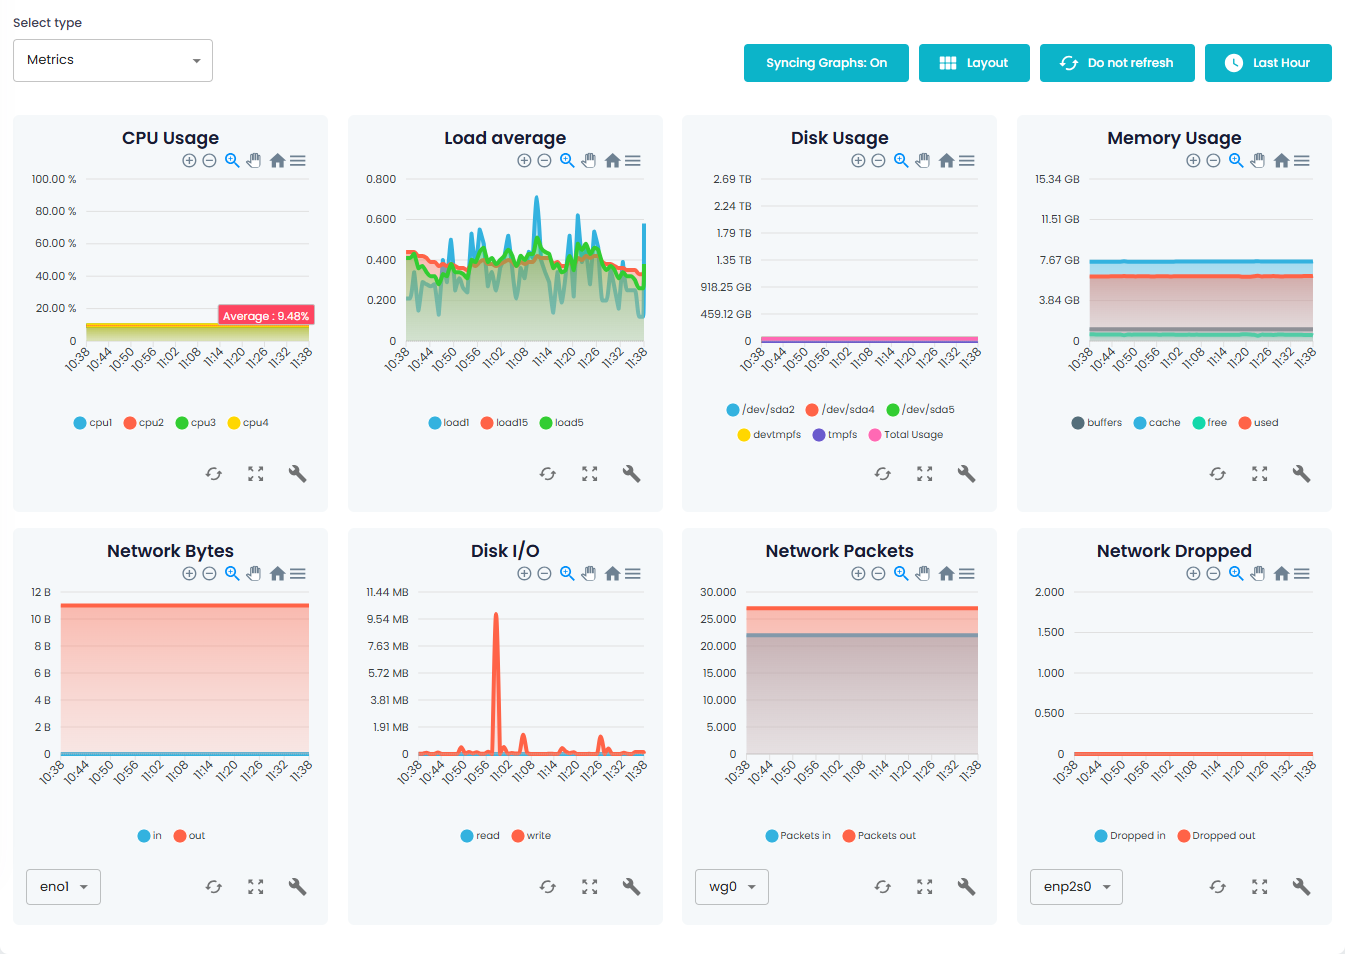
Metrics Page
The Metrics page in Xitoring gives you a centralized view of all your server performance data in real time. From CPU and memory usage to network and disk activity, everything is available in one place for quick analysis.
Having all critical metrics synced and updated continuously allows you to spot trends, identify bottlenecks, and make data-driven decisions to keep your infrastructure healthy.
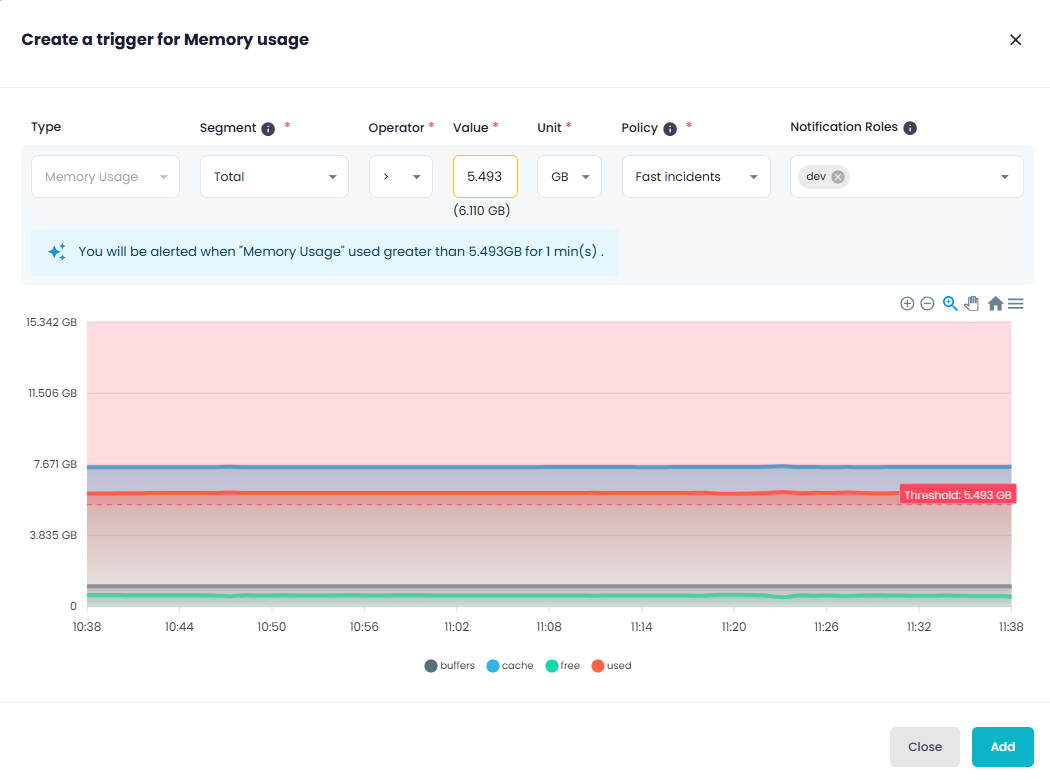
Create Triggers via Graphs
Monitoring raw numbers is helpful, but understanding behavior over time is what truly prevents incidents. With Xitoring, you can create triggers directly from metrics graphs, making it easy to define thresholds based on real usage patterns rather than guesswork.
Simply select a metric, analyze its trend, and create a trigger with a few clicks. Whether it’s CPU spikes, memory leaks, or disk usage growth, graph-based triggers help you detect anomalies early and act before they turn into outages.
Server Integrations
Xitoring always designs with simplicity, and setting up integrations can be done in a quick time. there’s no need to install additional packages or configurations, only run “xitogent integrate” on your server, and the wizard will ask you a few questions for connection.
Installation
1. Easily copy your installation command
It doesn’t matter which distribution and version of Linux server you are using, just copy and paste the installation command to your command line and you are good to go.
after a minute your Linux server will be registered into your Xitoring account and then you will receive a confirmation email.
Xitoring automatically generates graphs, set up triggers, and shows all essential data in your dashboard.
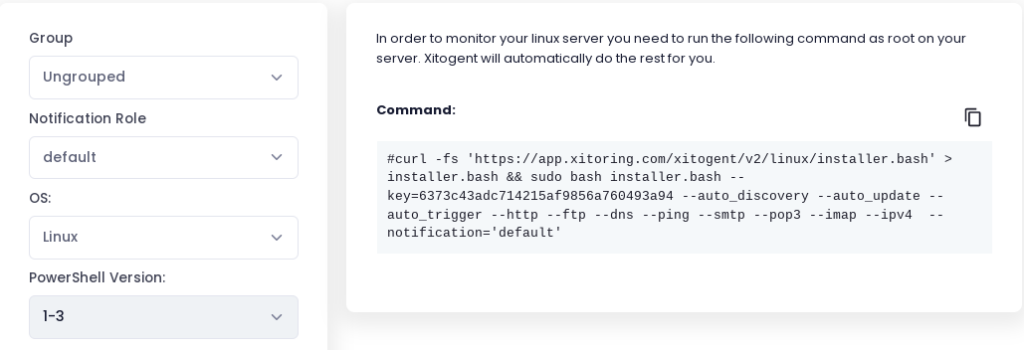
2. Run it in the Command Line
Copy and Paste your unique installation command into the server’s command line or ask your sysadmin or colleague to do it, it’s very lightweight, robust, and flexible. Also, it can be easily uninstalled anytime.
Xitogent is actively tested on the following Linux Distributions, and designed to work on major distros.
Centos 6 / 7 / 8 / 9
Centos Stream 8 / 9
Rocky Linux 8 / 9
Alma Linux 8 / 9
Cloud Linux 8 / 9
Redhat 8 / 9
Fedora 27 / 30 / 31 / 32
Ubuntu 14.04 / 15.04 / 16.04/ 18.04/ 19.04/ 20.04/ 21.04 / 22.04
Debian 5 /6 /7 /8 /9 /10 / 11
OpenSuse 15.1

3. It’s now monitored!
The last step brings lots of joy, it has been never easier, right?
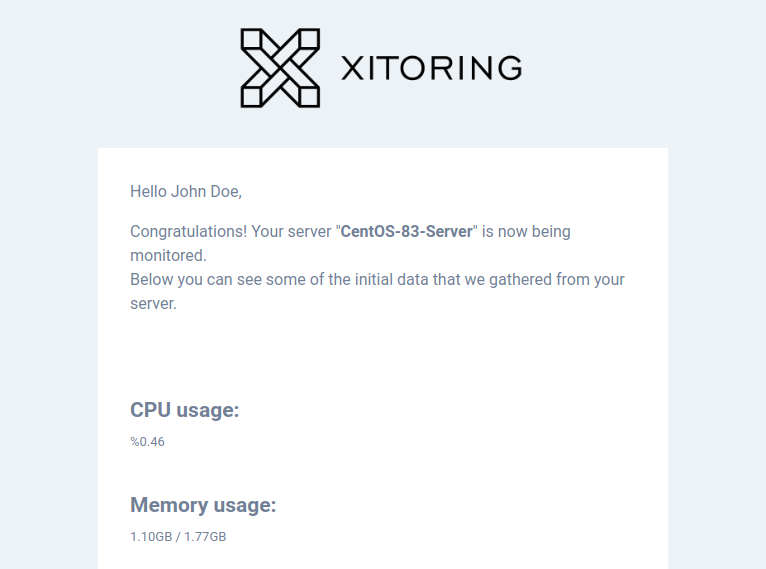
after you get this email the server will be available to monitor and config in your Xitoring dashboard. Also, you can add more checks, run manual discovery, or configure triggers.
Alert the right person, in the right way
Seamless integration with your favorite communication tools ensure you never miss a critical alert.
Linux Server Graphs
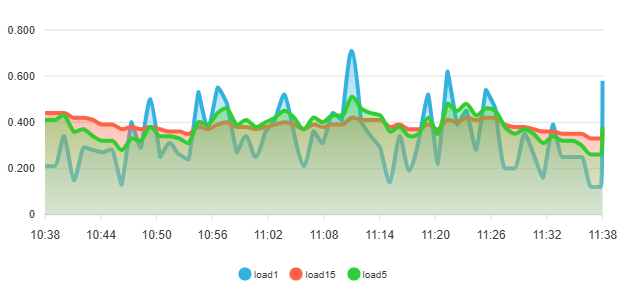
Load Average
A measure used by Linux users to monitor system resources is called load average. You can also keep an eye on how the system resources are being used. Despite being one of the most fundamental measurements of resource utilization, load average is useless unless you know what it means for the user. Xitoring helps you understanding the server load avrages, create triggers and alert for them.
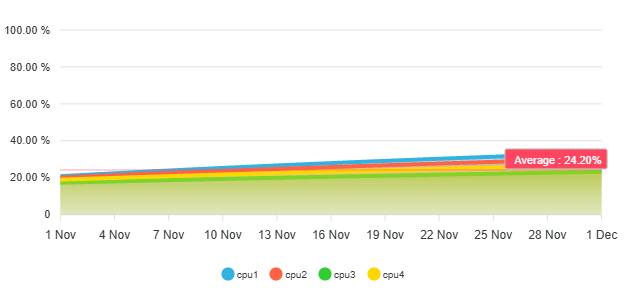
CPU Usage
Every minute, Xitoring tracks your CPU consumption across all units and cores. You can configure triggers and alarms to alert you when you reach a certain threshold, or you can view historical graphs to see how you've been performing on busy days.
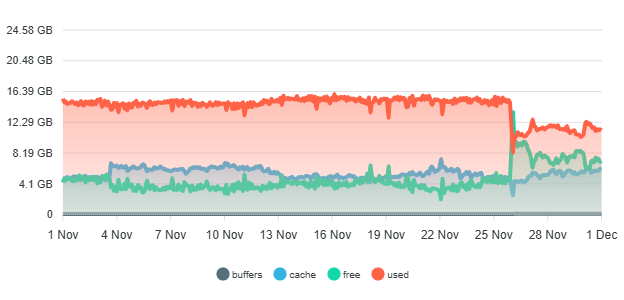
Memory Usage
It's crucial to keep track of memory utilization to ensure that the server's apps are all functioning properly. With Xitoring, you can configure triggers and alarms to be notified when free or used memory reaches predetermined thresholds and view historical graphs of memory utilization.
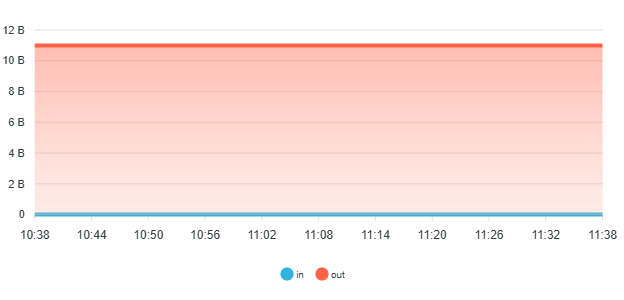
Network
For each of your network adaptors, Xitoring generates graphs, and just like other server components, you can set up triggers to receive notifications when something is wrong.
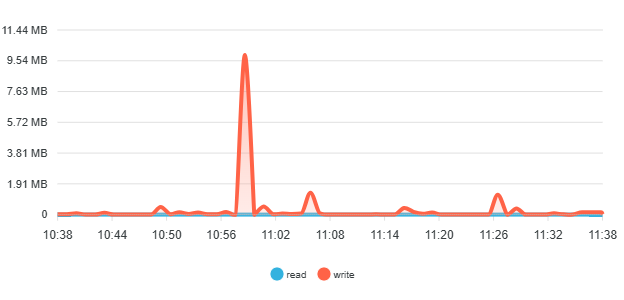
Disk IO
Even though there are numerous low-latency drives on the market today, such as NVMe and SSDs, disk IO problems on apps are very common, thus it's crucial to make sure the server's disk IO is functioning properly. Additionally, you can configure triggers to get alarms when the expected level of disk IO is exceeded.
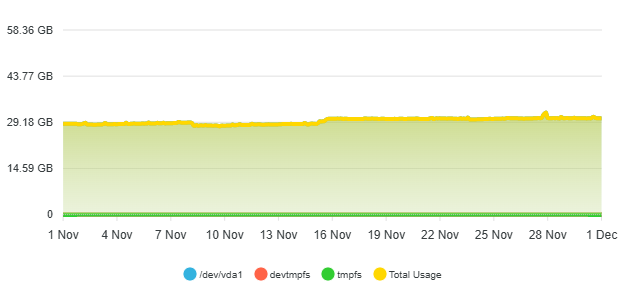
Disk Usage
One of the components that most people believe is never important to monitor is disk usage, yet it is. If your disk utilization exceeds 90%, you run the risk of experiencing database problems as well as other apps and services that are unable to function properly due to a lack of storage space. Xitoring offers historical disk utilization statistics, and you can also set up triggers to receive notifications when the space is getting crowded.
Start Monitoring Your Servers in Minutes
Sign up today and gain complete visibility into your system’s health — no missed alerts, no performance surprises.
Linux Server monitoring FAQ
What's Xitogent?
Xitogent is Xitoring’s agent on your server. It communicates with our application core and sends frequent data about usage statistics of your server components for monitoring and graph generation purpuse.
How will Xitogent be installed on my server?
On Linux: Xitogent is provided in both RPM and Deb packages that you can install by adding the Xitoring repository to your package manager.Also, we provide an easy command that you can copy-and-paste to install Xitogent on your server.
On Windows Server: Xitogent will be installed via a Powershell command automatically by using it’s built in installer.
What if I have a big number of servers that should be monitored using Xitogent?
For Linux servers we have implemented an Ansible Playbook in which you can deploy and register Xitogent on multiple servers using one command.
What types of data is gathered by Xitogent?
Mostly systems statistics like CPU Usage, Memory Usage, Load Average, Detect installed software, Disk I/O data, and many more that you can read about in the documentation.
Where does Xitogent send server statistics?
We have a global node architecture that gathers and analyzes server data and also probes them. As you register your server on Xitoring the nearest node to your server will be selected and it will store and analyze the statistics that Xitogent sends.
Do I have to have a lot of experience with CMD/Terminal to use Xitogent on my Server?
You can register your server(s) using just one command which is available in the Add Server section in Xitoring. for more information on our one-command installation method check out the documentation.
What other dependencies will be installed along with Xitogent?
Xitogent is one binary file that is not dependent on any software or interpreter to run, So no dependencies are going to install along with Xitogent on any Linux/Windows Server.
What will happen after I register my server with Xitogent?
After the registration part, you will receive an email informing you that your Server is now being monitored along with some initial data that was just gathered by Xitogent. Also, you can navigate to the Servers page in Xitoring app and check out all of your server’s data.
What other dependencies will be installed along with Xitogent?
Xitogent is one binary file that is not dependent on any software or interpreter to run, So no dependencies are going to install along with Xitogent on any Linux/Windows Server.
Does Xitogent have a bug footprint on my server's resources?
Xitogent is created and optimized to gather statistics and data on any server even containers with the least hardware resources, with close to no footprint.
Does Xitogent expose itself on the internet in order to send statistics?
No, Xitogent uses one-way communication with Xitoring servers using HTTPs requests and it’s all encrypted. and it will NOT open or forward ports on the Host server.
Does Xitogent do anything other than gathering and sending statistics?
No, Xitogent does not commit any actions on the host server.