Picking the wrong infrastructure monitoring tool in 2026 isn't a missed feature — it's a stealth tax. The agent eats more CPU than your application. The "starting at $15/host" landing page turns into a $4,000 invoice once custom metrics turn on. The platform that promised one pane of glass quietly ships three separate dashboards and one extremely cheerful sales rep.
This guide compares twelve infrastructure monitoring tools real engineering teams are running this year — all-in-one platforms, focused vendors, and the open-source stacks people keep insisting are "free." Each entry covers what it actually monitors, where it falls short, and what it costs at 5, 50, and 500 hosts. We also call out — for each tool — what it won't help with, so a free trial doesn't turn into a procurement detour. Xitoring builds one of these tools. We've written the comparison to be honest about where the others are stronger.
What "Infrastructure Monitoring" Actually Covers in 2026
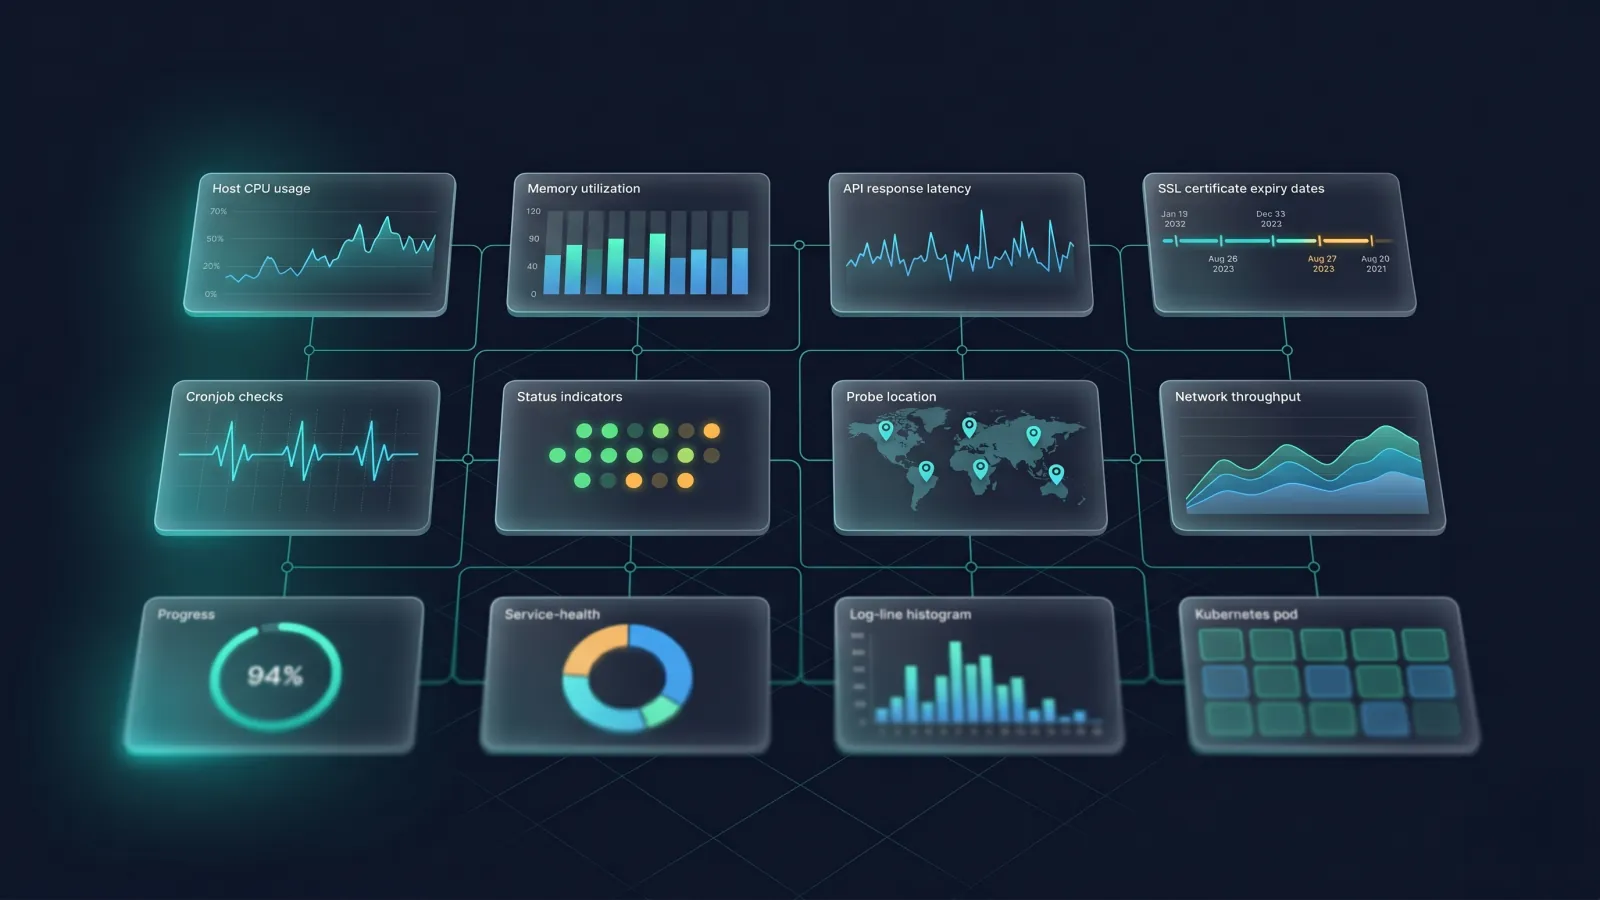
Infrastructure monitoring is the continuous collection, alerting, and visualization of health signals from the systems your application runs on — servers, networks, cloud resources, containers, and the public-facing services that prove the whole stack is reachable. Modern infrastructure monitoring goes beyond CPU and disk; it includes uptime checks, SSL certificate expiry, cronjob and heartbeat signals, and per-service health for everything from Nginx to PostgreSQL.
The old definition — "watch CPU, RAM, and disk; email when red" — was already thin in 2020 and is openly broken now. In a 2026 production environment, infrastructure means a hybrid sprawl: a few private datacenter racks, two or three public clouds, Kubernetes for some workloads and bare-metal VMs for others, Linux and Windows, ARM nodes for the cost-conscious, x86 for the legacy. A monitoring tool that only sees host metrics misses most of the failures that matter.
The signals a real infrastructure monitoring tool needs to cover:
- Host metrics — CPU, memory, disk I/O, network throughput, load average, per-process resource use.
- Service health — auto-discovered status of Nginx, MySQL, Redis, Docker, Kubernetes, IIS, Active Directory, message queues, and the dozens of background processes that quietly hold production together.
- Uptime and reachability — synthetic checks from multiple geographies confirming the website, API, or TCP port is actually serving traffic. Server says it's healthy but customers can't reach it counts as down.
- SSL/TLS certificates — expiry, chain validity, cipher strength. Forgotten certs cause more outages than most teams admit.
- Cronjobs and heartbeats — silent failures of scheduled jobs are still the single most common cause of "we lost three days of data and didn't notice."
- Alerting that respects the on-call engineer — routing, escalation, deduplication, noise suppression.
Adjacent categories that aren't infrastructure monitoring, even when sales decks blur the line: application performance monitoring (APM) traces code-level latency, log management ingests and indexes log lines, real user monitoring (RUM) watches browser sessions, and security monitoring watches for intrusions. The strongest infrastructure tools either ship some of those or integrate cleanly with them — but if your problem is "my Python service is slow," that's APM, not infrastructure.
How We Evaluated These Infrastructure Monitoring Tools
Seven criteria, weighted for a real engineering team in 2026:
- Coverage scope — Does it cover hosts, network, cloud, containers, plus uptime, SSL, and cronjob signals, or does it stop at the host boundary and force three extra tools?
- Agent footprint — Real CPU and RAM impact at idle. A monitoring agent should not register on the workload it's monitoring.
- OS coverage — Linux distributions (and ARM as well as x86), Windows Server versions, container runtimes. Modern fleets are mixed; tools that pretend otherwise are quietly obsolete.
- Service depth and auto-discovery — Does it find and monitor your databases, web servers, queues, and container runtimes without manual configuration, or does it need a YAML file per service?
- Alerting — Channel coverage, on-call routing, escalation policies, noise suppression, root-cause hints.
- Honest pricing at 5 / 50 / 500 hosts — Including the predictable overages (custom metrics, container monitoring, log ingestion). We quote vendor list prices and model the realistic bill, not just the headline number.
- What it does not do — Every tool draws a boundary somewhere. We name the boundary up front so a free trial doesn't end in disappointment.
Quick Comparison Table
Skip the table the first time you read this — read the tool entries, then come back for the side-by-side. Honest reads of monitoring tools live in the prose, not the checkboxes.
| Tool | Best for | OS coverage | Pricing model | Beyond hosts? | Free tier | Starting price |
|---|---|---|---|---|---|---|
| Xitoring | All-in-one foundation monitoring | Linux (x86 + ARM), Windows Server | Flat per-host + per-monitor | Yes — uptime, SSL, API, cron, status page | Yes — no credit card | $4.99/mo |
| Datadog | Cloud-native enterprises with budget | Linux, Windows, macOS, containers | Per host + per ingested unit | Yes — add-ons for logs, APM, RUM, security | Trial only | $15/host/mo (Pro, annual) |
| New Relic | APM-led teams that want one platform | Linux, Windows, macOS, containers | Per user + per GB ingested | Yes — APM, logs, browser, mobile | Yes — 100 GB + 1 user | $10/first user, $99/additional |
| Dynatrace | Enterprise observability with AI ops | Linux, Windows, containers | Per memory-GiB-hour + DPS | Yes — APM, RUM, AppSec, logs | Trial only | $29/host/mo (Infra) or $58/8-GiB host (Full-Stack) |
| Prometheus + Grafana | Kubernetes-native engineering orgs | Linux, container-first | OSS (self-hosted) | Partial — via exporters; no uptime/SSL/cron | Yes — free OSS | Free + operational time |
| Zabbix | Traditional infra at scale, OSS-first | Linux, Windows, network devices | OSS (self-hosted) | Partial — limited reachability checks | Yes — free OSS | Free + operational time |
| SigNoz | OpenTelemetry-native cloud-native teams | Linux, containers, K8s | Cloud per-GB or OSS | Partial — metrics + traces + logs; no uptime | Yes — free OSS | Cloud from low-single-digit $/GB |
| Better Stack | Logs + uptime + status pages, mid-market | Linux, Windows | Per logging GB + per monitor | Yes — uptime, status, on-call | Yes | Free, then ~$25/mo |
| Nagios XI | Sysadmin teams with Nagios muscle memory | Linux, Windows (via plugins) | Perpetual license + maintenance | Partial — plugin-dependent | Yes — Nagios Core OSS | XI: ~$2,000+ perpetual |
| Site24x7 | All-in-one for SMBs at Zoho prices | Linux, Windows, containers, network | Plan-based bundles | Yes — uptime, network, APM | Trial only | Single-digit $/month per server tier |
| PRTG | Network-led IT with mixed device estates | Windows host, monitors anything | Sensor-based perpetual or subscription | Yes — sensors for uptime, SSL, ping | Yes — 100 sensors free | From ~$2,150 perpetual (500 sensors) |
| Checkmk | Hybrid teams wanting Nagios power, modern UI | Linux, Windows, containers, network | Raw (OSS) or Enterprise per-host | Yes — strong service checks | Yes — Raw Edition free | Enterprise: per-host annual |
Prices above are vendor list as of May 2026 — every commercial tool charges more for "modules" not in its starting tier (custom metrics, log ingestion, RUM, security). The Decision Framework section below maps real-world stacks to recommended tools.
The 12 Best Infrastructure Monitoring Tools for 2026
1. Xitoring
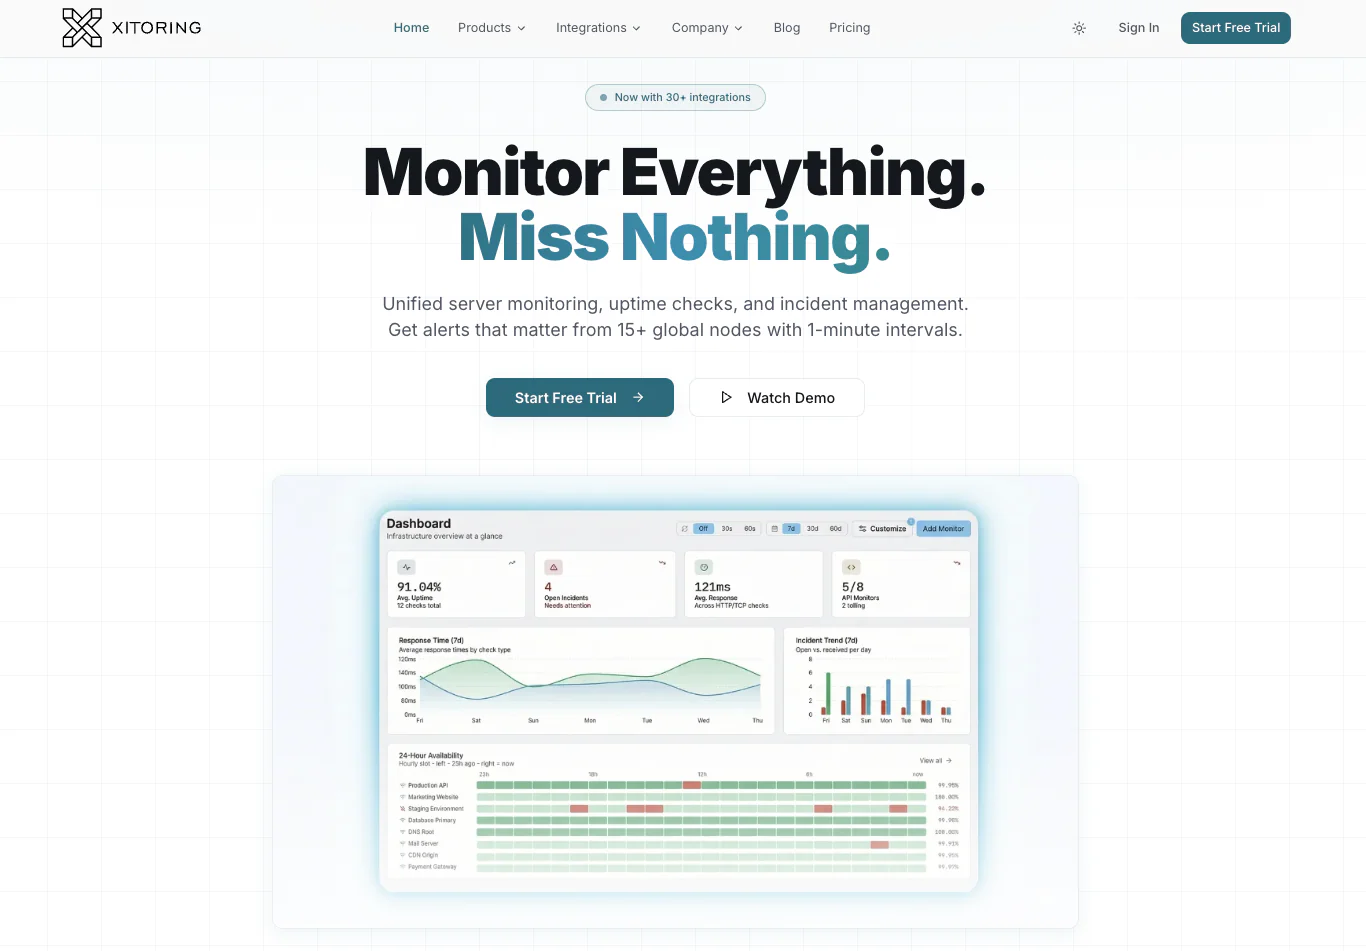
Best for: Engineering teams that want infrastructure monitoring, uptime checks, SSL, cronjobs, API checks, and a status page on one bill and one alerting engine.
Xitoring is built for the exact shape of 2026 monitoring: a team that runs a real production stack but doesn't want to assemble it from four different vendors. Where most infrastructure monitoring tools cover host metrics and stop there, Xitoring ships server monitoring, uptime checks, cronjob and heartbeat monitoring, SSL certificate monitoring, API monitoring, and public/private status pages in a single product. The agent (Xitogent) is intentionally lightweight, pricing is flat and posted, and the alerting engine is unified — so one rule routes a database outage and a missed cron job through the same notification roles.
Key features:
- Cross-platform agent — Xitogent runs on Ubuntu, Debian, CentOS, RHEL, Fedora, Amazon Linux, SUSE, Arch, Alpine, both x86 and ARM, plus Windows Server 2016/2019/2022 LTSC. One-line install on Linux; MSI installer on Windows.
- 30+ service integrations auto-discovered per host — Nginx, Apache, MySQL, PostgreSQL, MariaDB, MongoDB, Redis, Docker, IIS, MSSQL, Active Directory, HAProxy, Elasticsearch, RabbitMQ, Kafka.
- 15+ global probing nodes for uptime checks, with regional reachability that catches the failures a single-region probe misses.
- 20+ notification channels — Slack, Teams, Discord, Telegram, WhatsApp, SMS, voice call, PagerDuty, OpsGenie, webhooks, Zapier.
- Notification roles and escalation that route critical alerts to on-call engineers and informational signals to muted channels — directly attacking alert fatigue.
- Flat pricing from $4.99/mo for the Synthetic plan, $24.99/mo for the Server plan, and a free tier that needs no credit card. Free for students, one year free for startups, free for life for non-profits and open-source projects.
Pricing at scale: A 50-host fleet on Xitoring's server plan lands in the low-to-mid hundreds per month all-in, including the uptime, SSL, cron, and status page features that would each be a separate vendor on a Datadog stack.
What Xitoring won't help with: No distributed log aggregation, no APM trace flame graphs, no real user monitoring. Teams that need code-level latency analysis or indexed search across terabytes of log lines will pair Xitoring with a focused log platform (Loki, Better Stack, or similar) and an APM tool.
Bottom line: Strongest pick for a 5–500 host engineering team that values consolidation, transparent pricing, and an alerting engine that doesn't need a half-day training session.
2. Datadog
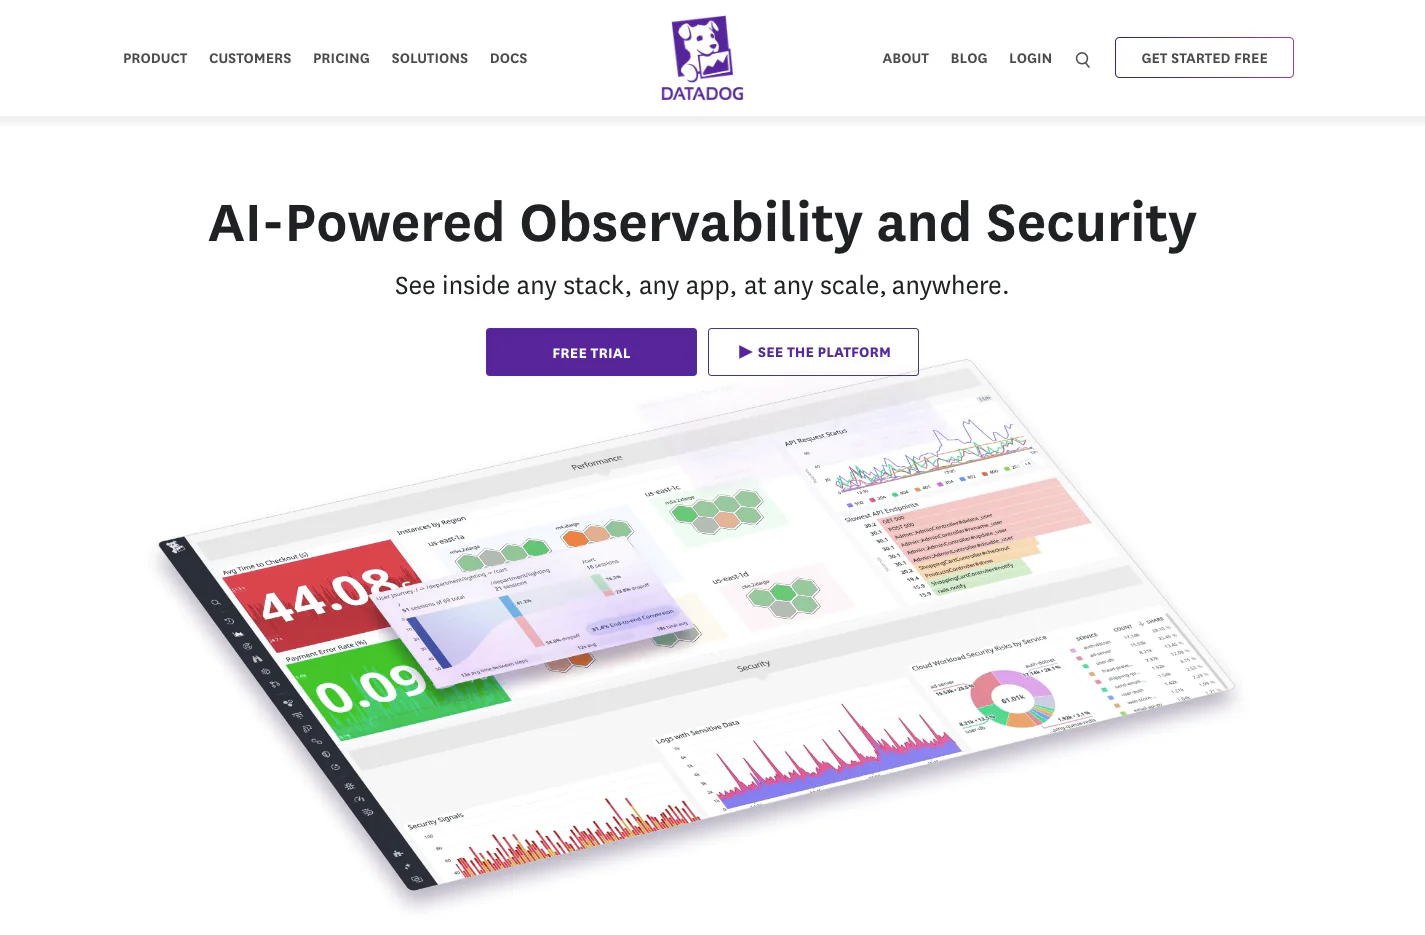
Best for: Cloud-native enterprises that already pay for APM and logs and want infrastructure monitoring tightly correlated with both.
Datadog is the heavyweight in the category — full-stack observability covering infrastructure, APM, logs, RUM, security, network performance, and a hundred other modules. The infrastructure monitoring piece is mature, the integrations are dense (700+), and the cross-product correlation is genuinely best-in-class. If a customer-facing alert fires, you can pivot from the infrastructure dashboard to the APM trace to the related log line in two clicks.
Key features:
- 700+ pre-built integrations covering Kubernetes, every major cloud, common databases, and obscure SaaS endpoints.
- Anomaly detection, forecasting, and outlier detection on metrics — production-grade and battle-tested.
- Watchdog AI surfaces likely root causes correlated across infra, APM, and logs.
- Cloud-native first — Kubernetes monitoring is among the best in the category.
Pricing reality: Infrastructure Monitoring lists at $15/host/month on the Pro tier (annual) and $23/host/month on Enterprise. APM is $31/host/month additional. Where the bill actually grows: custom metrics, container monitoring overages, indexed logs, and the "we just turned on RUM to see what would happen" moment. A 50-host fleet that thought it would pay $750/month routinely lands north of $3,000/month after the first overage cycle. A 500-host fleet on the full platform is a five-figure monthly invoice.
What Datadog won't help with: Buyer remorse. The pricing model is the single most-discussed thing about this product on every engineering Slack in the industry. Datadog also doesn't lean into uptime, status pages, or cronjob monitoring as first-class features — teams still bolt those on.
Bottom line: Pick Datadog if you already have the budget shape for it, your team correlates traces with infra daily, and the unit economics of usage-based billing match how you run software. Otherwise expect the renewal conversation to get tense.
3. New Relic
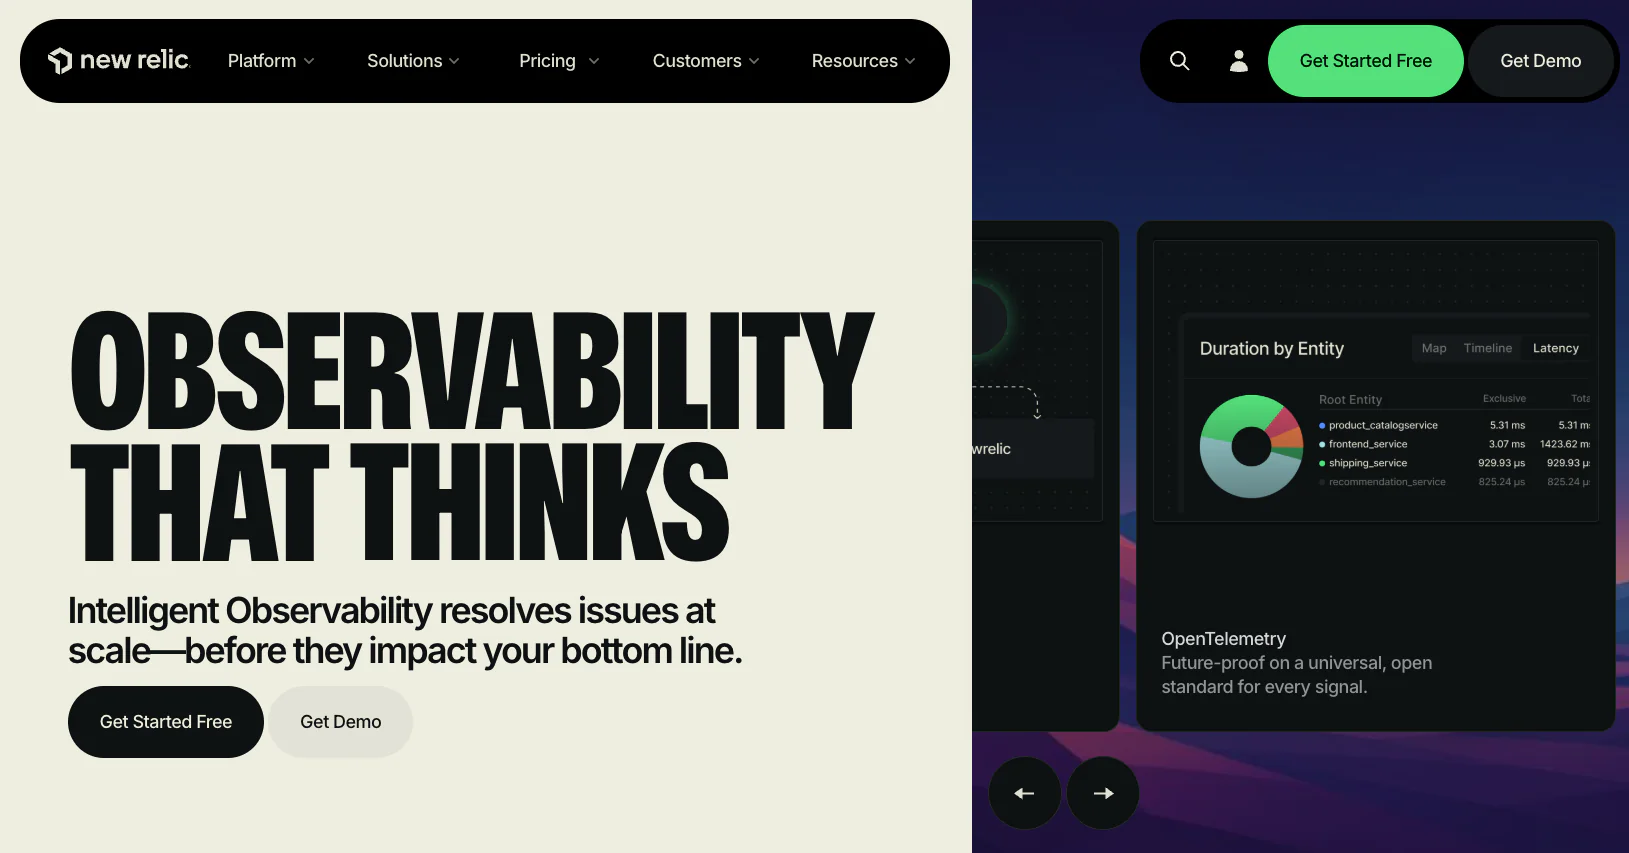
Best for: APM-led teams that want a single observability platform and treat infrastructure monitoring as one signal among many.
New Relic pivoted to a usage-based pricing model in 2020 and has stayed there — no per-host fee, just per user and per GB of ingested data. The infrastructure agent is solid, the unified dashboard pulls APM and infrastructure together cleanly, and the free tier (100 GB ingest, 1 full platform user) is genuinely useful for small teams or for evaluating the product without a sales call.
Key features:
- New Relic Infrastructure agent with built-in integrations for AWS, Azure, GCP, Kubernetes, Docker, and 30+ on-host services.
- Telemetry data platform that accepts OpenTelemetry, Prometheus, and arbitrary custom events through a single ingestion path.
- NRQL — a powerful SQL-like query language for ad-hoc analysis across metrics, traces, logs, and events.
- APM is historically the New Relic differentiator and remains strong.
Pricing reality: Free tier covers 100 GB ingest and 1 full platform user. Beyond that, Standard tier is $10 for the first full platform user and $99 for each additional (up to 5). Pro tier is $349/user (annual), $418.80/user (monthly). Data overage is $0.40/GB on the original plan, $0.60/GB on Data Plus. The user-based model is good if you have a few engineers and a lot of hosts; punishing if you have a big team and modest data volume.
What New Relic won't help with: Predictable bills when log sources get noisy. A misconfigured logger has spiked more than one New Relic invoice into "incident-grade event" territory. Uptime monitoring, status pages, and cronjob monitoring are also weaker — teams still bolt on dedicated tools for those.
Bottom line: Best pick for teams already deep into APM-driven observability, with a small platform-engineering team and predictable telemetry volume. Watch the data ingestion budget like a hawk.
4. Dynatrace
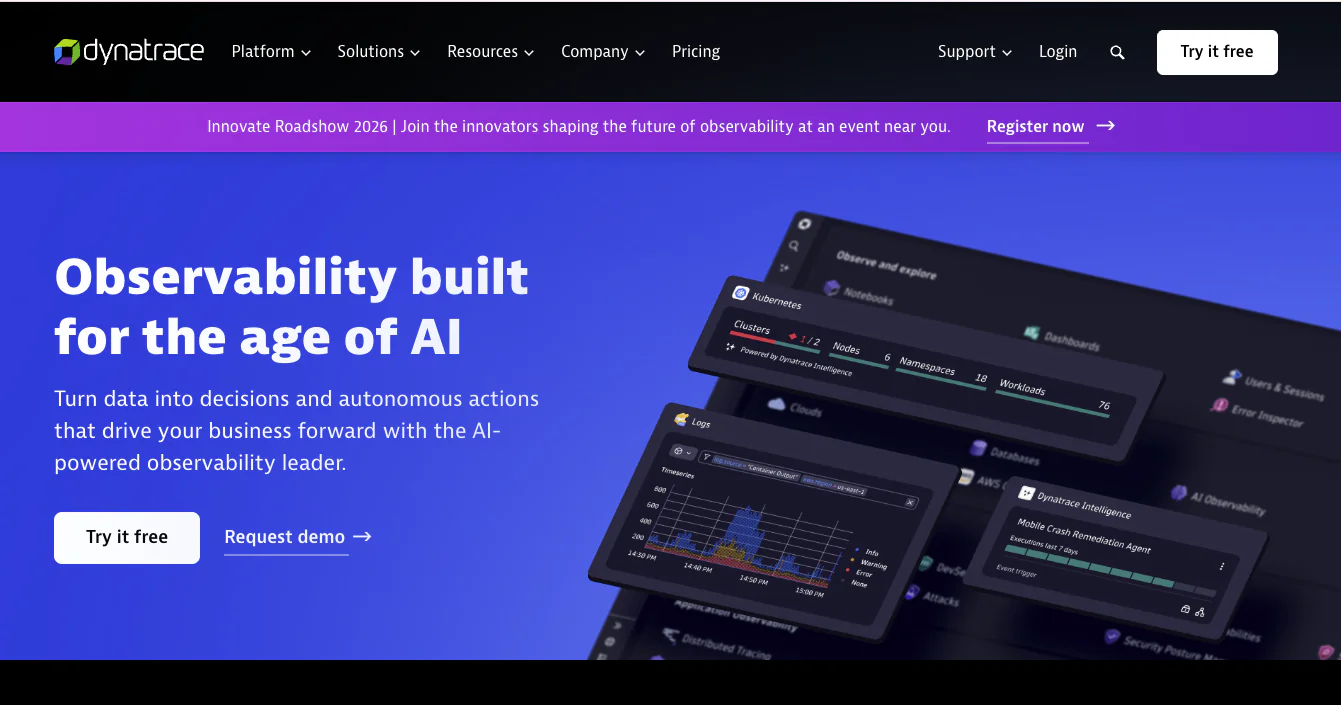
Best for: Enterprise platform teams that want AI-driven root cause analysis and have the budget to match.
Dynatrace is the enterprise-credentialed full-stack observability platform — heavy AI ops branding (Davis), automated dependency mapping, distributed tracing built into the core, and a sales motion that's distinctly enterprise. The OneAgent installs once per host and discovers applications, processes, and infrastructure relationships without manual config.
Key features:
- Single OneAgent that handles infrastructure, APM, RUM, and logs.
- Davis AI for automated root cause analysis and incident correlation.
- Automated dependency discovery — the Smartscape view maps relationships across hosts, processes, services, and external dependencies without manual tagging.
- Strong Kubernetes and OpenShift integration.
Pricing reality: Full-Stack Monitoring lists at $58 per 8-GiB host per month (effectively $0.01 per memory-GiB-hour). Infrastructure-only Monitoring is $29/host/month, and the cheaper Foundation & Discovery tier is $7/host/month for the lightest scope. Dynatrace charges in Davis Pricing Subscription (DPS) units for higher-tier modules; the platform supports multi-year and volume discounts. There is no usable free tier — evaluation is through a 15-day trial only.
What Dynatrace won't help with: Small-team economics. The product is engineered for enterprises and the entry price reflects it. The UI is power-user-dense; expect a real onboarding curve. Uptime, status pages, and cronjob monitoring aren't first-class — they're handled through synthetic monitors that are perfectly capable but unbundled.
Bottom line: Strong pick for a platform engineering org at 200+ hosts that values automated correlation and has budget for enterprise tooling. Overkill below that.
5. Prometheus + Grafana
Best for: Engineering organizations with Kubernetes-scale infrastructure and dedicated SRE capacity.
Prometheus is the de facto open-source standard for metrics in cloud-native environments. Pair the Prometheus server with node_exporter, Alertmanager, and Grafana for visualization, and you have the most common self-hosted infrastructure monitoring stack in the industry — especially anything running on Kubernetes via the Prometheus Operator.
Key features:
- Pull-based metrics scraping that scales naturally in Kubernetes through the Prometheus Operator.
- PromQL — a powerful query language that has effectively become a hiring filter for senior platform engineers.
- Hundreds of community-maintained exporters covering every common server service.
- Grafana for dashboards is the de facto standard for telemetry visualization.
Pricing reality: Free in license. Real cost is engineering time: storage sizing, long-term retention strategy (Thanos, Cortex, Mimir, VictoriaMetrics — pick one), Alertmanager routing logic, high-availability, federation across regions, agent rollout, dashboard discipline. A capable platform engineer running this stack at 100+ hosts is at least 0.5 FTE of effort.
What Prometheus won't help with: Anyone who needs uptime monitoring, SSL certificate checks, cronjob monitoring, status pages, or APM out of the box. Each is achievable with a separate tool or exporter, but assembly is required. Grafana Cloud's managed offering closes some of these gaps but adds cost.
Bottom line: The right answer for a team running Kubernetes at scale with at least one dedicated SRE. Wrong answer for a small team that thinks "free" means "cheap" — operational time has a salary number on it.
6. Zabbix
Best for: Traditional infrastructure operations teams running OSS-first at thousands of hosts.
Zabbix has been the open-source enterprise monitoring incumbent for two decades and remains one of the most capable free tools in the category. Distributed architecture, agent-based and agentless collection, full alerting and escalation logic, and a strong template ecosystem. Where Prometheus is cloud-native-first, Zabbix is at home with classic server fleets, SNMP-heavy networks, and Windows-plus-Linux mixed environments.
Key features:
- Scales to tens of thousands of monitored hosts on appropriately sized hardware.
- Zabbix Agent 2 runs lightly on Linux and Windows.
- Built-in support for SNMP, IPMI, JMX, ODBC, and dozens of databases.
- Distributed proxy architecture for monitoring across network segments.
Pricing reality: Free in license, with a commercial support arm if needed. As with Prometheus, the real cost is the operations team running it — Zabbix server sizing, database tuning (PostgreSQL with TimescaleDB is the modern recommendation), template design, and UI care all take engineering time.
What Zabbix won't help with: Modern aesthetic expectations. The UI is functional but generations behind cloud-native peers. Native APM, distributed tracing, and log correlation are weaker than the commercial competitors. Uptime monitoring from global locations isn't a native concept — you'd run external probes through a separate tool.
Bottom line: Strong fit for OSS-first IT operations teams with mature self-hosting capability. Less ideal for engineering-first teams who'd rather PromQL.
7. SigNoz
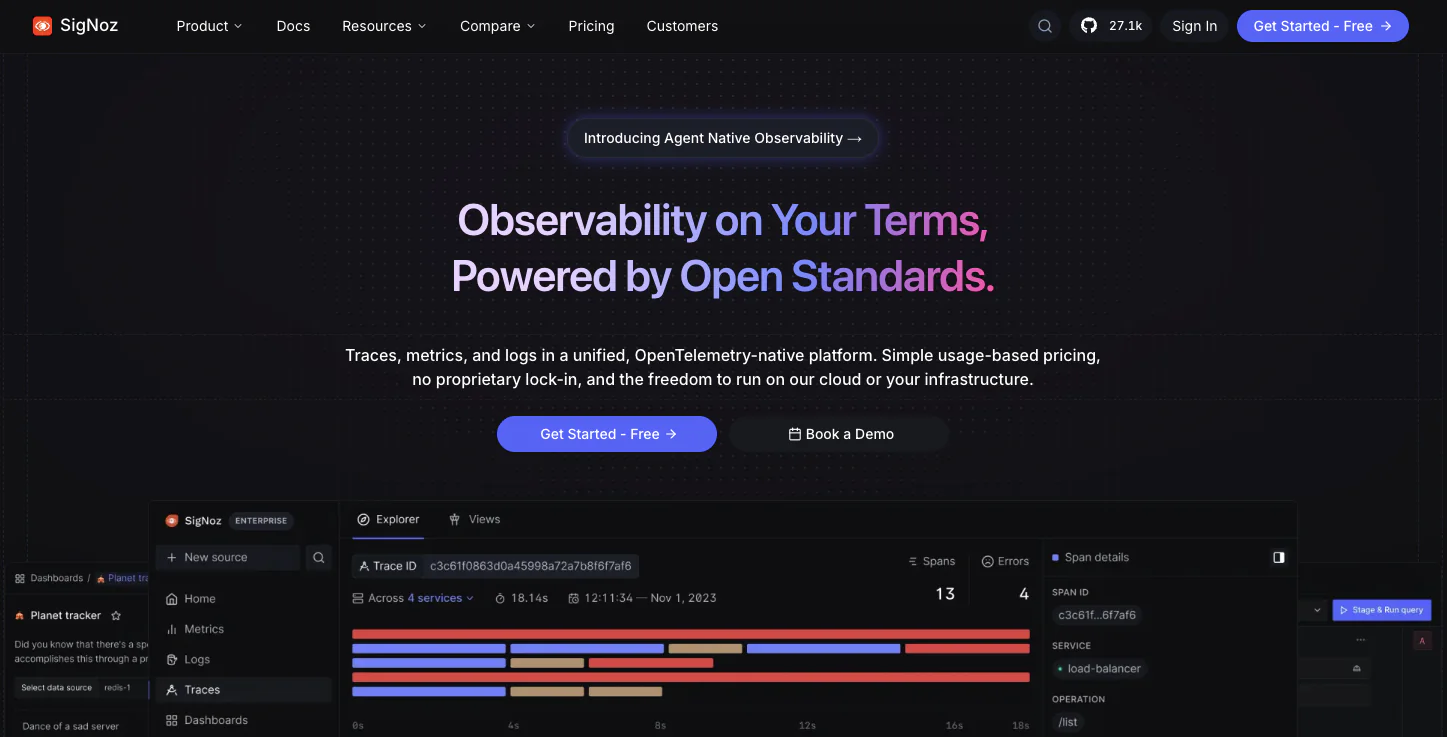
Best for: Modern engineering teams adopting OpenTelemetry as the standard telemetry pipeline.
SigNoz is an open-source, OpenTelemetry-native observability platform that emerged in the past few years as a credible challenger to the commercial heavyweights. Built on the ClickHouse database, it handles metrics, traces, and logs in a single backend, which makes high-cardinality data and long retention substantially cheaper than legacy time-series storage.
Key features:
- OpenTelemetry-native from the ground up — no proprietary agent lock-in.
- ClickHouse-backed storage for fast, high-cardinality queries at relatively low cost.
- Unified metrics, traces, and logs in one UI with cross-pivot.
- Both self-hosted (free OSS) and SigNoz Cloud (managed, usage-based) deployment options.
Pricing reality: Self-hosted is free in license. SigNoz Cloud is usage-based — single-digit dollars per GB of ingested telemetry, with the lower price floor coming from ClickHouse efficiency.
What SigNoz won't help with: Out-of-the-box uptime monitoring, SSL checks, status pages, or cronjob heartbeats. SigNoz focuses on the metrics + traces + logs core; reachability and certificate signals live elsewhere in your stack.
Bottom line: Compelling option for cloud-native teams that have committed to OpenTelemetry and want a credible alternative to per-host or per-user pricing. Pair with a dedicated uptime tool.
8. Better Stack
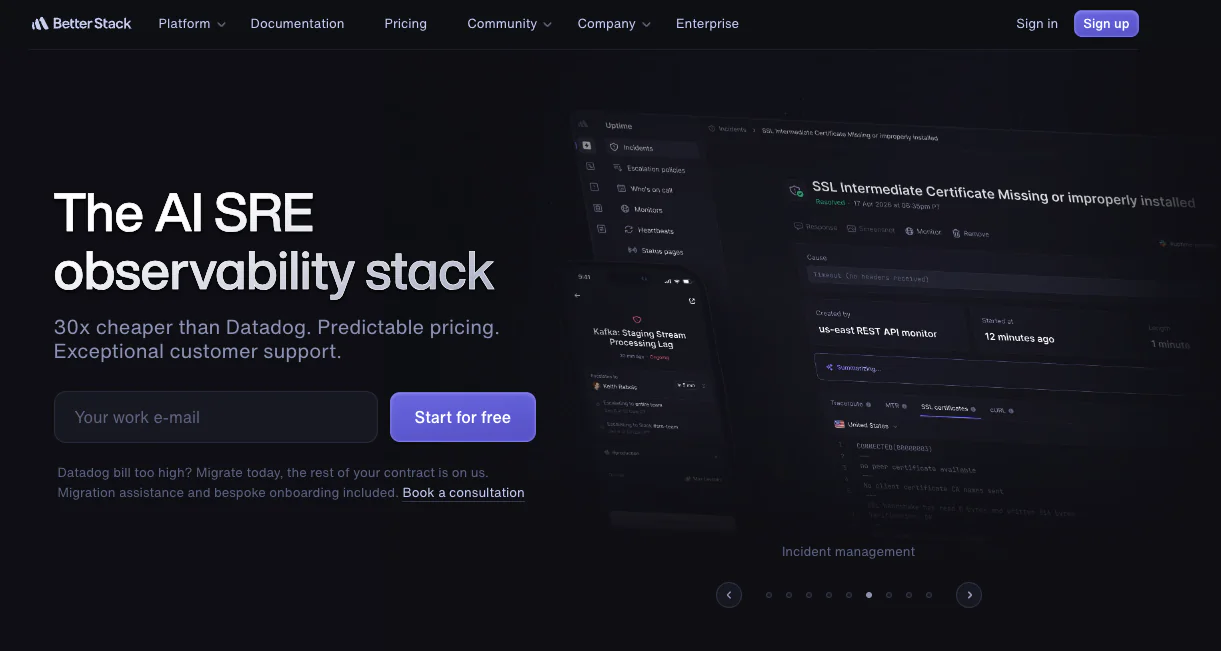
Best for: Mid-market engineering teams that want logs, uptime, and status pages in one product with clean pricing.
Better Stack (formerly Logtail + Better Uptime) bundles log management, uptime monitoring, on-call scheduling, status pages, and infrastructure monitoring into a single product with a notably modern UI. The pricing is clearer than most of the heavyweight platforms and the free tier is genuinely usable.
Key features:
- Strong log management with structured logging support and useful search performance.
- Uptime monitoring from global locations with on-call schedules and incident management built in.
- Custom-branded status pages, including private status pages for internal stakeholders.
- Infrastructure monitoring is the newer module, built on top of OpenTelemetry.
Pricing reality: Free tier covers small teams with limited monitors and modest log retention. Paid tiers start in the mid-double-digit dollars per month range and scale with logging volume and number of monitors. Cleaner than per-host-plus-overage models, less aggressive than $0.40/GB ingestion fees.
What Better Stack won't help with: Deep host-level service auto-discovery at the breadth of Datadog, Xitoring, or Zabbix. The infrastructure module is newer and less mature than the logs and uptime pieces. APM is also not native.
Bottom line: Strong pick for teams whose primary pain is "logs are too expensive at Datadog and uptime feels like a separate vendor" — Better Stack collapses both into a clean product.
9. Nagios XI
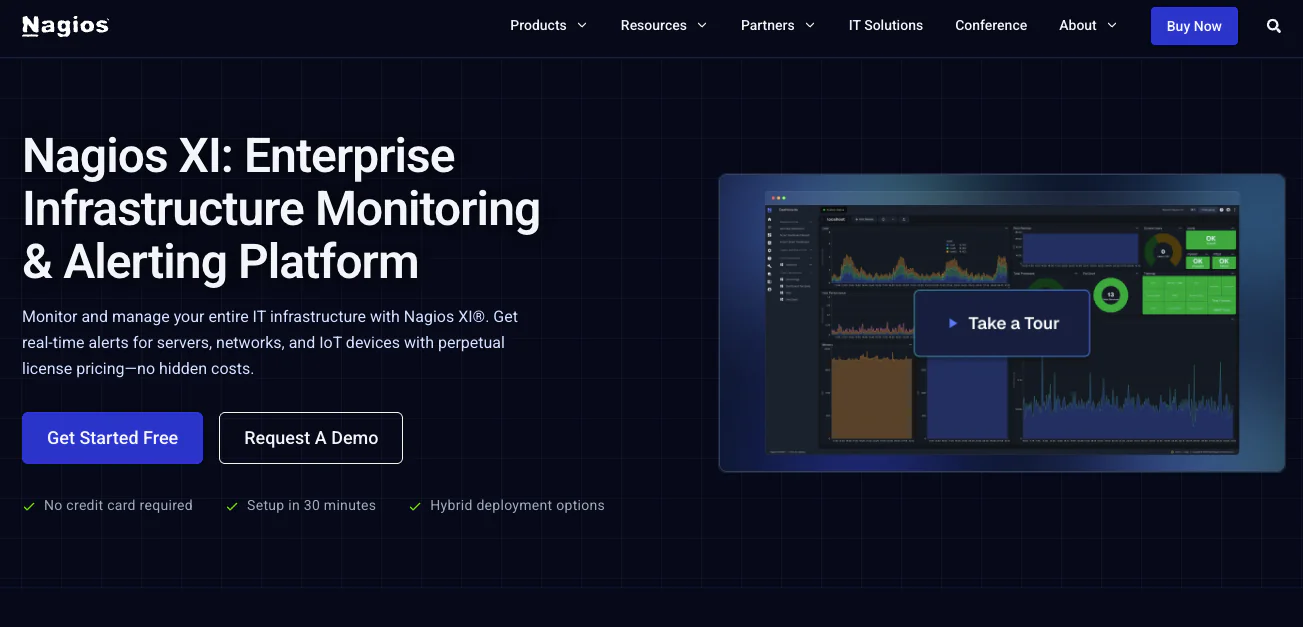
Best for: Established sysadmin teams with deep Nagios muscle memory and a stable on-premises environment.
Nagios is the genealogical ancestor of half the tools on this list. Nagios XI is the commercial wrapper around Nagios Core — same plugin model, same configuration language, same NOC-screen aesthetic, but with a packaged installer, a paid support line, and a web UI that doesn't require manual config edits to add a host.
Key features:
- 5,000+ community plugins covering effectively every server service ever shipped.
- Mature alerting and escalation logic, well-understood by ops teams across generations.
- Predictable on-premises deployment with perpetual licensing available.
- Strong reputation in regulated and air-gapped environments.
Pricing reality: Nagios Core is free OSS. Nagios XI starts at roughly $2,000+ as a perpetual license for the standard tier, with annual maintenance for updates and support.
What Nagios XI won't help with: Modern aesthetic, cloud-native idioms, and distributed tracing. Configuration is text-file-heavy by design, the UI is generations behind cloud-native peers, and newer features like AI-assisted anomaly detection aren't first-class. New teams in 2026 rarely start with Nagios.
Bottom line: If your team already runs Nagios, the switching cost of staying is zero. For new projects, the modern alternatives win on usability.
10. Site24x7
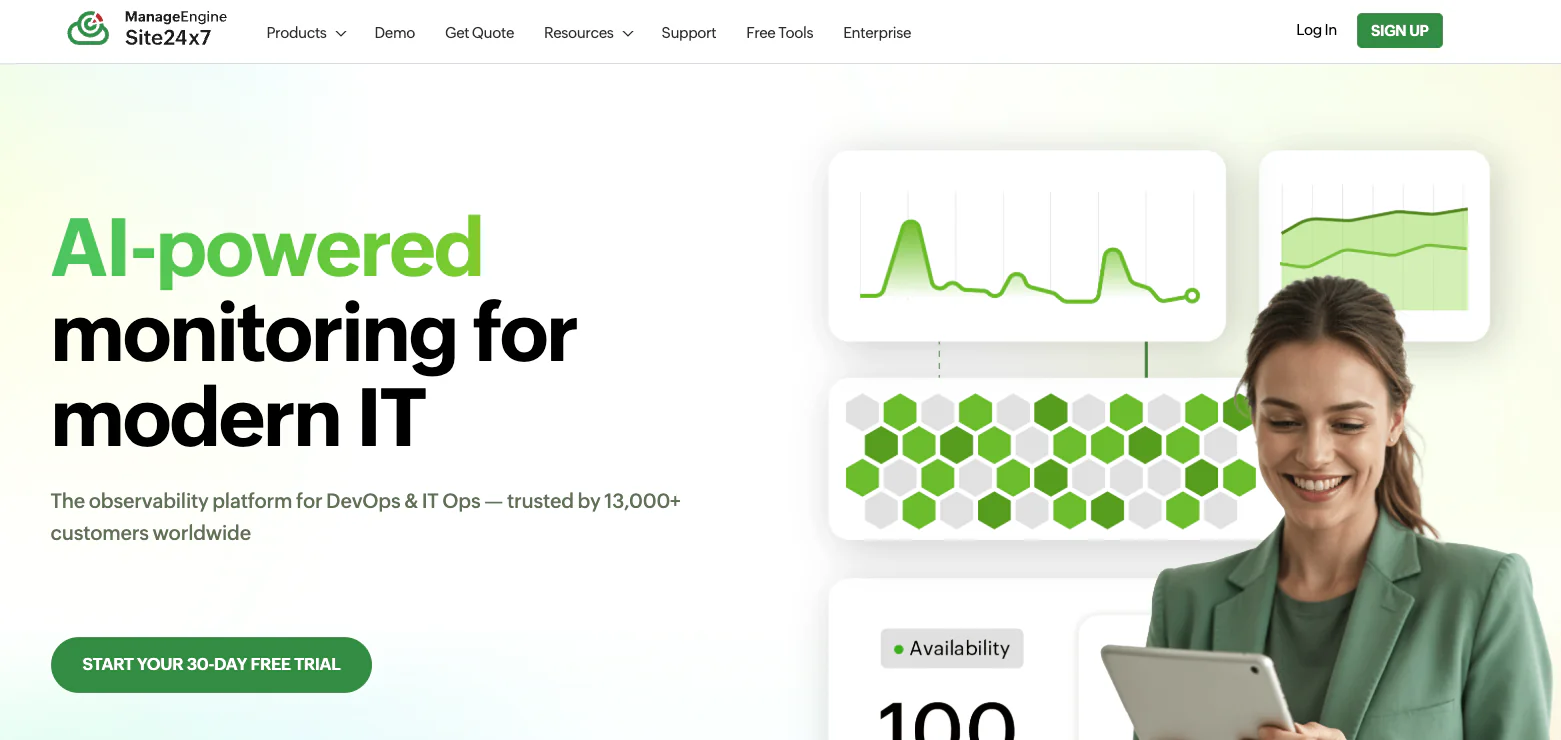
Best for: SMBs that want a wide all-in-one monitoring suite at Zoho-aggressive pricing.
Site24x7 (a ManageEngine / Zoho product) competes directly in the all-in-one space — server monitoring, uptime monitoring, network monitoring, APM, and cloud monitoring under one product. Pricing is plan-based bundles rather than a per-host meter, and the entry tiers are notably cheaper than the cloud-native incumbents.
Key features:
- 100+ global locations for uptime probing.
- Server monitoring for Linux and Windows, plus VMware, Hyper-V, Docker, and Kubernetes.
- Network monitoring across SNMP devices, including switches, routers, and firewalls.
- Plugin SDK for custom metric collection.
Pricing reality: Plans bundle a fixed allocation of servers, websites, and network devices for a single monthly fee. Entry tiers land in the single-digit-dollar-per-server-per-month range when amortized. The structure is friendly to SMBs but harder to map to large fleets with non-bundled needs.
What Site24x7 won't help with: Depth where it matters. The product is broad rather than deep — dashboarding doesn't go as far as Datadog or land as clean as Xitoring or Better Stack. UX inconsistencies between modules show up occasionally, a side effect of the wider Zoho product family.
Bottom line: Credible all-in-one pick for an SMB that wants one tool to cover uptime, servers, and APM at modest scale without enterprise procurement.
11. PRTG Network Monitor
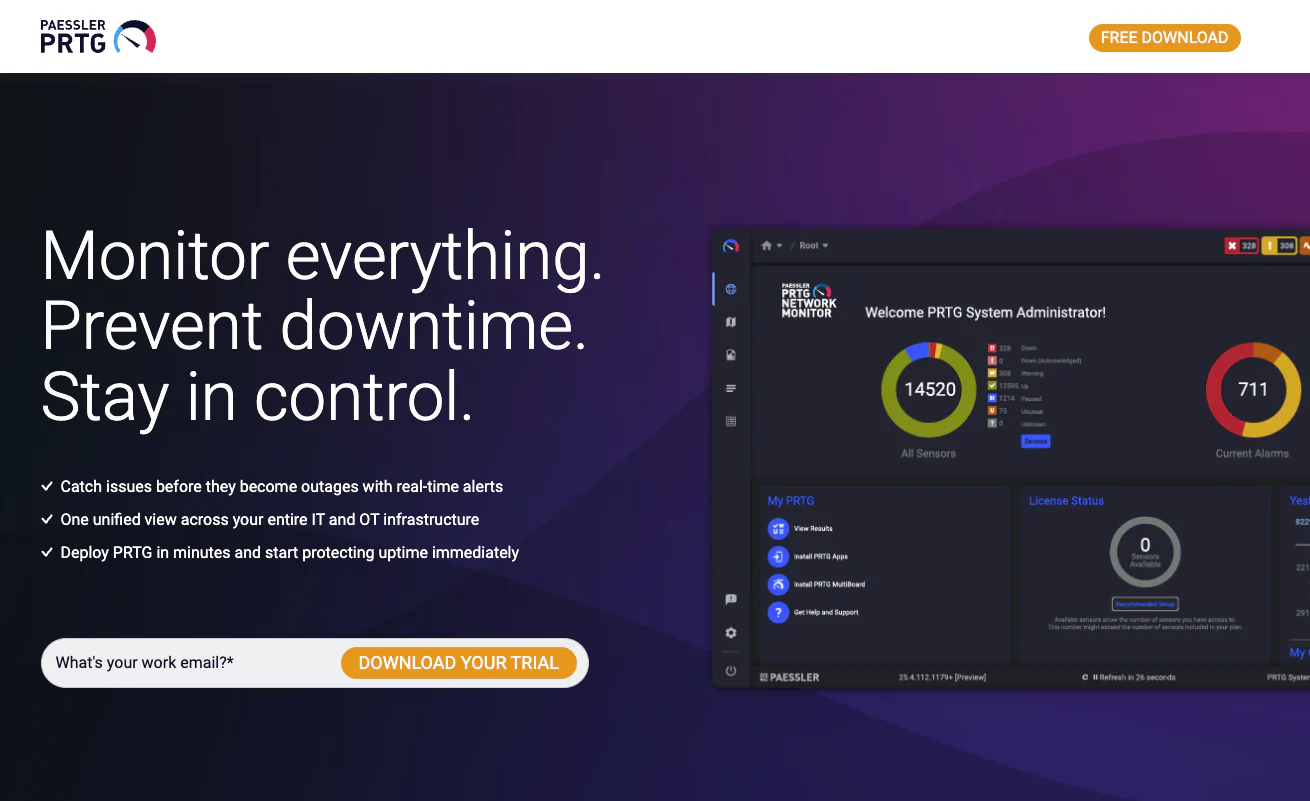
Best for: Networking-led IT teams that want one tool covering servers, network devices, and SNMP infrastructure.
PRTG, from Paessler, is a Windows-based monitoring platform with a sensor-based architecture. You buy a license for N sensors and allocate them across whatever you want to monitor — a sensor for CPU, a sensor for ping, a sensor for an SNMP OID, a sensor for an SSL certificate, and so on.
Key features:
- 200+ built-in sensor types covering servers, network devices, virtualization, IoT, and cloud.
- Mature SNMP and WMI support — strong for hybrid networks with switches, routers, UPSes, printers.
- Maps view for geographic and topological dashboards.
- Both perpetual and subscription licensing options.
Pricing reality: Free tier covers up to 100 sensors. Paid licenses are sensor-count-based — perpetual starts in the low four figures USD for around 500 sensors and scales from there. Predictable, but easy to underestimate sensor consumption.
What PRTG won't help with: Non-Windows deployment of the PRTG server itself, modern cloud-native idioms, AI-assisted anomaly detection at the level of the cloud incumbents, and unified status pages.
Bottom line: Best-in-class when network monitoring and server monitoring need to live in one tool. Less ideal as a pure cloud-native infrastructure pick.
12. Checkmk
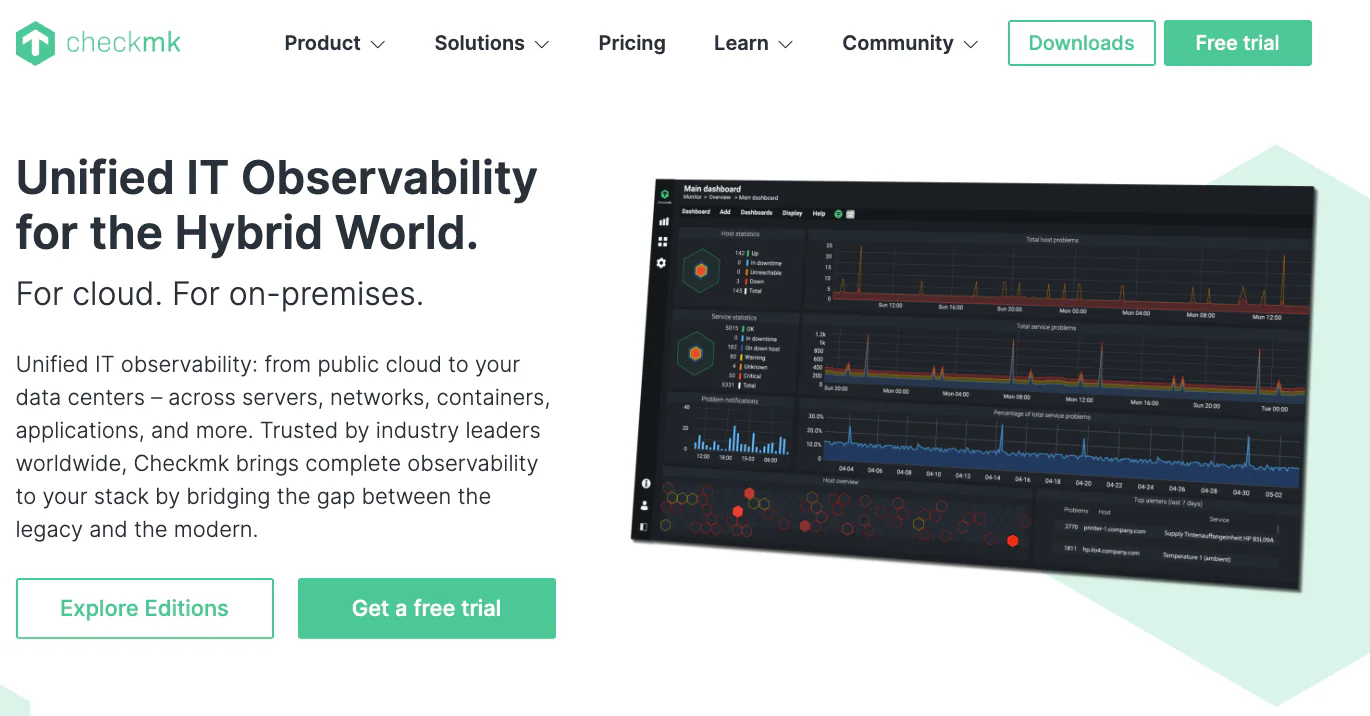
Best for: Hybrid IT teams that want Nagios-derived power with a modern UI and predictable pricing.
Checkmk is a modern descendant of the Nagios family — Nagios-compatible at the check-plugin level, but with a substantially better web UI, an opinionated agent (Checkmk agent), and a strong auto-discovery story. It deploys on Linux for the server and monitors Linux, Windows, container, network, and cloud workloads.
Key features:
- Auto-discovery that infers services from agents without manual config.
- Wide check plugin library — both native Checkmk plugins and Nagios-compatible ones.
- Distributed monitoring for multi-site or geographically distributed infrastructure.
- Raw Edition (OSS, free) and Enterprise Edition (commercial, per-host annual).
Pricing reality: Checkmk Raw is fully free OSS. Enterprise pricing is per host per year, with the per-host price decreasing as fleet size grows. More predictable than ingestion-based models, less aggressive than per-sensor licensing.
What Checkmk won't help with: Native uptime monitoring from external probe locations, status pages, native APM. The product is at its best as a deep infrastructure tool, less so as a "single pane of glass" replacement for an uptime or APM vendor.
Bottom line: Strong pick for hybrid IT teams that want the depth of Nagios without the UI debt. Pair with a dedicated uptime or APM tool depending on what else you need.
How to Pick the Right Tool for Your Team
The right infrastructure monitoring tool depends less on a feature matrix and more on team archetype. Three rough buckets:
Solo SRE or small engineering team (1–25 hosts)
Cognitive load is the constraint, not budget. The wrong choice here is a tool that demands more configuration than the infrastructure it watches. The right answer is an all-in-one platform with sensible defaults and a free or low-cost entry tier.
Best fits: Xitoring for engineering teams that want infrastructure + uptime + SSL + cron + status page on one bill. Better Stack if logs are the bigger pain than hosts. Site24x7 if budget is the dominant constraint and breadth matters more than depth. Avoid Datadog, New Relic, and Dynatrace at this scale — the cost-per-value math doesn't favor you.
Mid-size platform engineering team (5–50 engineers, 50–500 hosts)
Now the trade-off shifts: coverage and cost discipline matter equally, and someone on the team can own a slightly more involved tool. This is where most consolidation conversations happen — moving off the "Datadog for metrics + Pingdom for uptime + Statuspage for incident comms + Cronitor for cronjobs" sprawl.
Best fits: Xitoring for teams ready to consolidate four tools into one and keep the bill predictable. Datadog if APM is already core to how the team operates and the budget supports the unit economics. Self-hosted Prometheus + Grafana if a dedicated platform engineer is owning telemetry as part of the job. Checkmk Enterprise for traditional IT-led teams that want depth without ingestion-based billing.
Enterprise platform org (100+ engineers, 1,000+ hosts)
At this size, no single tool does everything well, and you'll likely run more than one anyway. The question is what sits at the center.
Best fits: Datadog or Dynatrace at the top for the engineering teams that need cross-product correlation across infra, APM, and logs. Self-hosted Prometheus + Grafana / Mimir / Loki underneath as the cost-controlled telemetry backbone for high-volume services. Zabbix or Checkmk for traditional infrastructure teams that haven't moved to cloud-native idioms. Xitoring as the dedicated uptime, SSL, and cronjob layer that's cheaper and more focused than wedging those into the enterprise platform.
Open-Source vs. Commercial Infrastructure Monitoring
The "open-source is free, commercial is expensive" framing is the most common — and most misleading — way teams approach this decision.
The honest version: open-source infrastructure monitoring is free in license and expensive in engineering time. Self-hosting Prometheus at HA, with long retention via Thanos or Mimir, with disciplined dashboard and alerting hygiene, is a 0.25–0.75 FTE commitment depending on scale. Self-hosting Zabbix at thousands of hosts is similar. A senior platform engineer's loaded cost is well into six figures annually; if running an OSS monitoring stack is consuming 30% of that engineer's time, the "free" tool costs $50,000+ a year.
Where OSS wins:
- The team already has dedicated platform engineering capacity that owns telemetry.
- Per-host or per-GB billing economics from commercial vendors would cost more than the engineering time it takes to run OSS.
- Vendor lock-in is a real concern — typically at regulated enterprises, scale-out infrastructure, or organizations with a long history of running their own infrastructure.
- The team is already deep in PromQL or Nagios-style check plugins and switching would cost more than maintaining.
Where commercial wins:
- The team is small enough that an extra 0.5 FTE of operational time is genuinely unavailable.
- Cross-product correlation (infra + APM + logs in one UI) is core to how the team debugs.
- Predictable monthly billing matters more than line-item cost optimization.
- The tool comes with breadth (uptime, SSL, cron, status pages, integrations) that would otherwise need to be assembled.
The decision isn't binary — most mature teams end up running a mix. The honest question is which side of that mix is closer to "actually free" given your team's real operating cost.
What Infrastructure Monitoring Tools Don't Solve
Three failure modes show up when teams confuse infrastructure monitoring with adjacent observability layers. Catching these up front saves a procurement cycle:
- Application Performance Monitoring (APM). If the pain is "my service is slow but the server looks fine," you need code-level tracing — flame graphs, span latency, transaction-level breakdowns. Infrastructure monitoring tools surface host health, not the path of a request through your application. Pair with a dedicated APM tool (Datadog APM, New Relic APM, Sentry, OpenTelemetry collectors) if this is the gap.
- Log aggregation and search. If the pain is "I need to grep across 50 services' logs to find what went wrong," you need a log management platform — Better Stack, Loki, Datadog Logs, or self-hosted ELK / OpenSearch. Most infrastructure tools don't index logs natively; the ones that do (Datadog, Site24x7, Better Stack) make it expensive enough to deserve its own budget conversation.
- Real user monitoring (RUM) and synthetic browser checks. If the pain is "the page loads on my laptop but customers say it's slow," you need RUM or full-browser synthetic monitoring — Datadog RUM, New Relic Browser, Sentry, or a dedicated synthetic monitoring tool. Infrastructure monitoring sees the server respond fast; RUM sees the user wait for the browser to finish.
- Security monitoring (SIEM and EDR). Intrusion detection, log forensics for security events, and endpoint detection live in a different product category — security information and event management. Infrastructure monitoring tools that bolt on "security modules" are usually thin compared to dedicated SIEM products.
Knowing the boundary lets you pick a focused infrastructure tool without resenting it later for not being something it never claimed to be.
Frequently Asked Questions
What is the difference between infrastructure monitoring and observability?
Infrastructure monitoring tracks the health of the systems your application runs on — hosts, network, cloud resources, containers, plus reachability and certificate signals. Observability is broader: it includes infrastructure monitoring plus application performance monitoring (traces), log management, and the ability to ask arbitrary questions of telemetry to debug unknown failure modes. Every observability platform includes infrastructure monitoring; not every infrastructure monitoring tool is full observability.
What are the best free infrastructure monitoring tools?
For a managed service, Xitoring's free tier covers basic server monitoring and uptime checks with no credit card required. For self-hosted, the strongest free options are Prometheus + Grafana (cloud-native standard, OSS), Zabbix (traditional enterprise, OSS), Checkmk Raw (Nagios-derived, OSS), and Nagios Core (the original). New Relic also offers a generous free tier (100 GB ingest, 1 full user) for managed observability.
How much do infrastructure monitoring tools cost at 50 servers?
The realistic range varies by an order of magnitude. Xitoring or Site24x7 land in the low-to-mid hundreds of dollars per month all-in. Datadog Infrastructure Monitoring at 50 hosts is $750/month at the Pro tier list price, but routinely runs $2,000–$4,000/month once custom metrics, containers, and add-on modules are factored in. Dynatrace Infrastructure-only at 50 hosts is around $1,450/month; Full-Stack is closer to $2,900. Self-hosted Prometheus + Grafana is free in license but consumes ~0.25 FTE of engineering time at this scale.
Do I need a separate tool for uptime monitoring if I have infrastructure monitoring?
Sometimes. Infrastructure monitoring watches the inside of your hosts — CPU, memory, services. Uptime monitoring watches the outside — is the website reachable, does the API respond, is the TCP port open from multiple geographies. Most "infrastructure-only" tools (Prometheus, Zabbix, Checkmk Enterprise) don't ship native external probing, so teams using them bolt on a separate uptime tool. Platforms like Xitoring, Datadog, and Site24x7 ship both natively.
Is Prometheus enough for production infrastructure monitoring?
For a Kubernetes-native team with a dedicated platform engineer or SRE, yes — Prometheus + Alertmanager + Grafana is a production-grade stack. For a small team without that engineering capacity, "enough" hides a lot of work: you'll need to design retention (Prometheus alone keeps weeks, not years), set up high availability (Thanos, Mimir, or Cortex), build alerting routing, run agent deployment, and maintain dashboards. The license is free; the operational time isn't.
Can one tool handle infrastructure monitoring across AWS, Azure, and on-prem?
Yes, and the strongest tools in this list all support that — Datadog, New Relic, Dynatrace, Xitoring, Zabbix, and Checkmk all run agents in any of those environments. The thing to verify isn't "does it support AWS" (everything does) but "does it support our exact mix of Linux distros, Windows Server versions, and container runtimes." That's where shortlists narrow quickly.
How is infrastructure monitoring different from APM?
Infrastructure monitoring measures the host and the services running on it — CPU, memory, disk, service health. APM measures the application running on those hosts — request latency, throughput, error rates, distributed traces across services. A host with healthy CPU can still be serving 5-second responses if the application is slow; infrastructure monitoring won't catch that, but APM will. Most mature teams run both, often from different vendors, sometimes from the same.
Bottom Line
The infrastructure monitoring category in 2026 looks fundamentally different from the one teams were buying into five years ago. Standalone single-purpose tools are losing ground to platforms that consolidate hosts, uptime, SSL, cronjobs, and status pages into one bill and one alerting engine. The enterprise incumbents are still strong in their lanes — Datadog and Dynatrace for cloud-native organizations with budget, SolarWinds and PRTG for mature on-prem IT, Zabbix and Prometheus for OSS-first engineering orgs. The big shift is at the small and mid-market end, where teams that used to assemble four tools are choosing one platform that does the job.
For most engineering teams shipping web services this year — anywhere from a handful of hosts to a few hundred, on a mix of Linux and Windows, on cloud or hybrid infrastructure — the right answer is the platform that covers the most ground without making you assemble it. That's the case Xitoring was built for, and it's the case the rest of the market is increasingly trying to catch up to. Start with the free tier, add hosts as you grow, and skip the four-tool stack the next CFO conversation is going to ask you about anyway.