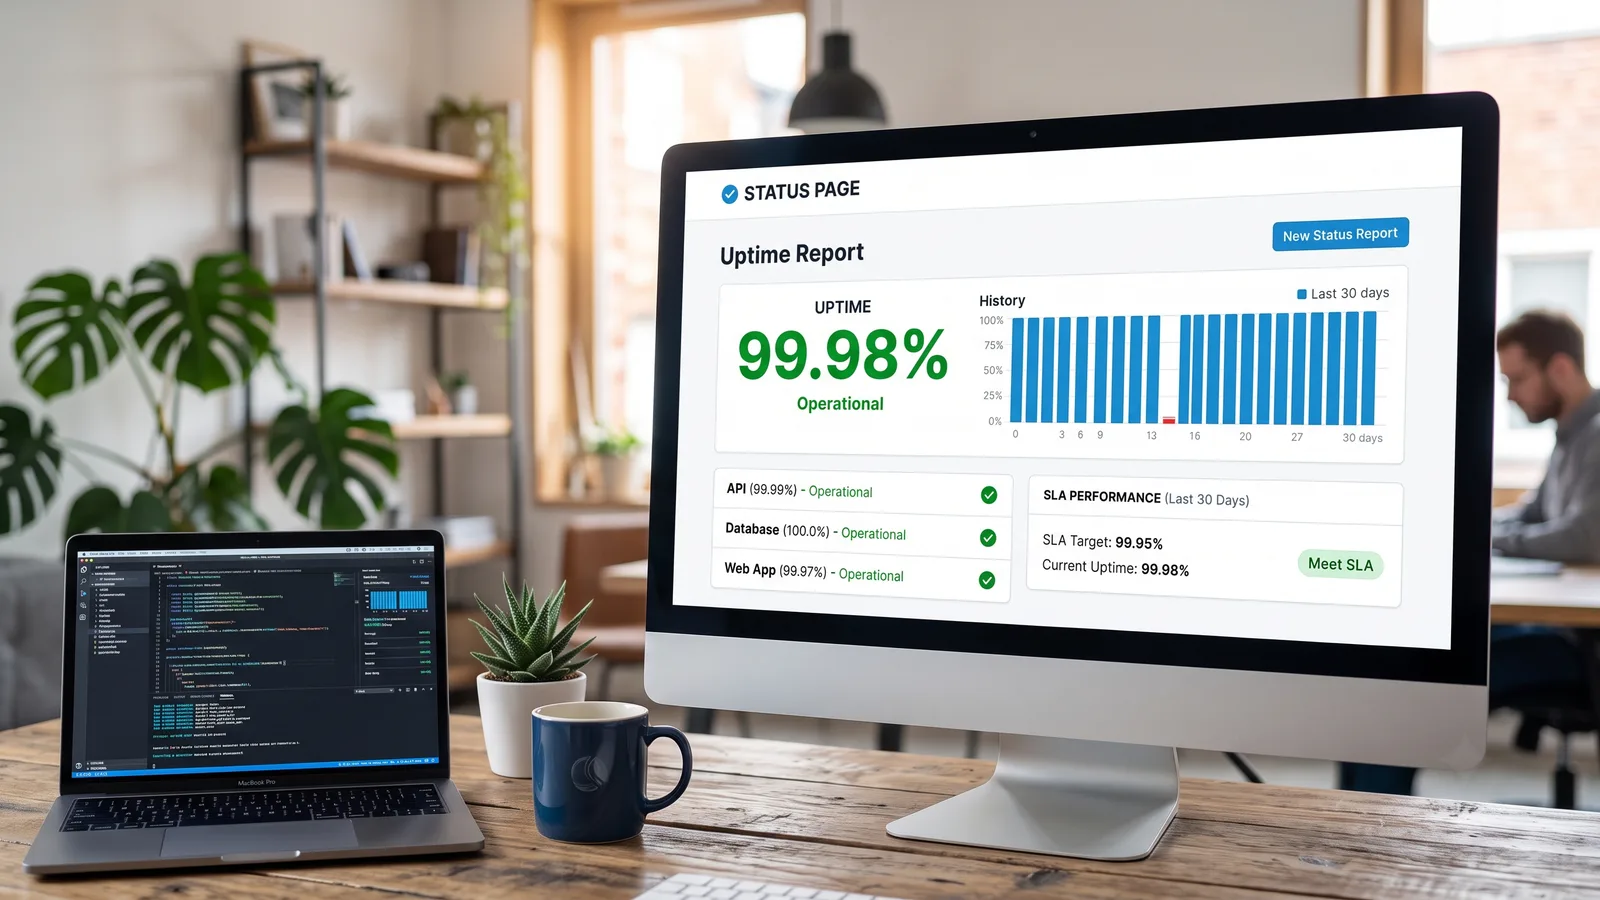
There's a specific moment in every enterprise sales cycle where someone from the buyer's side asks for your uptime history. If your answer is a number in a slide deck, you've just introduced friction — because a self-reported figure with no methodology behind it is not evidence, and the procurement team knows it.
A status page that publishes real uptime, continuously, from monitoring data you don't control the outcome of, is the answer to that question before anyone asks it. This is how to build one that holds up.
Why self-reported uptime doesn't count
Three reasons buyers discount it, all reasonable:
It's measured from inside. If your availability comes from your own load balancer or application metrics, it structurally excludes every failure between your edge and the customer: DNS resolution, TLS negotiation, BGP routing, CDN problems. Those are real outages for the user and invisible to internal instrumentation. An uptime figure derived from the inside is answering "did our servers think they were fine," which is not the question.
The methodology is undisclosed. 99.95% over what window? Measured how often? Counting which failures? Without those, the number isn't comparable to anything, including your competitor's number.
Nobody publishes a bad month voluntarily. A figure that only appears in sales materials is selected. A figure that updates automatically every day, including on the bad days, is not — and that difference is the entire source of the trust.
The fix for all three is the same: measure from outside your infrastructure, publish continuously and automatically, and state the method.
What to actually publish
A credible uptime report has five components. Most status pages ship two and wonder why enterprise buyers still ask for a spreadsheet.
1. Scope — what's being measured
"Uptime: 99.97%" for a platform with a web app, an API, a webhook delivery service, and a background job pipeline is nearly meaningless. Which of those?
Publish per-component availability, with the components matching how customers think about your product:
| Component | 30-day uptime | 90-day |
|---|---|---|
| Web application | 99.98% | 99.96% |
| REST API | 99.99% | 99.97% |
| Webhook delivery | 99.91% | 99.89% |
| Scheduled jobs | 100% | 99.99% |
An aggregate number on top is fine as a headline, but say how it's derived — a straight mean across components and a traffic-weighted figure can differ meaningfully, and if you don't say which, a careful reader assumes you chose the flattering one.
2. Window — over what period
Publish at least two windows, because they answer different questions:
- 30-day (or current calendar month). Matches most SLA billing periods. This is the number tied to credits.
- 90-day. Shows whether last month was typical or an anomaly.
- 12-month. What enterprise procurement will ask for. If you have the history, publish it; it's the strongest single trust signal on the page.
Label whether each is rolling or calendar. A rolling 30-day figure and a calendar-month figure will disagree, and a customer who notices the discrepancy without an explanation assumes something worse than the truth.
3. Method — how it's calculated
One short paragraph, linked from the page. It should state:
- The formula — time-based (
(total − downtime) / total) or request-based (successful / valid requests). These produce different numbers for the same incident, so this isn't a detail. - The check interval, since it sets the resolution of the whole figure. Five-minute checks cannot credibly substantiate a 99.99% claim.
- The number and rough location of monitoring locations, and your confirmation rule — how many regions must agree before an outage is recorded.
- Who does the measuring. "Measured by an independent third-party monitoring service from 15 global locations at 60-second intervals" is the sentence that ends the methodology conversation.
4. Exclusions — what doesn't count
State them on the page rather than burying them in the MSA. Standard and defensible:
- Announced maintenance, bounded and with notice — typically up to 4 hours per month, 72 hours in advance.
- Customer-caused failures — exceeded documented rate limits, misconfigured DNS or webhooks on their side.
- Failures outside your control boundary — with care. Blanket "upstream provider" exclusions get struck in enterprise negotiation, because you chose the provider.
What should not be excluded: unannounced maintenance, partial degradation you'd rather call "degraded performance," and anything you decided after the fact wasn't really an outage. Retroactive exclusions are the fastest way to make the whole page worthless.
5. Incident history — the outages themselves
The uptime percentage is the summary; the incident log is the evidence. Each entry needs a start and end timestamp in UTC, the affected components, a plain-language description, and — for anything significant — a root cause and what changed as a result.
Counterintuitively, a page with visible incidents is more persuasive than one showing an unbroken wall of green. Buyers don't believe perfect. They believe a team that detects problems quickly, communicates during them, and fixes causes — and the incident log is the only place you can demonstrate that.
Maintenance windows: get this right up front
The single most common source of disagreement between a vendor's uptime figure and a customer's perception.
The rule that works: maintenance only excludes from uptime if it was declared before it started. Not during, not after. That means declaring the window in the same system that measures your uptime, so the exclusion is applied automatically by the tool rather than by someone editing a spreadsheet at month end.
Practically:
- Schedule the window in your monitoring platform, with the affected checks and a time range. Maintenance management exists for this — it suppresses alerts for the window and marks the period as excluded rather than down.
- Publish it on the status page in advance, so customers see it coming.
- If you overrun the window, the overrun counts as downtime. A 2-hour window that runs 3 hours is 1 hour of recorded downtime. This rule is what keeps maintenance windows honest, and enterprise customers will look for it.
Also worth deciding explicitly: whether your internal SLO counts maintenance even though your SLA excludes it. Many teams do count it internally, on the reasonable grounds that customers experience planned and unplanned unavailability identically. It also creates pressure toward zero-downtime deploys, which is where you want to end up.
Partial outages and the degraded state
Binary up/down doesn't describe most real incidents. Your API is up but p99 latency has tripled. Checkout works but webhook delivery is 20 minutes behind. Reporting either of those as 100% uptime is technically defensible and reads as dishonest to anyone affected.
Use three states, and define them numerically:
- Operational — all checks passing, response time within threshold.
- Degraded — checks passing but a defined performance threshold breached (e.g. p95 response time above 2s for more than 5 minutes), or a non-critical component failing.
- Outage — checks failing from multiple confirmed regions.
Then decide how degraded counts toward uptime and say so. The common approaches are to count it as full downtime (conservative, easiest to explain), to count it fractionally, or to exclude it from the uptime figure but display it prominently on the timeline. Any of the three is fine. Choosing silently is not.
Defining "degraded" as a latency threshold means you need response-time data alongside availability, which is worth checking your monitoring actually retains at the granularity you plan to report.
Wiring it up
The mechanics, in order:
1. Define components from the customer's point of view. Not your service topology. "Webhook delivery" is a component; "Kafka consumer group 3" is not.
2. Put an external check on each one. A real user-path check, not a /health endpoint that returns 200 whenever the process is alive. For an API component, check an actual authenticated read. For checkout, check the path that touches the payment provider. Health endpoints that don't exercise dependencies are how you publish 100% uptime through an outage.
3. Match the interval to the number you intend to publish. 60 seconds for 99.9–99.95%. 30 seconds or faster if you plan to claim 99.99%, since a single failed 5-minute check would exceed that month's entire allowance on its own.
4. Require multi-region confirmation before recording an outage. One probe failing is usually a network path having a bad minute. Two or three regions agreeing is an outage. Without this rule your published figure will be depressed by false positives, and you'll be tempted to start manually correcting it — which reintroduces exactly the credibility problem you built the page to solve.
5. Publish from the monitoring data automatically. This is the load-bearing step. If a human transcribes numbers onto the status page monthly, the page is a report, not evidence — and it will drift. A public status page driven by the same checks that page your on-call cannot disagree with your internal view, because it's the same data.
6. Add subscriptions. Email, RSS, or webhook notifications on incidents. Customers who can subscribe stop opening tickets to ask whether it's just them, and it converts the page from a thing people visit during an outage into a thing they trust between outages.
7. Keep an internal version if you need one. Some components shouldn't be public — internal tooling, per-customer infrastructure. A private status page covers those without over-disclosing on the public one.
Reporting a month you missed
You will miss a month eventually. How you publish it determines whether it costs you an account.
Publish the real number. Do not quietly recalculate, retroactively extend a maintenance window, or reclassify the outage as degraded. The customers most likely to check are the ones most likely to churn over being handled, and an adjusted number is discoverable — they have their own logs.
Lead with the credit. If your SLA owes credits, apply them before the customer asks. Unprompted credit application is one of the highest-trust actions available to a vendor, and it costs you a number you already owed.
Publish the root cause and the change. Not a lengthy engineering post-mortem — a paragraph. What broke, why the impact lasted as long as it did, and the specific change that shortens the next one. "Detection took 22 minutes because no check covered webhook queue depth; we've added one with a 5-minute threshold" is a sentence that rebuilds more confidence than the outage cost.
Don't change your SLA target reactively. Lowering your commitment after a bad month reads as capitulation. If your measured history genuinely doesn't support the number you've committed to, that's a real conversation to have — but have it deliberately, with 12 months of data, not in the week after an incident.
Related reading
- SLA vs SLO vs SLI: What's the Difference? — the target you're reporting against, and why your internal one should be stricter
- 99.9% vs 99.99% Uptime: The Real Downtime Numbers — allowed downtime per tier and how check interval limits what you can claim
- Error Budgets Explained — spending the allowance deliberately instead of discovering it's gone
- Incident Severity Levels: SEV1–SEV5 Explained — deciding what to declare, and how fast customers hear about it
- What Is a Status Page? — the fundamentals, if you don't have one yet
- How a Public Status Page Helps Your Business — the commercial case
- Best Status Page Providers — tooling comparison
- What Is Uptime Monitoring? The 2026 Guide — the external measurement that makes a published number credible
- How to Achieve 99.99% Uptime — earning the figure before you publish it
- Public Status Page (product) — publish uptime straight from the checks that page your on-call
Frequently Asked Questions
Should scheduled maintenance be excluded from status page uptime?
Under most SLAs, yes — but only when it was announced in advance and stayed within its declared bounds, typically up to 4 hours per month with 72 hours' notice. Maintenance declared during or after the fact counts as downtime, and so does any overrun past the scheduled window. Declare windows in the tool that measures your uptime so the exclusion is automatic rather than a manual month-end adjustment.
How far back should a status page show uptime history?
Publish 30-day and 90-day figures at minimum, and 12 months if you have the data — that's what enterprise procurement asks for, and it's the strongest trust signal on the page. Label each window as rolling or calendar, since the two produce different numbers and an unexplained discrepancy reads worse than a lower figure.
Can I calculate SLA uptime from my own servers?
You can, but buyers will discount it. Internal measurement structurally misses DNS, TLS, routing, and CDN failures — real outages for your users that your own infrastructure never sees. Third-party external monitoring is what auditors and procurement teams accept, precisely because you don't control the outcome.
How should partial outages be reported?
Use a three-state model — operational, degraded, outage — with "degraded" defined by a numeric threshold such as p95 response time above 2 seconds for 5 minutes. Then state explicitly how degraded periods count toward your uptime figure. Counting them as full downtime is the most conservative and easiest to explain; excluding them silently is what damages credibility.
What uptime should a status page display if we've had a bad month?
The real one. Retroactively adjusting a figure or extending a maintenance window after an incident is discoverable — customers keep their own logs — and it destroys the page's entire value. Publish the number, apply any SLA credits before being asked, and add a short root-cause note with the specific change you've made.
Does a status page need to be automated?
Effectively, yes. A page a human updates monthly is a report, and it drifts from reality in exactly the moments that matter. Driving the page from the same monitoring checks that alert your on-call guarantees your public number and your internal number can't disagree, which is the property that makes it evidence rather than marketing.