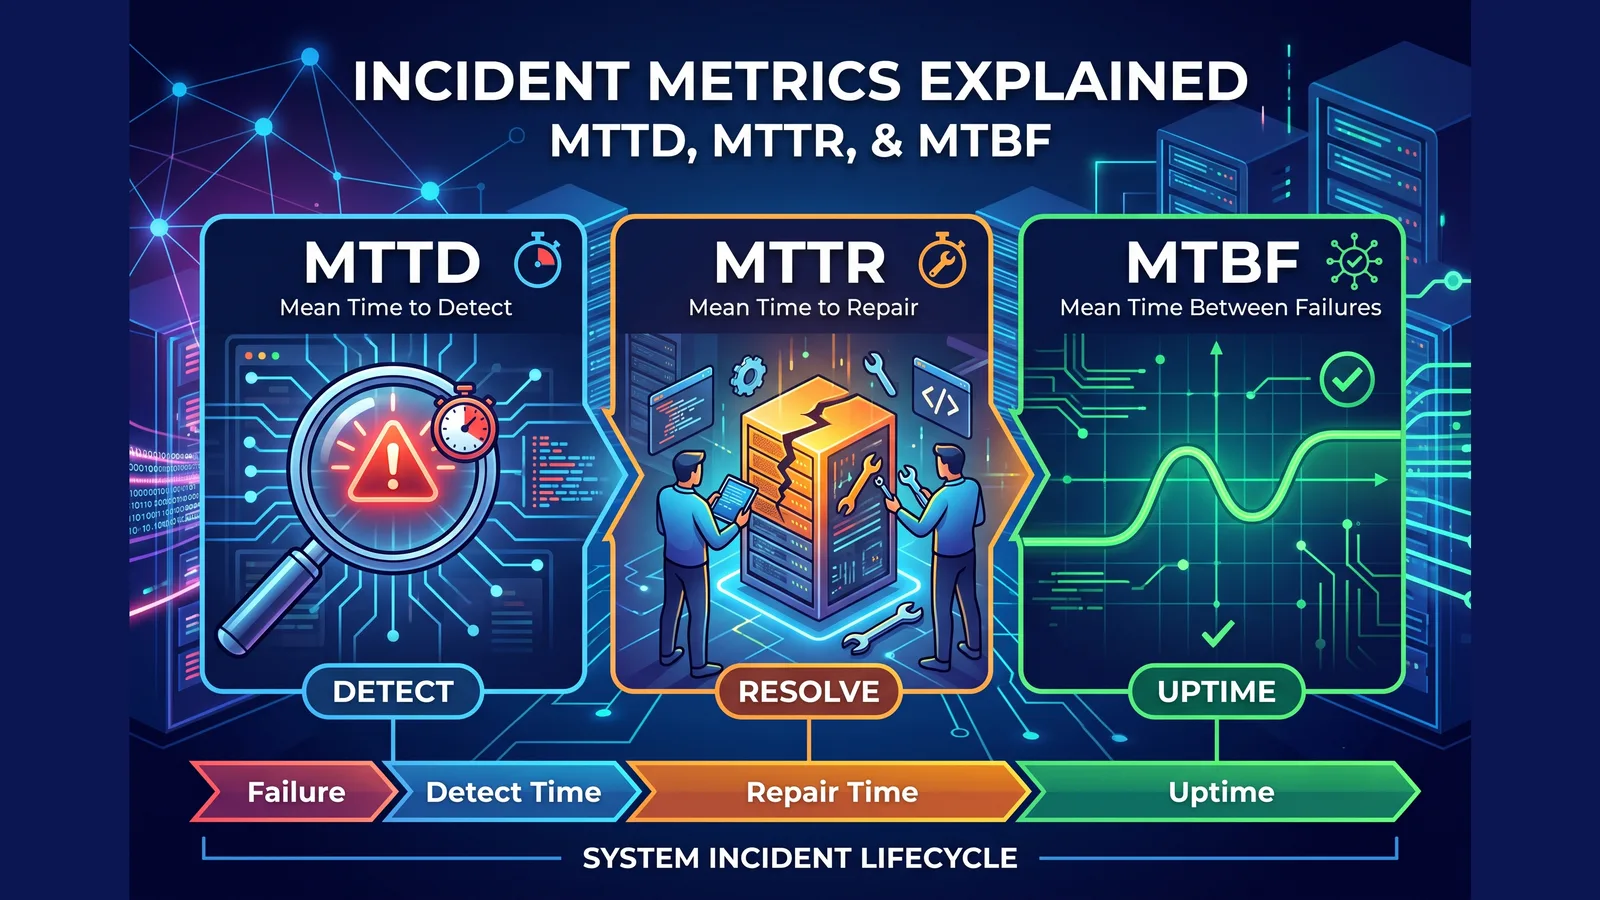
Availability tells you how much downtime you had. It doesn't tell you why, and it doesn't tell you which part of your incident response to fix. That's what the mean-time family of metrics is for — and they're worth understanding properly, because they decompose an outage into stages you can attack independently.
The important insight, before the definitions: total downtime is a sum of stages, and most teams spend their money on the wrong one.
downtime per incident = detect + acknowledge + diagnose + repair
Teams instinctively invest in the repair stage — better runbooks, faster rollbacks, more automation. But in a lot of organisations the detect stage is the biggest slice and the cheapest to shrink. If it takes you 22 minutes to notice an outage and 8 minutes to fix it, buying a faster deploy pipeline is solving the smaller half of the problem.
The five metrics
| Metric | Stands for | Measures | Formula |
|---|---|---|---|
| MTTD | Mean Time To Detect | How long a failure goes unnoticed | total detection time ÷ number of incidents |
| MTTA | Mean Time To Acknowledge | Alert fired → human takes ownership | total acknowledgement time ÷ number of alerts |
| MTTR | Mean Time To Repair or Recovery or Resolve | Ambiguous — see below | total repair time ÷ number of incidents |
| MTBF | Mean Time Between Failures | How often things break | total operational time ÷ number of failures |
| MTTF | Mean Time To Failure | Lifespan of a non-repairable component | total operating time ÷ number of units |
The MTTR ambiguity is a real problem
MTTR is used for at least three different things, and two teams comparing their MTTR are often measuring different intervals:
- Mean Time To Repair — hands-on-keyboard fixing time only. Excludes detection and response. Smallest number.
- Mean Time To Recovery — alert fired → service restored. Includes acknowledgement and diagnosis. The most operationally useful of the three.
- Mean Time To Resolve — failure started → root cause permanently fixed. Includes the follow-up work that lands next sprint. Largest number, by a lot.
When a vendor advertises "reduce MTTR by 60%," they almost always mean recovery, and often they mean the detect-and-acknowledge portion specifically — which is the honest part of the claim, since that's the piece tooling can genuinely compress.
Pick one definition, write it down, and don't change it. Recovery (alert → restored) is the right default for most teams. Changing the definition mid-year is the easiest way to show improvement you didn't earn.
MTBF and what it's actually good for
MTBF = total operational time / number of failures
A service that ran 720 hours in a month with 4 incidents has an MTBF of 180 hours. MTBF answers "how often," where MTTR answers "how long."
The pairing matters because they can move in opposite directions and both be fine. A team that starts deploying more frequently may see MTBF drop (more changes, more small incidents) while MTTR also drops (smaller changes are easier to revert) — and end up with better availability overall. Judging that team on MTBF alone would tell you to slow down, which would be the wrong call.
MTBF is also where MTTF gets confused in: MTBF is for things you repair and put back into service, MTTF is for things you replace. Servers and services have an MTBF. A disk has an MTTF — which is exactly why disk health monitoring reads SMART attributes for predictive failure rather than waiting for a failure to average.
How they relate to availability
The connection is direct:
availability = MTBF / (MTBF + MTTR)
Run that with real numbers. A service with MTBF of 180 hours and MTTR of 30 minutes:
180 / (180 + 0.5) = 99.72%
Cut MTTR to 10 minutes and nothing else changes:
180 / (180 + 0.167) = 99.91%
You just moved from below three nines to above it without preventing a single incident. That's the argument for investing in response before prevention: shortening recovery is usually cheaper than eliminating failures, and it pays into the same error budget.
A worked month
One service, July, four incidents. Times in minutes.
| Incident | Failure → detected (MTTD) | Detected → acked (MTTA) | Acked → restored | Total downtime |
|---|---|---|---|---|
| #1 Bad deploy | 1 | 2 | 4 | 7 |
| #2 Upstream API timeout | 14 | 3 | 9 | 26 |
| #3 Disk full on log volume | 38 | 2 | 6 | 46 |
| #4 Cert expiry on internal service | 21 | 4 | 5 | 30 |
| Mean | 18.5 | 2.75 | 6 | 27.25 |
MTBF = (44,640 minutes in July − 109 downtime) ÷ 4 ≈ 11,133 minutes (about 7.7 days).
Now read the table. Repair time is already good — a 6-minute mean is a competent team with working runbooks. The problem is glaring: MTTD is 18.5 minutes, three times the repair time. Two-thirds of all downtime this month was spent not knowing.
And look at which incidents caused it. #1 was caught in a minute because there was a deploy in progress and someone was watching. #2, #3, and #4 all took 14–38 minutes because nothing was watching that specific failure mode:
- #3 — a disk filling up is a metric threshold, entirely predictable, and should have alerted at 85% rather than at 100% when the service died. That's server monitoring with a threshold, not an outage.
- #4 — certificate expiry is known weeks in advance. SSL monitoring with a 30-day warning turns this from a 30-minute outage into a calendar reminder.
- #2 — an upstream dependency degrading needs an external check on the endpoint that depends on it, because your own service was "up" the entire time.
None of those fixes are architectural. They're monitoring coverage. That's the typical shape of an MTTD problem: not a slow alerting system, but no alert configured for the thing that broke.
Which metric to fix first
In rough order of return on effort:
1. MTTD. Almost always the biggest and cheapest win. Every minute here is a minute of pure downtime with nobody even working the problem. Fixing it means coverage (is there a check for this failure mode at all?) and interval (60-second checks, not 5-minute). External synthetic checks from multiple regions catch the failures your internal metrics structurally cannot — DNS, TLS, routing, CDN.
2. MTTA. Second cheapest. If alerts land in a Slack channel nobody watches at 3am, your acknowledgement time is however long until someone wakes up naturally. Fix with real paging — SMS, phone call, push — plus escalation policies that reassign after a few unacknowledged minutes. A single unacknowledged page can burn an entire month's error budget.
3. Repair time. Runbooks for your top five failure modes, one-command rollback, and pre-authorised remediation so the on-call doesn't need to wake a manager for permission. Real but slower work.
4. MTBF. The most expensive and the slowest to move, because it means redundancy, dependency isolation, better testing, and change management. Worth doing — just not first.
The averaging mistake
Every one of these metrics starts with "mean," and means lie about incident data.
Consider two months with identical 20-minute MTTR:
- Month A: four incidents at 20 minutes each.
- Month B: three incidents at 2 minutes, one at 74 minutes.
Same average. Completely different months. Month B had a catastrophe that a single number erased.
Three corrections:
- Report percentiles alongside the mean. P50 and P90 recovery time tell you far more than the average. A P50 of 4 minutes with a P90 of 68 tells you the routine case is handled and the unusual case isn't.
- Segment by severity. Averaging a P1 total outage with a P4 cosmetic bug produces a number that describes neither. Track your P1/P2 metrics separately.
- Report the count, not just the mean. MTTR improving while incident count triples is not an improvement.
There's also a gaming risk worth naming: if MTTR becomes a management target, the incentive is to close incidents early, downgrade severity, or classify outages as "degradations." Use these metrics to find where to invest, not to grade people. The moment they're a performance metric, they stop being a measurement.
Instrumenting this
You need timestamps for four moments per incident: failure began, detected, acknowledged, restored. Two of those come from monitoring and two from your incident process.
- Failure began and detected come from your monitoring system's check history. The gap between the last successful check and the first failed one bounds your true failure start; a 60-second interval gives you ±1 minute, a 5-minute interval gives you ±5 — which is enough error to make MTTD meaningless. Check interval is the resolution limit on this whole exercise.
- Acknowledged comes from your alerting: who acked, when. If your alerting has no acknowledgement concept, you can't measure MTTA and you almost certainly have a bad one.
- Restored comes from the first successful check after the failure sequence.
Xitoring provides the monitoring half: 60-second multi-protocol checks from 15+ global probing nodes for MTTD, alerting across 20+ channels with acknowledgement and escalation for MTTA, and per-check incident history so you can pull the timestamps rather than reconstruct them from Slack scrollback. Combined with server monitoring on metric thresholds — the disk-full and memory-pressure class of incident that never reaches an outage if you catch it at 85% — most of the MTTD problem in the worked example above is configuration, not engineering.
The free plan covers 8 checks with no credit card, which is enough to start collecting real detection timestamps this week.
Related reading
- Error Budgets Explained — where the minutes you save on MTTD end up
- SLA vs SLO vs SLI: What's the Difference? — the targets these metrics feed
- 99.9% vs 99.99% Uptime: The Real Downtime Numbers — how little room you have at each tier
- Incident Severity Levels: SEV1–SEV5 Explained — the targets that turn these measurements into commitments
- Incident Management and Alert Fatigue — why noisy alerting quietly destroys MTTA
- A Beginner's Guide to Real-Time Server Alerts — the alerting setup that makes fast detection possible
- Common Causes of Server Downtime (and Fixes) — the failure modes worth having checks for
- What Is Uptime Monitoring? The 2026 Guide — where the detection timestamps behind MTTD actually come from
- How to Achieve 99.99% Uptime — why four nines removes the human from the recovery path entirely
Frequently Asked Questions
What's the difference between MTTR and MTTD?
MTTD (Mean Time To Detect) measures how long a failure goes unnoticed — from the moment it starts to the moment monitoring or a human catches it. MTTR measures the time from detection onward, through acknowledgement and repair, until service is restored. They're sequential stages of the same outage, and total downtime is roughly MTTD + MTTR. Most teams have a far worse MTTD than they assume.
Does MTTR mean repair, recovery, or resolve?
All three are in common use, which is why comparing MTTR across teams is unreliable. Repair is hands-on fixing time only; recovery is alert-to-restored; resolve includes the permanent root-cause fix, which may land weeks later. Recovery is the most useful default. Whichever you pick, document it and keep it fixed — redefining MTTR is the easiest way to fake an improvement.
What is a good MTTR?
It depends entirely on your availability target, not on an industry benchmark. If you're committed to 99.9% monthly availability, your total error budget is 43 minutes, so a 20-minute mean recovery time gives you about two survivable incidents per month. At 99.99% — a 4-minute monthly budget — no human-in-the-loop MTTR is good enough, and recovery has to be automated. Work backwards from the SLO.
How do you calculate MTBF?
Divide total operational time by the number of failures in that period. A service that ran 720 hours with 4 failures has an MTBF of 180 hours. MTBF applies to repairable systems that go back into service; MTTF applies to components you replace instead, like disks.
How do MTTR and MTBF relate to uptime percentage?
Directly: availability = MTBF / (MTBF + MTTR). With an MTBF of 180 hours, cutting MTTR from 30 minutes to 10 raises availability from 99.72% to 99.91% without preventing a single incident. This is why shortening recovery is usually a cheaper path to an availability target than eliminating failures.
Which incident metric should we improve first?
MTTD, nearly always. It's typically the largest share of total downtime and the cheapest to fix, because the usual cause isn't a slow alerting system — it's that no check existed for the thing that broke. Add external checks on every user-facing endpoint, threshold alerts on disk and memory, and certificate expiry warnings, then move to MTTA by making sure alerts actually page a human.
Should MTTR be a team performance target?
No. Once it's a target, the incentive shifts to closing incidents early, downgrading severity, and reclassifying outages as degradations — and you lose the measurement. Use these metrics to identify which stage of incident response to invest in, and report percentiles and incident counts alongside the means so a single bad outage isn't averaged out of existence.